Finance Portfolio Management
VerifiedAdded on 2023/03/20
|12
|2430
|77
AI Summary
This report provides information about investment strategies and portfolio management in finance. It covers topics such as calculating returns, variances, and correlations for stocks and index, analyzing portfolio performance and risk, and detecting limitations of the analysis.
Contribute Materials
Your contribution can guide someone’s learning journey. Share your
documents today.
Running head: FINANCE PORTFOLIO MANAGEMENT
Finance Portfolio Management
Name of the Student:
Name of the University:
Authors Note:
Finance Portfolio Management
Name of the Student:
Name of the University:
Authors Note:
Secure Best Marks with AI Grader
Need help grading? Try our AI Grader for instant feedback on your assignments.
FINANCE PORTFOLIO MANAGEMENT
1
Table of Contents
Introduction:...............................................................................................................................2
Part 1:.........................................................................................................................................2
a. Calculating the discrete return, arithmetic return and geometric returns for the stock:.........2
b. Calculating the variance returns of each stock with covariance and correlation coefficients:
....................................................................................................................................................3
c. Comparing the results, while indicating about the events that took place during the period:3
Part 2:.........................................................................................................................................4
a. Computing the weekly rate of return and variance of an equally weighted portfolio:...........4
b. Examining and comparing the pattern of the returns of the portfolio with those of the
individual stocks and stock index, while comparing the variances:..........................................5
Part 3:.........................................................................................................................................5
a. Converting the yields to weekly numbers:.............................................................................5
b. Computing beta and Jensen’s Alpha for each stock:.............................................................6
c. Calculating total risk of the portfolio, while partitioning the risk on the basis of systematic
and unsystematic risk:................................................................................................................6
d. Commenting on the stock and portfolio performance:..........................................................7
Part 4: Indicating how useful was the analysis, while detecting the limitations of the analysis7
Conclusion:................................................................................................................................8
References and Bibliography:....................................................................................................9
FINANCE PORTFOLIO MANAGEMENT
2
Introduction:
The report provides information about the different levels of investment strategies that
can be used by investors while detecting a reliable investment options. The stocks of Apple
Inc. Walmart, McDonald’s and index NYSE Composite has been used for conducting the
relevant investment strategies. Therefore, with the help of adequate investment strategy
relevant investment option can be selected.
Part 1:
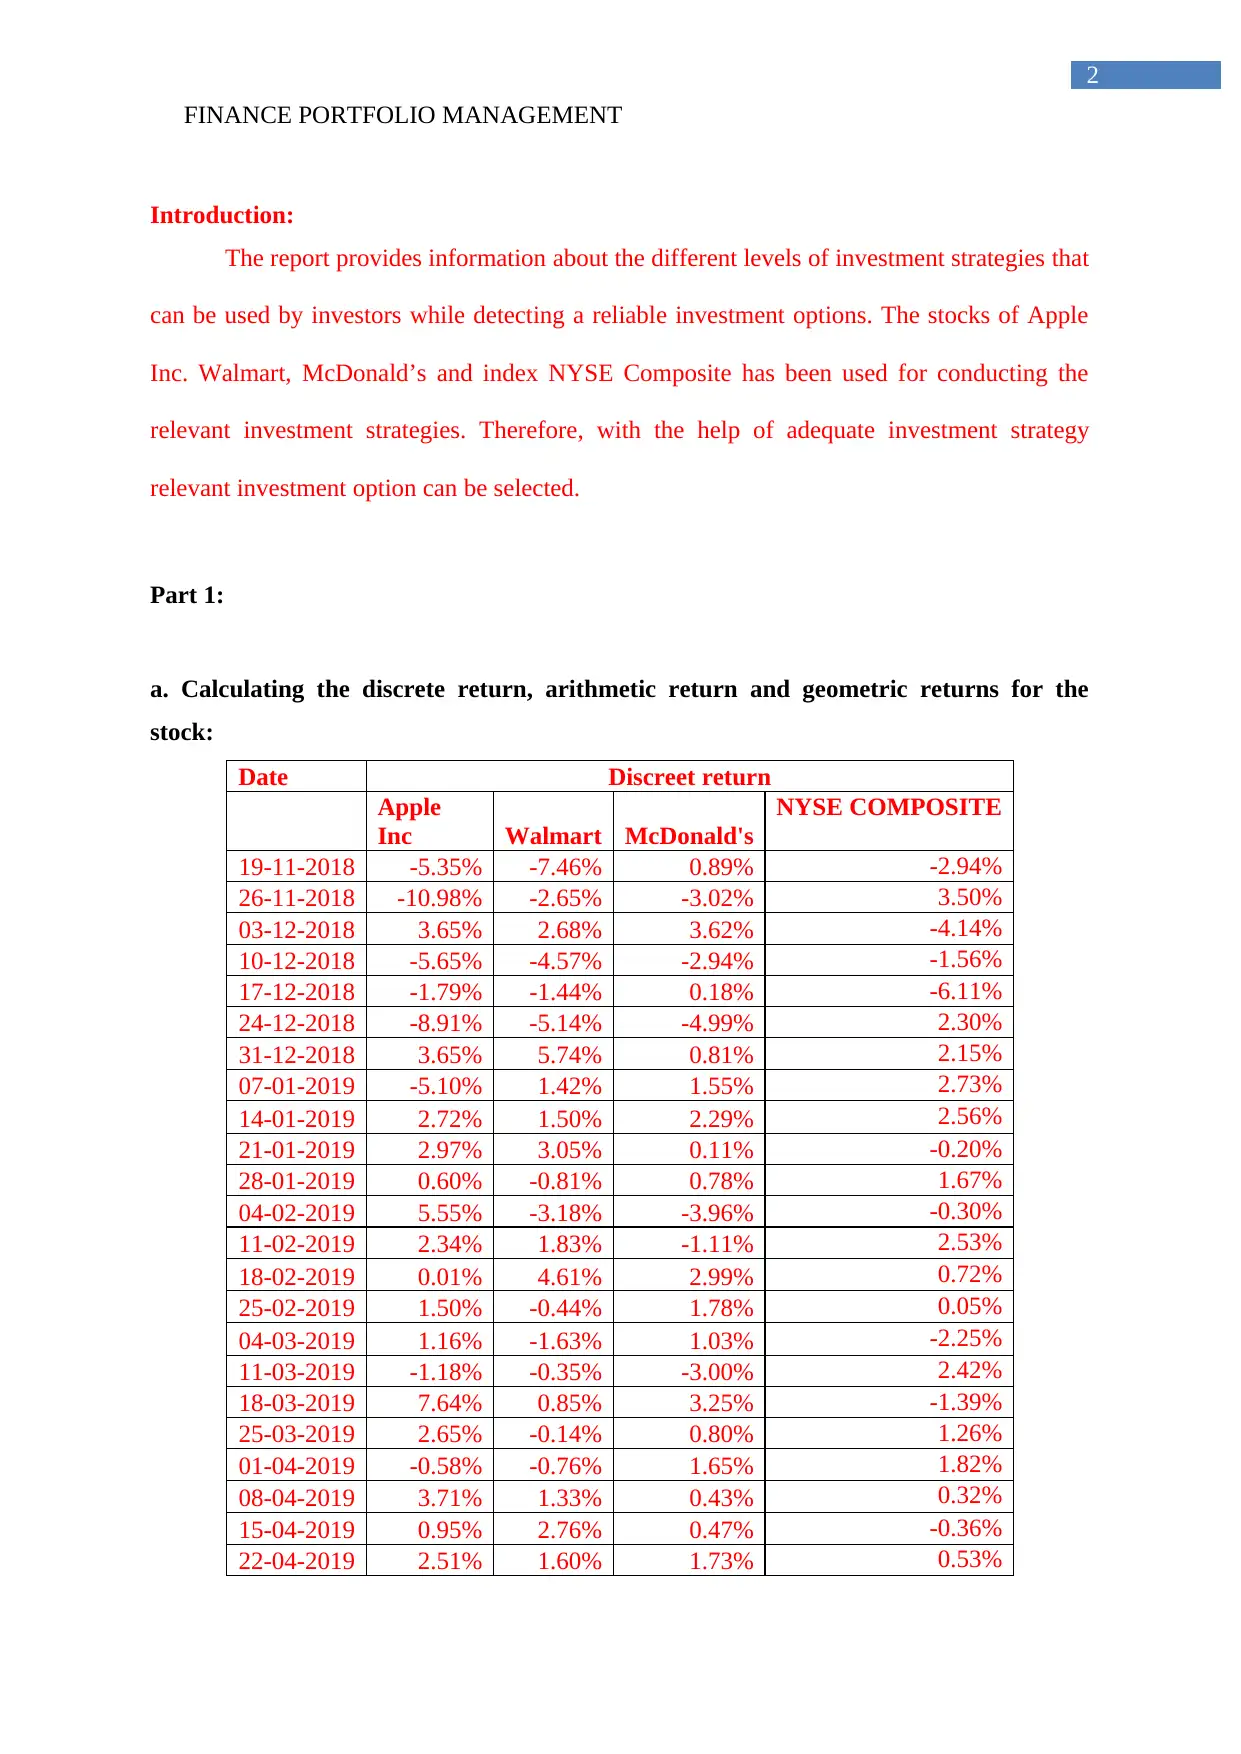
a. Calculating the discrete return, arithmetic return and geometric returns for the
stock:
Date Discreet return
Apple
Inc Walmart McDonald's
NYSE COMPOSITE
19-11-2018 -5.35% -7.46% 0.89% -2.94%
26-11-2018 -10.98% -2.65% -3.02% 3.50%
03-12-2018 3.65% 2.68% 3.62% -4.14%
10-12-2018 -5.65% -4.57% -2.94% -1.56%
17-12-2018 -1.79% -1.44% 0.18% -6.11%
24-12-2018 -8.91% -5.14% -4.99% 2.30%
31-12-2018 3.65% 5.74% 0.81% 2.15%
07-01-2019 -5.10% 1.42% 1.55% 2.73%
14-01-2019 2.72% 1.50% 2.29% 2.56%
21-01-2019 2.97% 3.05% 0.11% -0.20%
28-01-2019 0.60% -0.81% 0.78% 1.67%
04-02-2019 5.55% -3.18% -3.96% -0.30%
11-02-2019 2.34% 1.83% -1.11% 2.53%
18-02-2019 0.01% 4.61% 2.99% 0.72%
25-02-2019 1.50% -0.44% 1.78% 0.05%
04-03-2019 1.16% -1.63% 1.03% -2.25%
11-03-2019 -1.18% -0.35% -3.00% 2.42%
18-03-2019 7.64% 0.85% 3.25% -1.39%
25-03-2019 2.65% -0.14% 0.80% 1.26%
01-04-2019 -0.58% -0.76% 1.65% 1.82%
08-04-2019 3.71% 1.33% 0.43% 0.32%
15-04-2019 0.95% 2.76% 0.47% -0.36%
22-04-2019 2.51% 1.60% 1.73% 0.53%
2
Introduction:
The report provides information about the different levels of investment strategies that
can be used by investors while detecting a reliable investment options. The stocks of Apple
Inc. Walmart, McDonald’s and index NYSE Composite has been used for conducting the
relevant investment strategies. Therefore, with the help of adequate investment strategy
relevant investment option can be selected.
Part 1:
a. Calculating the discrete return, arithmetic return and geometric returns for the
stock:
Date Discreet return
Apple
Inc Walmart McDonald's
NYSE COMPOSITE
19-11-2018 -5.35% -7.46% 0.89% -2.94%
26-11-2018 -10.98% -2.65% -3.02% 3.50%
03-12-2018 3.65% 2.68% 3.62% -4.14%
10-12-2018 -5.65% -4.57% -2.94% -1.56%
17-12-2018 -1.79% -1.44% 0.18% -6.11%
24-12-2018 -8.91% -5.14% -4.99% 2.30%
31-12-2018 3.65% 5.74% 0.81% 2.15%
07-01-2019 -5.10% 1.42% 1.55% 2.73%
14-01-2019 2.72% 1.50% 2.29% 2.56%
21-01-2019 2.97% 3.05% 0.11% -0.20%
28-01-2019 0.60% -0.81% 0.78% 1.67%
04-02-2019 5.55% -3.18% -3.96% -0.30%
11-02-2019 2.34% 1.83% -1.11% 2.53%
18-02-2019 0.01% 4.61% 2.99% 0.72%
25-02-2019 1.50% -0.44% 1.78% 0.05%
04-03-2019 1.16% -1.63% 1.03% -2.25%
11-03-2019 -1.18% -0.35% -3.00% 2.42%
18-03-2019 7.64% 0.85% 3.25% -1.39%
25-03-2019 2.65% -0.14% 0.80% 1.26%
01-04-2019 -0.58% -0.76% 1.65% 1.82%
08-04-2019 3.71% 1.33% 0.43% 0.32%
15-04-2019 0.95% 2.76% 0.47% -0.36%
22-04-2019 2.51% 1.60% 1.73% 0.53%
FINANCE PORTFOLIO MANAGEMENT
3
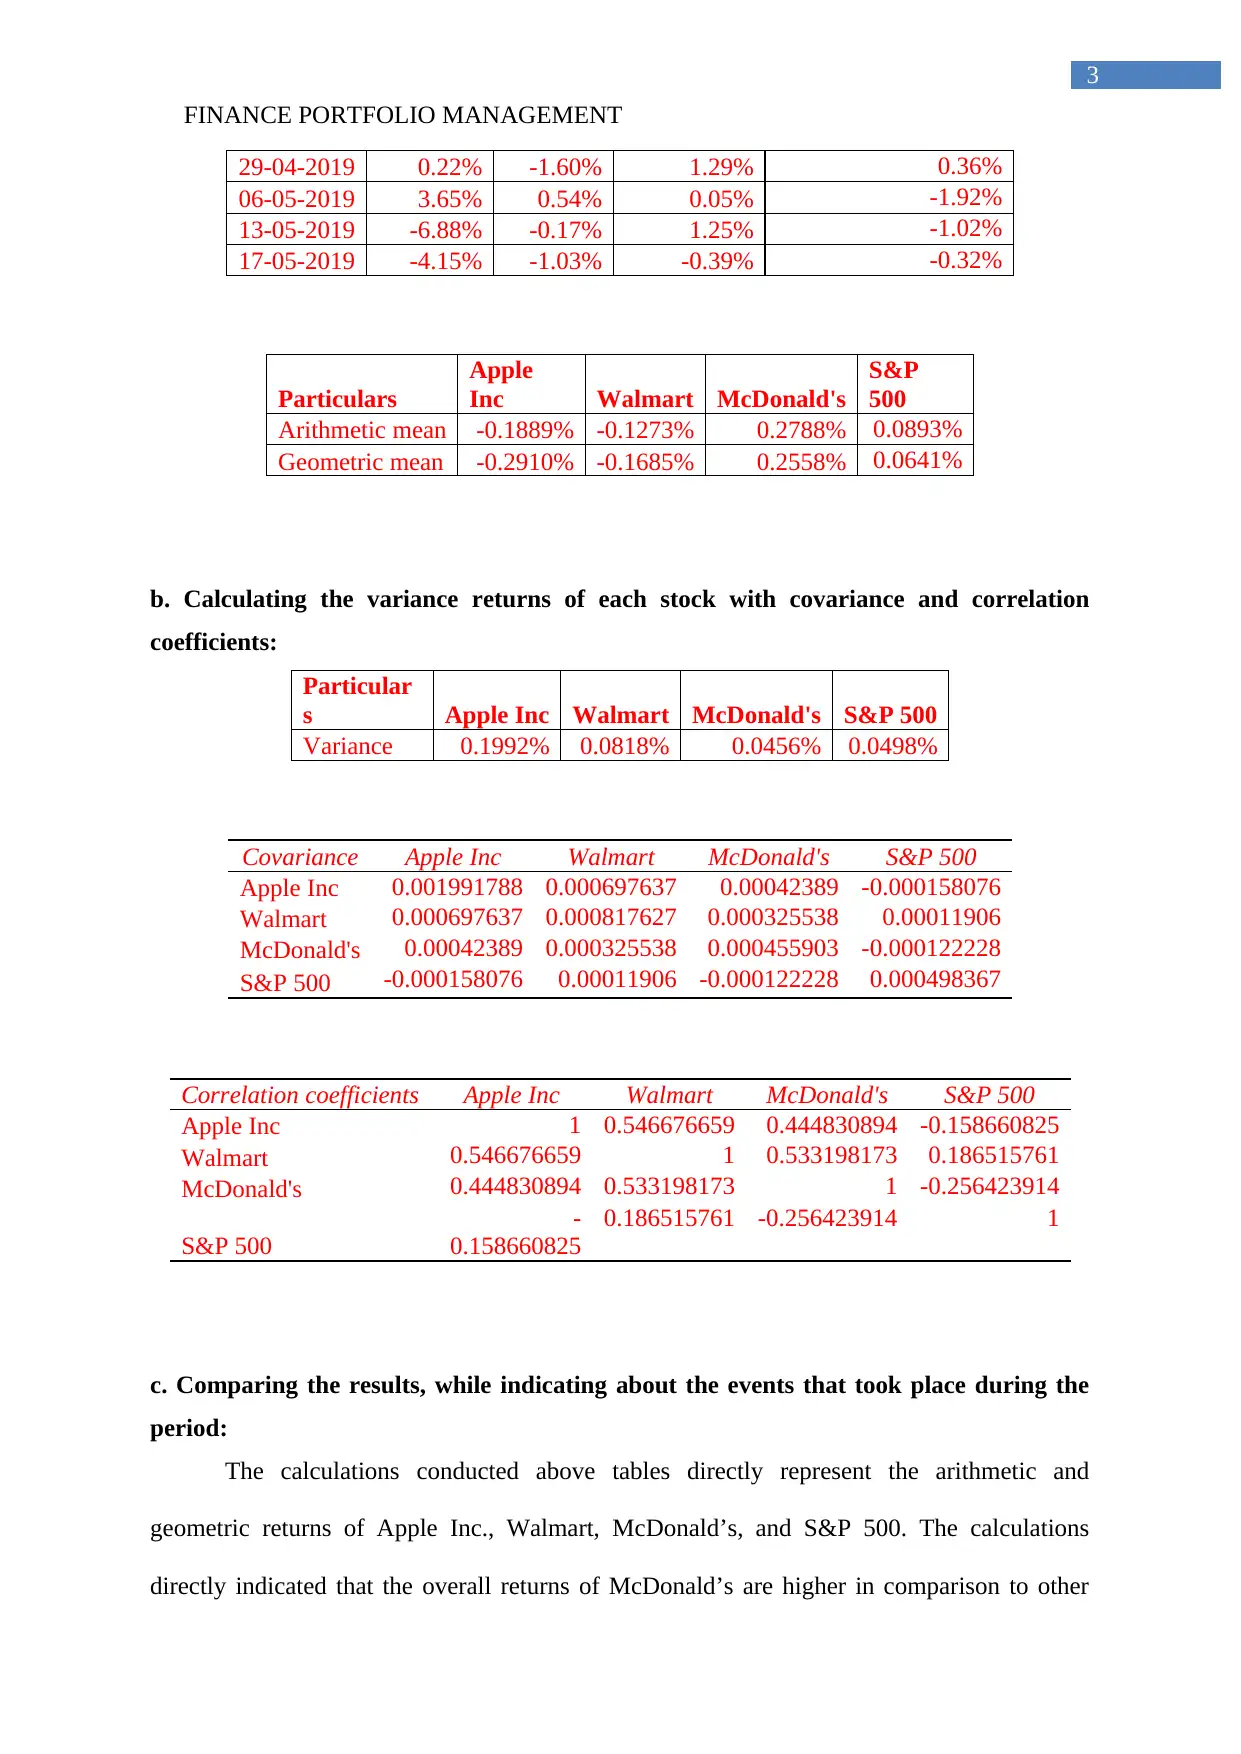
29-04-2019 0.22% -1.60% 1.29% 0.36%
06-05-2019 3.65% 0.54% 0.05% -1.92%
13-05-2019 -6.88% -0.17% 1.25% -1.02%
17-05-2019 -4.15% -1.03% -0.39% -0.32%
Particulars
Apple
Inc Walmart McDonald's
S&P
500
Arithmetic mean -0.1889% -0.1273% 0.2788% 0.0893%
Geometric mean -0.2910% -0.1685% 0.2558% 0.0641%
b. Calculating the variance returns of each stock with covariance and correlation
coefficients:
Particular
s Apple Inc Walmart McDonald's S&P 500
Variance 0.1992% 0.0818% 0.0456% 0.0498%
Covariance Apple Inc Walmart McDonald's S&P 500
Apple Inc 0.001991788 0.000697637 0.00042389 -0.000158076
Walmart 0.000697637 0.000817627 0.000325538 0.00011906
McDonald's 0.00042389 0.000325538 0.000455903 -0.000122228
S&P 500 -0.000158076 0.00011906 -0.000122228 0.000498367
Correlation coefficients Apple Inc Walmart McDonald's S&P 500
Apple Inc 1 0.546676659 0.444830894 -0.158660825
Walmart 0.546676659 1 0.533198173 0.186515761
McDonald's 0.444830894 0.533198173 1 -0.256423914
S&P 500
-
0.158660825
0.186515761 -0.256423914 1
c. Comparing the results, while indicating about the events that took place during the
period:
The calculations conducted above tables directly represent the arithmetic and
geometric returns of Apple Inc., Walmart, McDonald’s, and S&P 500. The calculations
directly indicated that the overall returns of McDonald’s are higher in comparison to other
3
29-04-2019 0.22% -1.60% 1.29% 0.36%
06-05-2019 3.65% 0.54% 0.05% -1.92%
13-05-2019 -6.88% -0.17% 1.25% -1.02%
17-05-2019 -4.15% -1.03% -0.39% -0.32%
Particulars
Apple
Inc Walmart McDonald's
S&P
500
Arithmetic mean -0.1889% -0.1273% 0.2788% 0.0893%
Geometric mean -0.2910% -0.1685% 0.2558% 0.0641%
b. Calculating the variance returns of each stock with covariance and correlation
coefficients:
Particular
s Apple Inc Walmart McDonald's S&P 500
Variance 0.1992% 0.0818% 0.0456% 0.0498%
Covariance Apple Inc Walmart McDonald's S&P 500
Apple Inc 0.001991788 0.000697637 0.00042389 -0.000158076
Walmart 0.000697637 0.000817627 0.000325538 0.00011906
McDonald's 0.00042389 0.000325538 0.000455903 -0.000122228
S&P 500 -0.000158076 0.00011906 -0.000122228 0.000498367
Correlation coefficients Apple Inc Walmart McDonald's S&P 500
Apple Inc 1 0.546676659 0.444830894 -0.158660825
Walmart 0.546676659 1 0.533198173 0.186515761
McDonald's 0.444830894 0.533198173 1 -0.256423914
S&P 500
-
0.158660825
0.186515761 -0.256423914 1
c. Comparing the results, while indicating about the events that took place during the
period:
The calculations conducted above tables directly represent the arithmetic and
geometric returns of Apple Inc., Walmart, McDonald’s, and S&P 500. The calculations
directly indicated that the overall returns of McDonald’s are higher in comparison to other
Secure Best Marks with AI Grader
Need help grading? Try our AI Grader for instant feedback on your assignments.
FINANCE PORTFOLIO MANAGEMENT
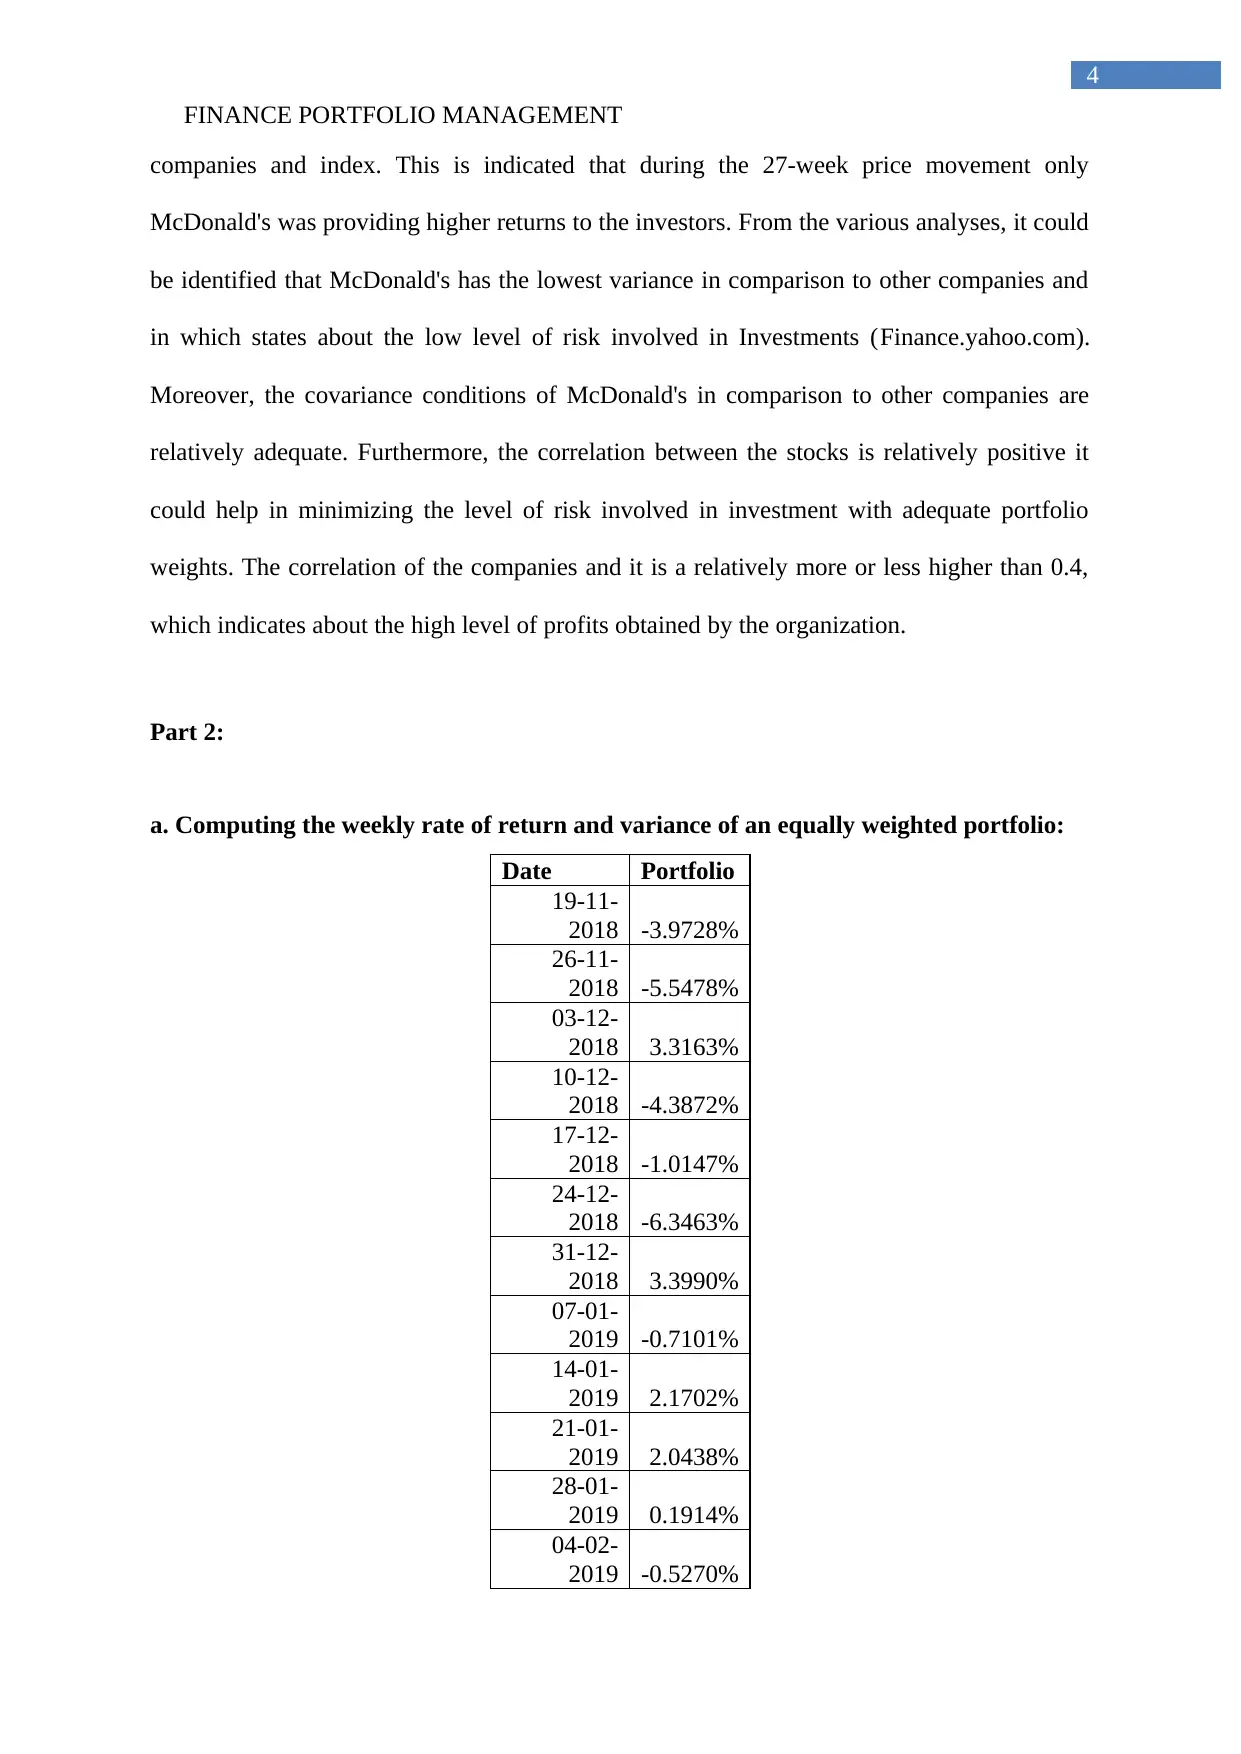
4
companies and index. This is indicated that during the 27-week price movement only
McDonald's was providing higher returns to the investors. From the various analyses, it could
be identified that McDonald's has the lowest variance in comparison to other companies and
in which states about the low level of risk involved in Investments (Finance.yahoo.com).
Moreover, the covariance conditions of McDonald's in comparison to other companies are
relatively adequate. Furthermore, the correlation between the stocks is relatively positive it
could help in minimizing the level of risk involved in investment with adequate portfolio
weights. The correlation of the companies and it is a relatively more or less higher than 0.4,
which indicates about the high level of profits obtained by the organization.
Part 2:
a. Computing the weekly rate of return and variance of an equally weighted portfolio:
Date Portfolio
19-11-
2018 -3.9728%
26-11-
2018 -5.5478%
03-12-
2018 3.3163%
10-12-
2018 -4.3872%
17-12-
2018 -1.0147%
24-12-
2018 -6.3463%
31-12-
2018 3.3990%
07-01-
2019 -0.7101%
14-01-
2019 2.1702%
21-01-
2019 2.0438%
28-01-
2019 0.1914%
04-02-
2019 -0.5270%
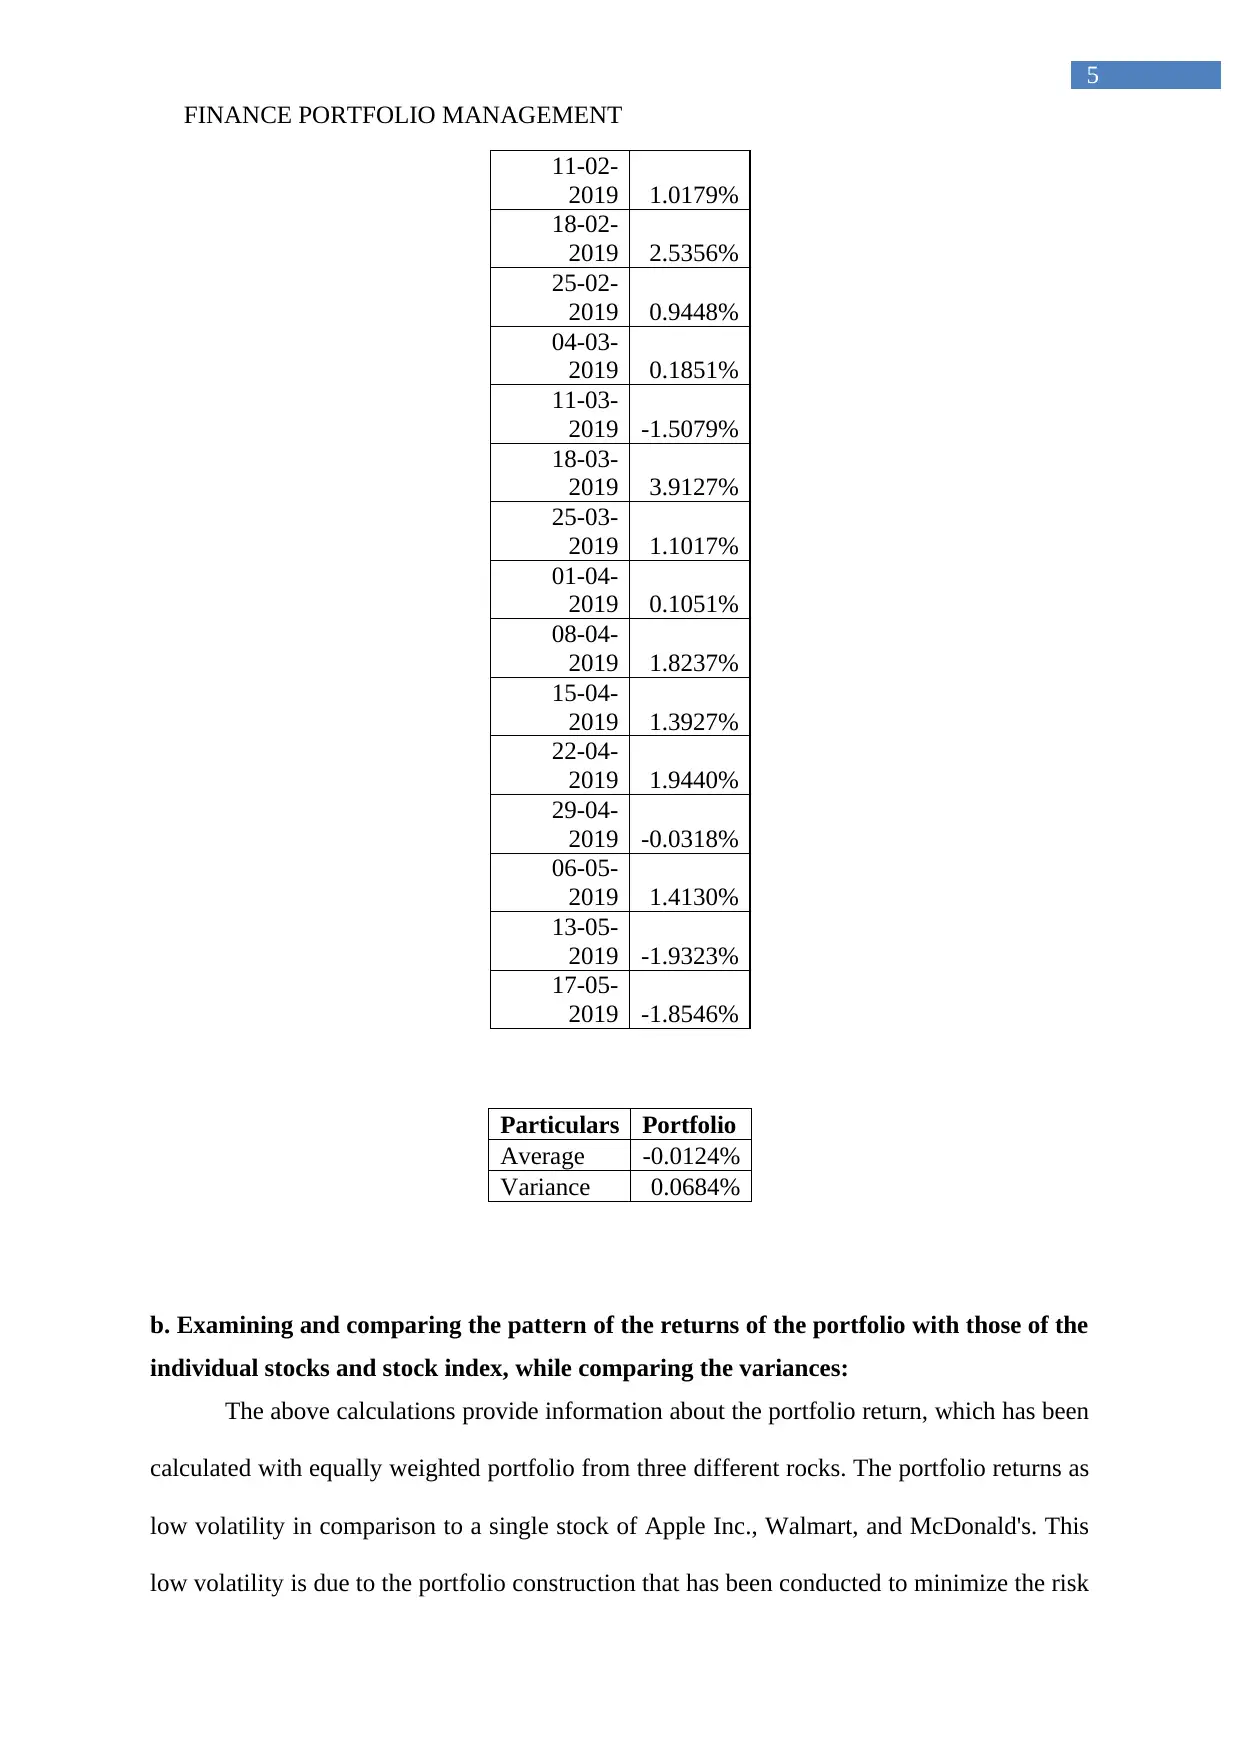
FINANCE PORTFOLIO MANAGEMENT
5
11-02-
2019 1.0179%
18-02-
2019 2.5356%
25-02-
2019 0.9448%
04-03-
2019 0.1851%
11-03-
2019 -1.5079%
18-03-
2019 3.9127%
25-03-
2019 1.1017%
01-04-
2019 0.1051%
08-04-
2019 1.8237%
15-04-
2019 1.3927%
22-04-
2019 1.9440%
29-04-
2019 -0.0318%
06-05-
2019 1.4130%
13-05-
2019 -1.9323%
17-05-
2019 -1.8546%
Particulars Portfolio
Average -0.0124%
Variance 0.0684%
b. Examining and comparing the pattern of the returns of the portfolio with those of the
individual stocks and stock index, while comparing the variances:
The above calculations provide information about the portfolio return, which has been
calculated with equally weighted portfolio from three different rocks. The portfolio returns as
low volatility in comparison to a single stock of Apple Inc., Walmart, and McDonald's. This
low volatility is due to the portfolio construction that has been conducted to minimize the risk
FINANCE PORTFOLIO MANAGEMENT
6
and improve returns from the investment. For single stock, it could be identified that the
overall variance is a relatively high which indicates about the risk involved in investment.
However, the portfolio variance is relatively low in comparison to other stocks listed in the
above table, which is due to the adequate diversification that has been conducted to nullify
the relevant impact from capital market. Hence, with diversify portfolio investors can reduce
the risk and losses from stock market (Wsj.com).
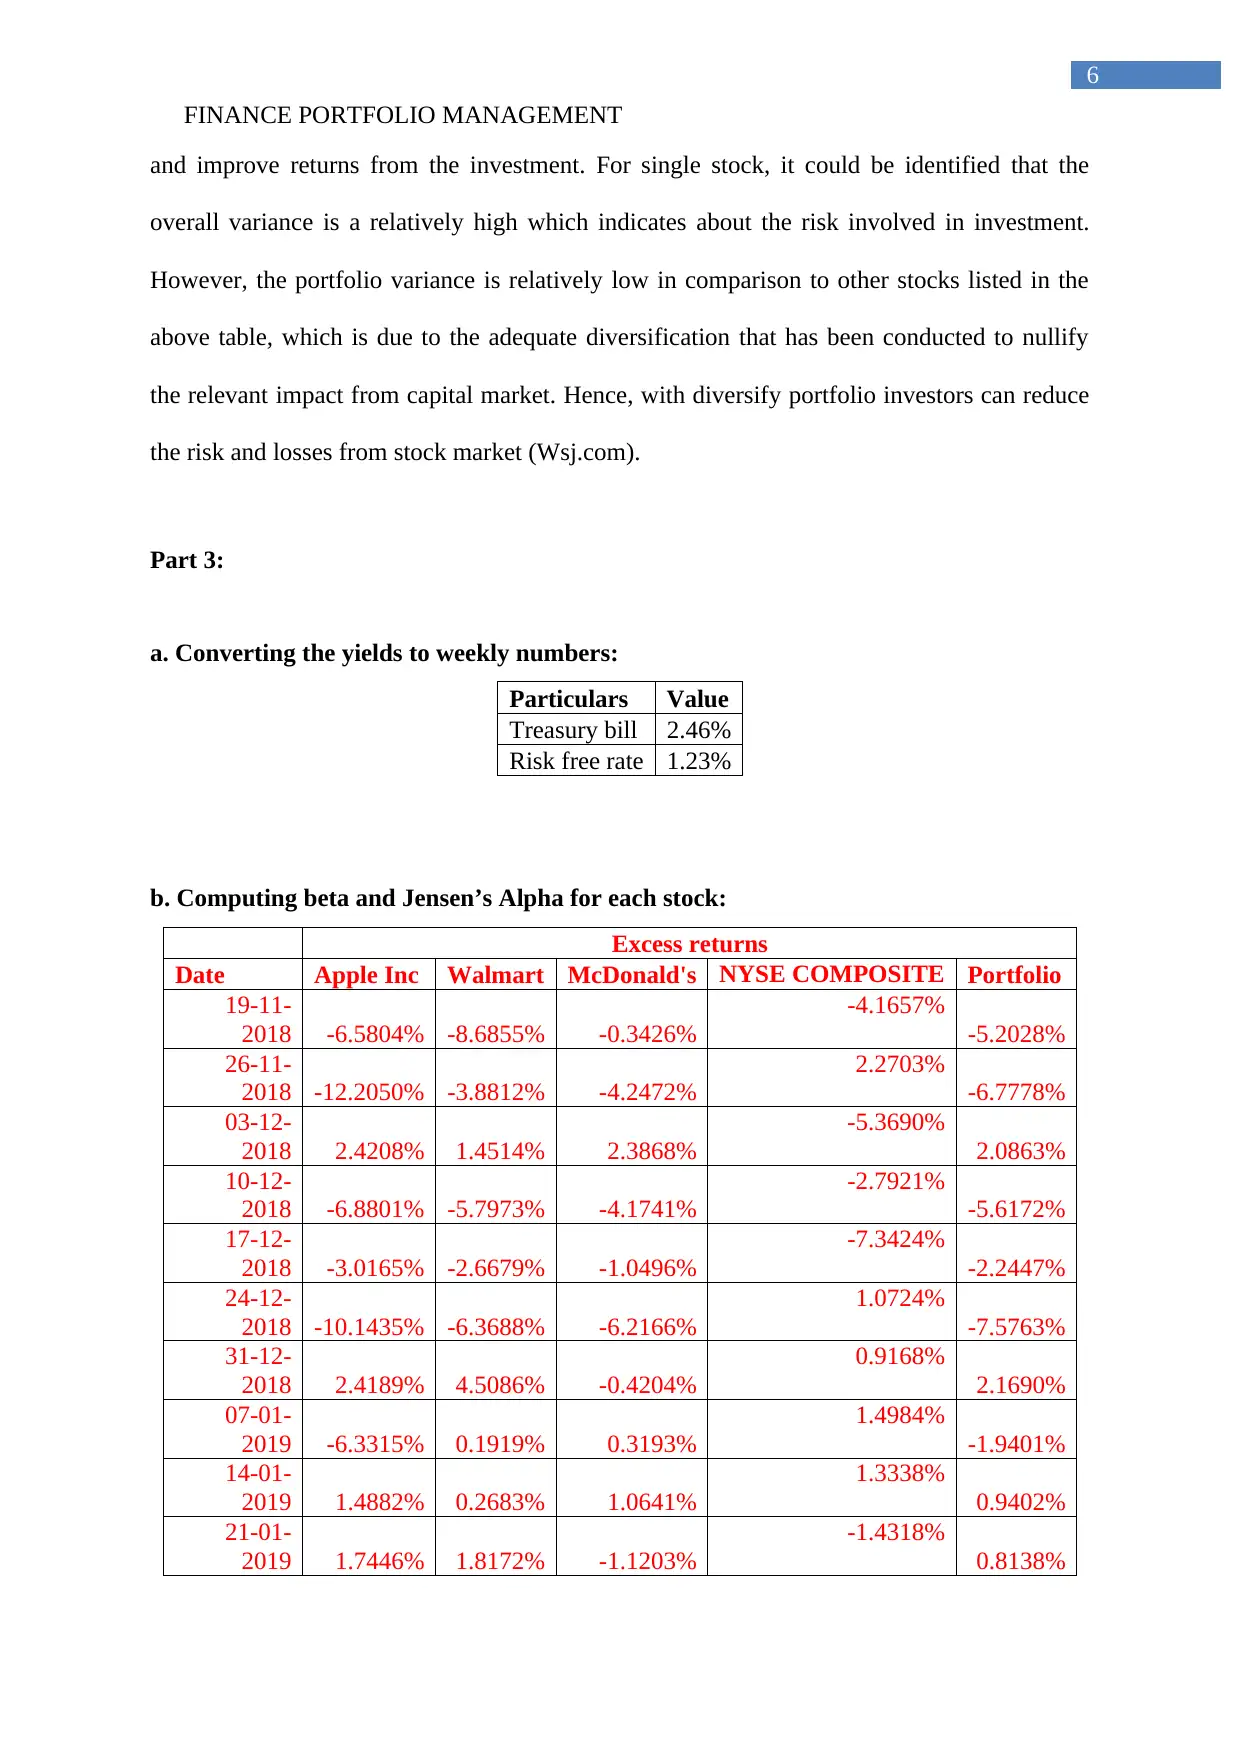
Part 3:
a. Converting the yields to weekly numbers:
Particulars Value
Treasury bill 2.46%
Risk free rate 1.23%
b. Computing beta and Jensen’s Alpha for each stock:
Excess returns
Date Apple Inc Walmart McDonald's NYSE COMPOSITE Portfolio
19-11-
2018 -6.5804% -8.6855% -0.3426%
-4.1657%
-5.2028%
26-11-
2018 -12.2050% -3.8812% -4.2472%
2.2703%
-6.7778%
03-12-
2018 2.4208% 1.4514% 2.3868%
-5.3690%
2.0863%
10-12-
2018 -6.8801% -5.7973% -4.1741%
-2.7921%
-5.6172%
17-12-
2018 -3.0165% -2.6679% -1.0496%
-7.3424%
-2.2447%
24-12-
2018 -10.1435% -6.3688% -6.2166%
1.0724%
-7.5763%
31-12-
2018 2.4189% 4.5086% -0.4204%
0.9168%
2.1690%
07-01-
2019 -6.3315% 0.1919% 0.3193%
1.4984%
-1.9401%
14-01-
2019 1.4882% 0.2683% 1.0641%
1.3338%
0.9402%
21-01-
2019 1.7446% 1.8172% -1.1203%
-1.4318%
0.8138%
6
and improve returns from the investment. For single stock, it could be identified that the
overall variance is a relatively high which indicates about the risk involved in investment.
However, the portfolio variance is relatively low in comparison to other stocks listed in the
above table, which is due to the adequate diversification that has been conducted to nullify
the relevant impact from capital market. Hence, with diversify portfolio investors can reduce
the risk and losses from stock market (Wsj.com).
Part 3:
a. Converting the yields to weekly numbers:
Particulars Value
Treasury bill 2.46%
Risk free rate 1.23%
b. Computing beta and Jensen’s Alpha for each stock:
Excess returns
Date Apple Inc Walmart McDonald's NYSE COMPOSITE Portfolio
19-11-
2018 -6.5804% -8.6855% -0.3426%
-4.1657%
-5.2028%
26-11-
2018 -12.2050% -3.8812% -4.2472%
2.2703%
-6.7778%
03-12-
2018 2.4208% 1.4514% 2.3868%
-5.3690%
2.0863%
10-12-
2018 -6.8801% -5.7973% -4.1741%
-2.7921%
-5.6172%
17-12-
2018 -3.0165% -2.6679% -1.0496%
-7.3424%
-2.2447%
24-12-
2018 -10.1435% -6.3688% -6.2166%
1.0724%
-7.5763%
31-12-
2018 2.4189% 4.5086% -0.4204%
0.9168%
2.1690%
07-01-
2019 -6.3315% 0.1919% 0.3193%
1.4984%
-1.9401%
14-01-
2019 1.4882% 0.2683% 1.0641%
1.3338%
0.9402%
21-01-
2019 1.7446% 1.8172% -1.1203%
-1.4318%
0.8138%
Paraphrase This Document
Need a fresh take? Get an instant paraphrase of this document with our AI Paraphraser
FINANCE PORTFOLIO MANAGEMENT
7
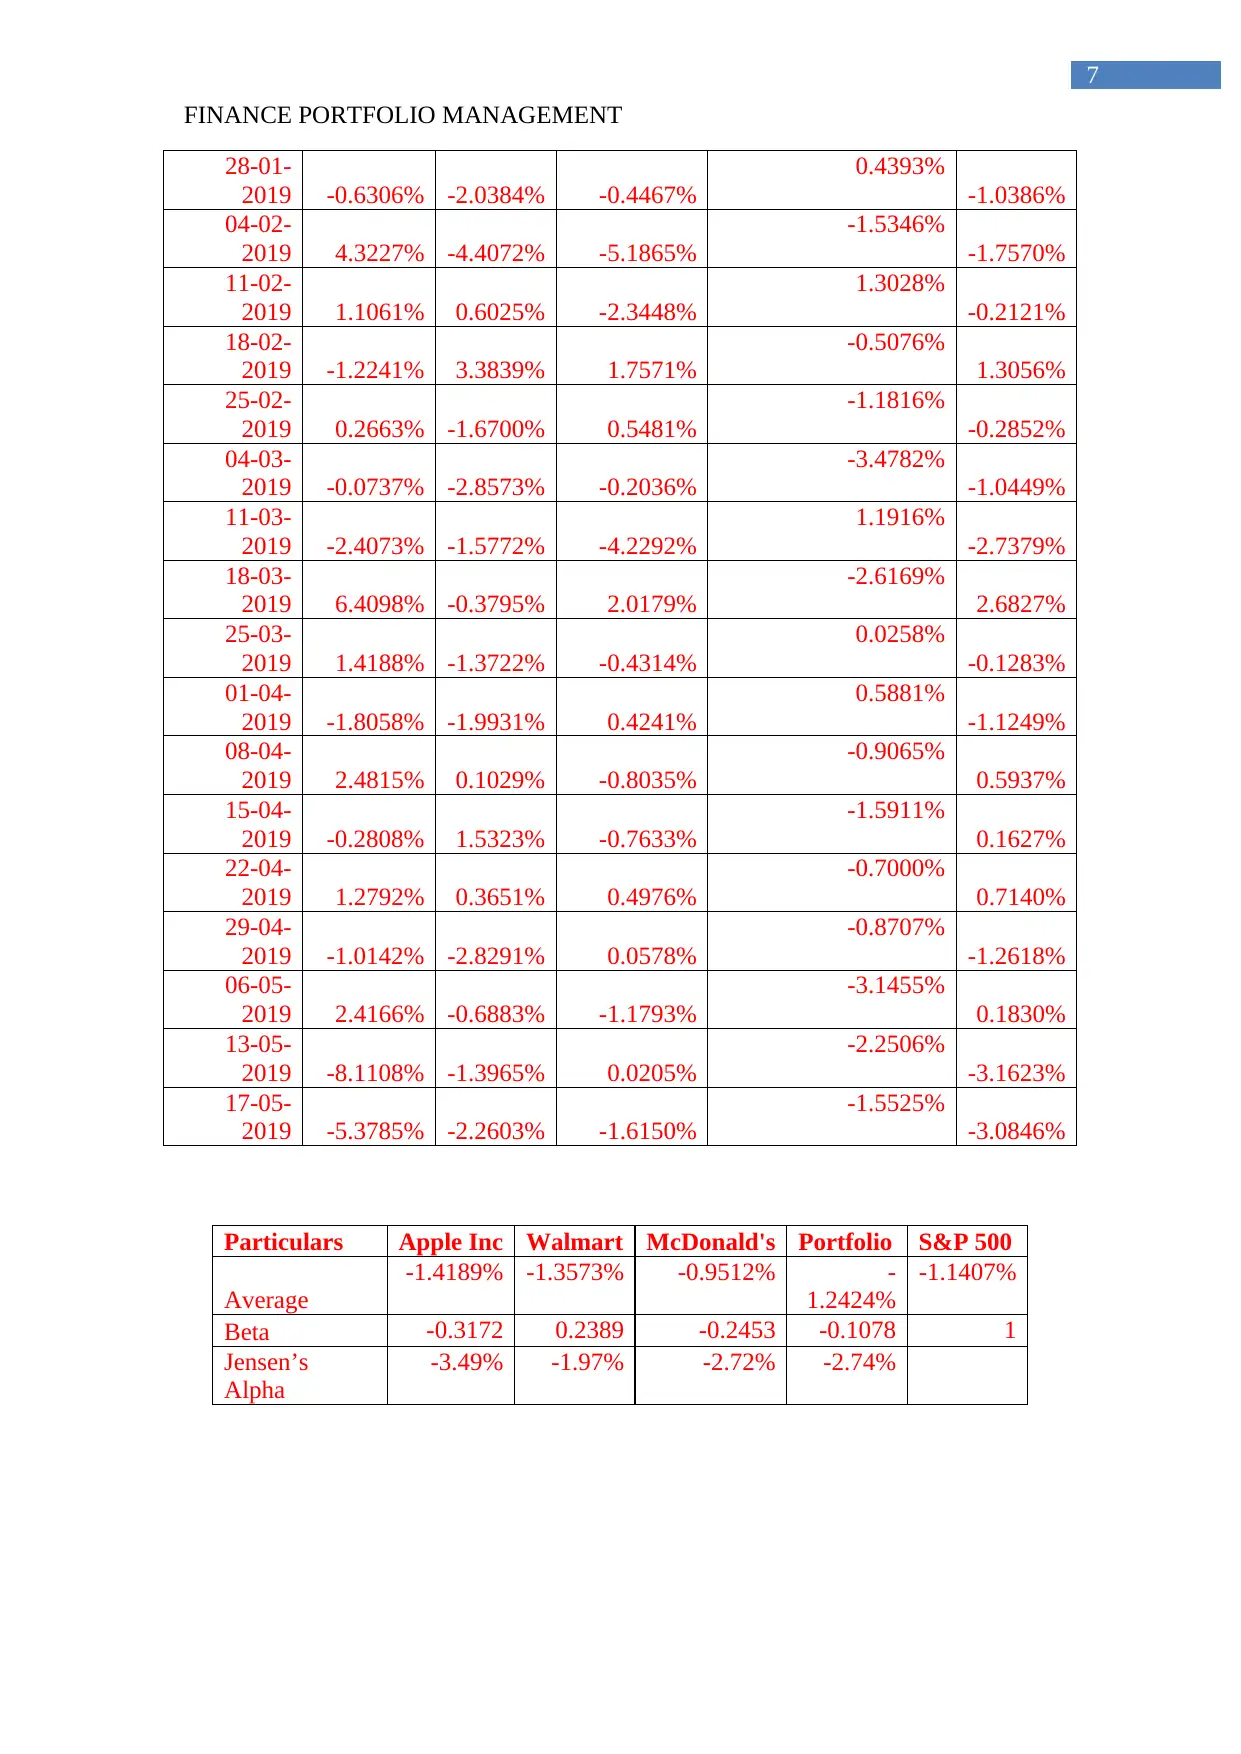
28-01-
2019 -0.6306% -2.0384% -0.4467%
0.4393%
-1.0386%
04-02-
2019 4.3227% -4.4072% -5.1865%
-1.5346%
-1.7570%
11-02-
2019 1.1061% 0.6025% -2.3448%
1.3028%
-0.2121%
18-02-
2019 -1.2241% 3.3839% 1.7571%
-0.5076%
1.3056%
25-02-
2019 0.2663% -1.6700% 0.5481%
-1.1816%
-0.2852%
04-03-
2019 -0.0737% -2.8573% -0.2036%
-3.4782%
-1.0449%
11-03-
2019 -2.4073% -1.5772% -4.2292%
1.1916%
-2.7379%
18-03-
2019 6.4098% -0.3795% 2.0179%
-2.6169%
2.6827%
25-03-
2019 1.4188% -1.3722% -0.4314%
0.0258%
-0.1283%
01-04-
2019 -1.8058% -1.9931% 0.4241%
0.5881%
-1.1249%
08-04-
2019 2.4815% 0.1029% -0.8035%
-0.9065%
0.5937%
15-04-
2019 -0.2808% 1.5323% -0.7633%
-1.5911%
0.1627%
22-04-
2019 1.2792% 0.3651% 0.4976%
-0.7000%
0.7140%
29-04-
2019 -1.0142% -2.8291% 0.0578%
-0.8707%
-1.2618%
06-05-
2019 2.4166% -0.6883% -1.1793%
-3.1455%
0.1830%
13-05-
2019 -8.1108% -1.3965% 0.0205%
-2.2506%
-3.1623%
17-05-
2019 -5.3785% -2.2603% -1.6150%
-1.5525%
-3.0846%
Particulars Apple Inc Walmart McDonald's Portfolio S&P 500
Average
-1.4189% -1.3573% -0.9512% -
1.2424%
-1.1407%
Beta -0.3172 0.2389 -0.2453 -0.1078 1
Jensen’s
Alpha
-3.49% -1.97% -2.72% -2.74%
7
28-01-
2019 -0.6306% -2.0384% -0.4467%
0.4393%
-1.0386%
04-02-
2019 4.3227% -4.4072% -5.1865%
-1.5346%
-1.7570%
11-02-
2019 1.1061% 0.6025% -2.3448%
1.3028%
-0.2121%
18-02-
2019 -1.2241% 3.3839% 1.7571%
-0.5076%
1.3056%
25-02-
2019 0.2663% -1.6700% 0.5481%
-1.1816%
-0.2852%
04-03-
2019 -0.0737% -2.8573% -0.2036%
-3.4782%
-1.0449%
11-03-
2019 -2.4073% -1.5772% -4.2292%
1.1916%
-2.7379%
18-03-
2019 6.4098% -0.3795% 2.0179%
-2.6169%
2.6827%
25-03-
2019 1.4188% -1.3722% -0.4314%
0.0258%
-0.1283%
01-04-
2019 -1.8058% -1.9931% 0.4241%
0.5881%
-1.1249%
08-04-
2019 2.4815% 0.1029% -0.8035%
-0.9065%
0.5937%
15-04-
2019 -0.2808% 1.5323% -0.7633%
-1.5911%
0.1627%
22-04-
2019 1.2792% 0.3651% 0.4976%
-0.7000%
0.7140%
29-04-
2019 -1.0142% -2.8291% 0.0578%
-0.8707%
-1.2618%
06-05-
2019 2.4166% -0.6883% -1.1793%
-3.1455%
0.1830%
13-05-
2019 -8.1108% -1.3965% 0.0205%
-2.2506%
-3.1623%
17-05-
2019 -5.3785% -2.2603% -1.6150%
-1.5525%
-3.0846%
Particulars Apple Inc Walmart McDonald's Portfolio S&P 500
Average
-1.4189% -1.3573% -0.9512% -
1.2424%
-1.1407%
Beta -0.3172 0.2389 -0.2453 -0.1078 1
Jensen’s
Alpha
-3.49% -1.97% -2.72% -2.74%
FINANCE PORTFOLIO MANAGEMENT
8
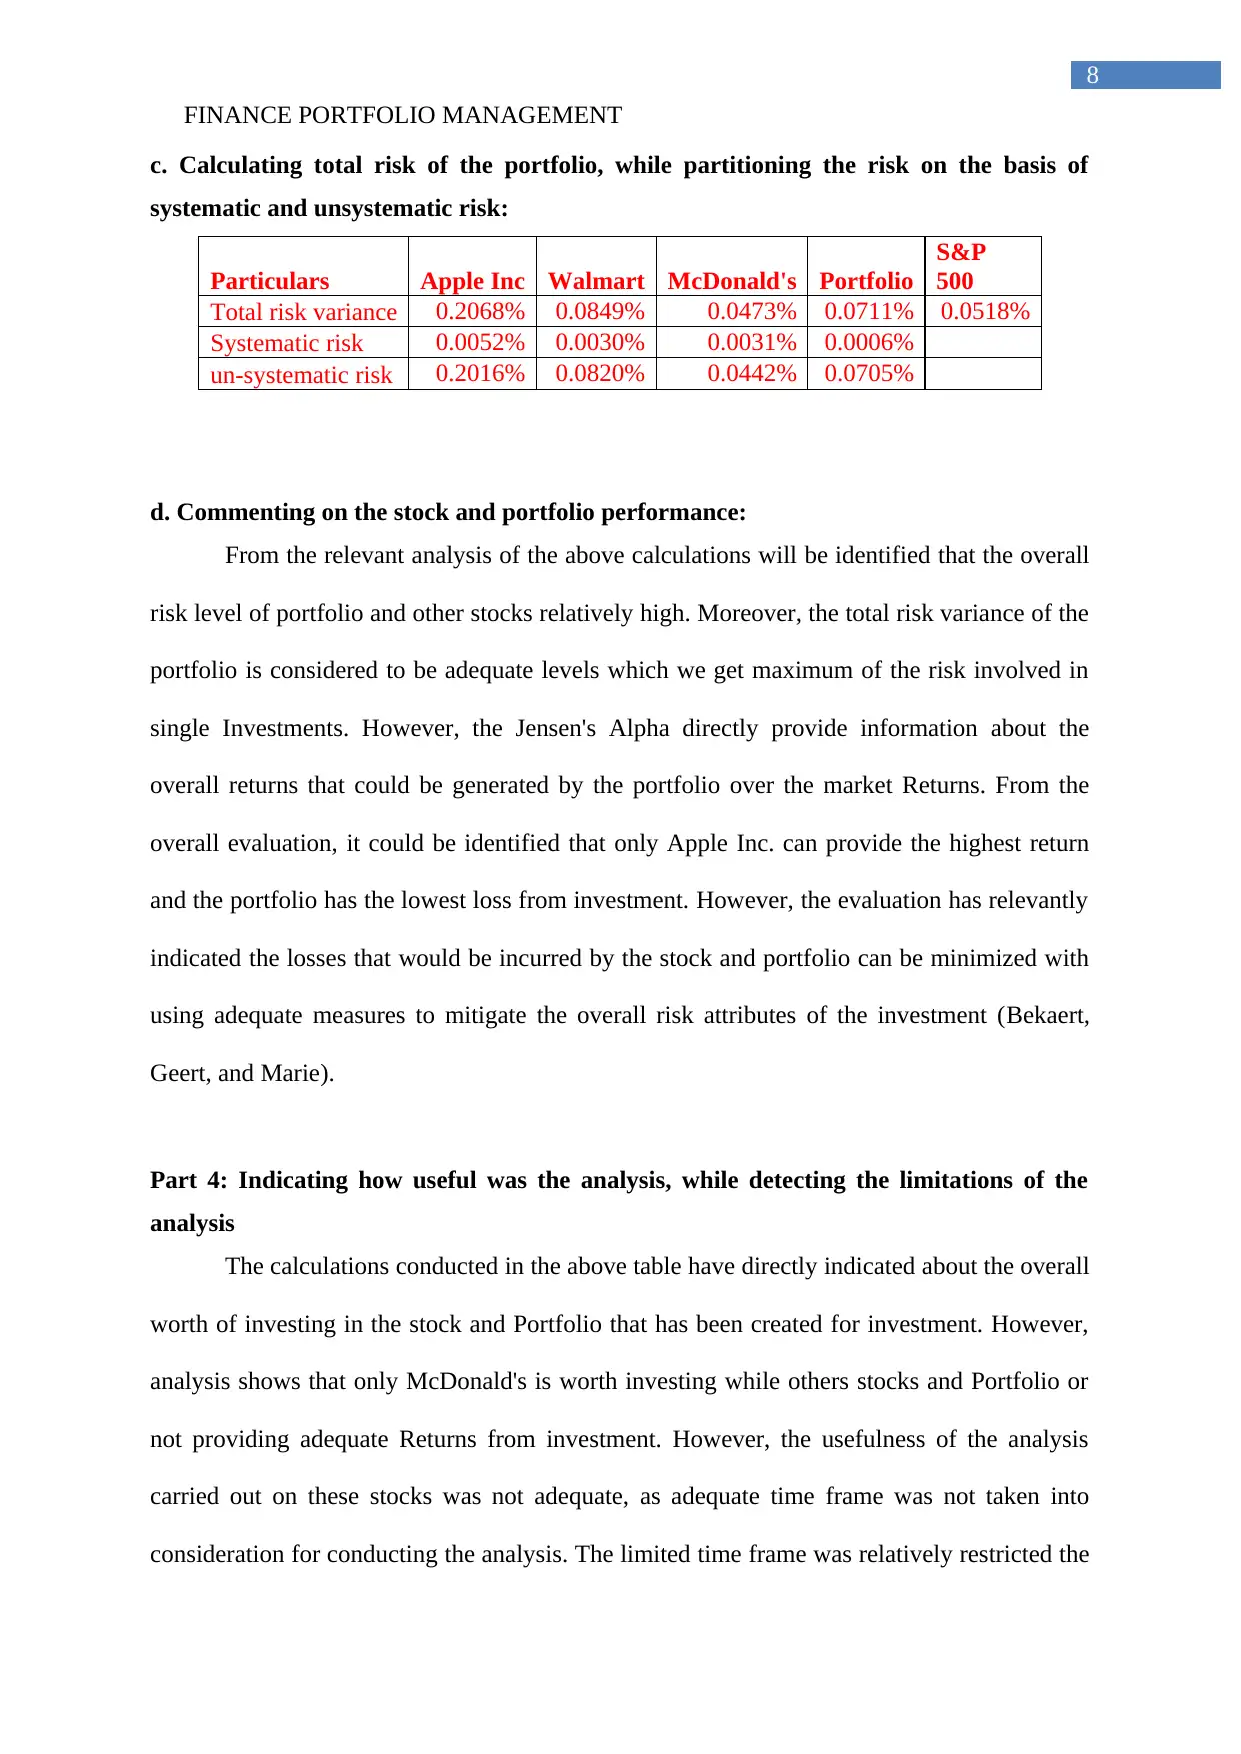
c. Calculating total risk of the portfolio, while partitioning the risk on the basis of
systematic and unsystematic risk:
Particulars Apple Inc Walmart McDonald's Portfolio
S&P
500
Total risk variance 0.2068% 0.0849% 0.0473% 0.0711% 0.0518%
Systematic risk 0.0052% 0.0030% 0.0031% 0.0006%
un-systematic risk 0.2016% 0.0820% 0.0442% 0.0705%
d. Commenting on the stock and portfolio performance:
From the relevant analysis of the above calculations will be identified that the overall
risk level of portfolio and other stocks relatively high. Moreover, the total risk variance of the
portfolio is considered to be adequate levels which we get maximum of the risk involved in
single Investments. However, the Jensen's Alpha directly provide information about the
overall returns that could be generated by the portfolio over the market Returns. From the
overall evaluation, it could be identified that only Apple Inc. can provide the highest return
and the portfolio has the lowest loss from investment. However, the evaluation has relevantly
indicated the losses that would be incurred by the stock and portfolio can be minimized with
using adequate measures to mitigate the overall risk attributes of the investment (Bekaert,
Geert, and Marie).
Part 4: Indicating how useful was the analysis, while detecting the limitations of the
analysis
The calculations conducted in the above table have directly indicated about the overall
worth of investing in the stock and Portfolio that has been created for investment. However,
analysis shows that only McDonald's is worth investing while others stocks and Portfolio or
not providing adequate Returns from investment. However, the usefulness of the analysis
carried out on these stocks was not adequate, as adequate time frame was not taken into
consideration for conducting the analysis. The limited time frame was relatively restricted the
8
c. Calculating total risk of the portfolio, while partitioning the risk on the basis of
systematic and unsystematic risk:
Particulars Apple Inc Walmart McDonald's Portfolio
S&P
500
Total risk variance 0.2068% 0.0849% 0.0473% 0.0711% 0.0518%
Systematic risk 0.0052% 0.0030% 0.0031% 0.0006%
un-systematic risk 0.2016% 0.0820% 0.0442% 0.0705%
d. Commenting on the stock and portfolio performance:
From the relevant analysis of the above calculations will be identified that the overall
risk level of portfolio and other stocks relatively high. Moreover, the total risk variance of the
portfolio is considered to be adequate levels which we get maximum of the risk involved in
single Investments. However, the Jensen's Alpha directly provide information about the
overall returns that could be generated by the portfolio over the market Returns. From the
overall evaluation, it could be identified that only Apple Inc. can provide the highest return
and the portfolio has the lowest loss from investment. However, the evaluation has relevantly
indicated the losses that would be incurred by the stock and portfolio can be minimized with
using adequate measures to mitigate the overall risk attributes of the investment (Bekaert,
Geert, and Marie).
Part 4: Indicating how useful was the analysis, while detecting the limitations of the
analysis
The calculations conducted in the above table have directly indicated about the overall
worth of investing in the stock and Portfolio that has been created for investment. However,
analysis shows that only McDonald's is worth investing while others stocks and Portfolio or
not providing adequate Returns from investment. However, the usefulness of the analysis
carried out on these stocks was not adequate, as adequate time frame was not taken into
consideration for conducting the analysis. The limited time frame was relatively restricted the
FINANCE PORTFOLIO MANAGEMENT
9
overall analysis of the stocks and detection of the risk and return involved in investments.
The major limitations were the time restrictions and the overall use of weekly returns for
analyzing the stocks risk and return attributes. Therefore, on the basis of the limitations no
investment should be conducted by investors, as the analysis failed to operate and capture the
risk and return attributes of a stock and portfolio (Fedsearch.org). Moreover, relevant changes
in the analysis could have been made, where the time frame of the analysis could increase to
more than two to three years, as it might help in protecting the actual risk and return
conditions of stock.
Conclusion:
The overall assessment directly evaluates different level of strategies such as Total
risk and Jensen Alpha to derive the adequate investment options. From the overall
calculation, it can be detected that only McDonald is a viable investment options in
comparison to other stock and portfolio. However, the limitations of the study have relevantly
restricted the viability of the analysis, which can be conducted for detecting the investment
option.
Secure Best Marks with AI Grader
Need help grading? Try our AI Grader for instant feedback on your assignments.
FINANCE PORTFOLIO MANAGEMENT
10
References and Bibliography:
Bekaert, Geert, and Marie Hoerova. "The VIX, the variance premium and stock market
volatility." Journal of Econometrics183, no. 2 (2014): 181-192.
Cremers, Martijn, Michael Halling, and David Weinbaum. "Aggregate jump and volatility
risk in the cross‐section of stock returns." The Journal of Finance 70, no. 2 (2015): 577-614.
Diaz, Elena Maria, Juan Carlos Molero, and Fernando Perez de Gracia. "Oil price volatility
and stock returns in the G7 economies." Energy Economics 54 (2016): 417-430.
Economy.com Analytics, Moody's. 2019. "United States Treasury Bills: 26-Week - High
Rate | Moody's Analytics". Economy.Com. Accessed May 20 2019.
https://www.economy.com/united-states/treasury-bills-26-week-high-rate.
Fedsearch.org. 2019. Fedsearch.Org. Accessed May 20 2019.
https://www.fedsearch.org/board_public/search?text=treasury+bill&Search=.
Finance.yahoo.com. 2019. Finance.Yahoo.Com. Accessed May 20 2019.
https://finance.yahoo.com/quote/WMT/history?
period1=1541010600&period2=1558290600&interval=1wk&filter=history&frequency=1wk.
Finance.yahoo.com. 2019. Finance.Yahoo.Com. Accessed May 20 2019.
https://finance.yahoo.com/quote/AAPL/history?
period1=1541010600&period2=1558290600&interval=1wk&filter=history&frequency=1wk.
Finance.yahoo.com. 2019. Finance.Yahoo.Com. Accessed May 20 2019.
https://finance.yahoo.com/quote/MCD/history?
period1=1541010600&period2=1558290600&interval=1wk&filter=history&frequency=1wk.

FINANCE PORTFOLIO MANAGEMENT
11
Finance.yahoo.com. 2019. Yahoo is now part of Oath. [online] Available at:
https://finance.yahoo.com/quote/%5ENYA/history?
period1=1541961000&period2=1558377000&interval=1wk&filter=history&frequency=1wk
[Accessed 20 May 2019].
Wsj.com. 2019. Wsj.Com. Accessed May 20 2019.
http://www.wsj.com/mdc/public/page/2_3020-moneyrate.html.
1 out of 12


Your All-in-One AI-Powered Toolkit for Academic Success.
+13062052269
info@desklib.com
Available 24*7 on WhatsApp / Email
![[object Object]](/_next/static/media/star-bottom.7253800d.svg)
Unlock your academic potential
© 2024 | Zucol Services PVT LTD | All rights reserved.