Comprehensive Project Report: Financial Analysis and Funds Planning
VerifiedAdded on 2023/06/15
|9
|1361
|440
Report
AI Summary
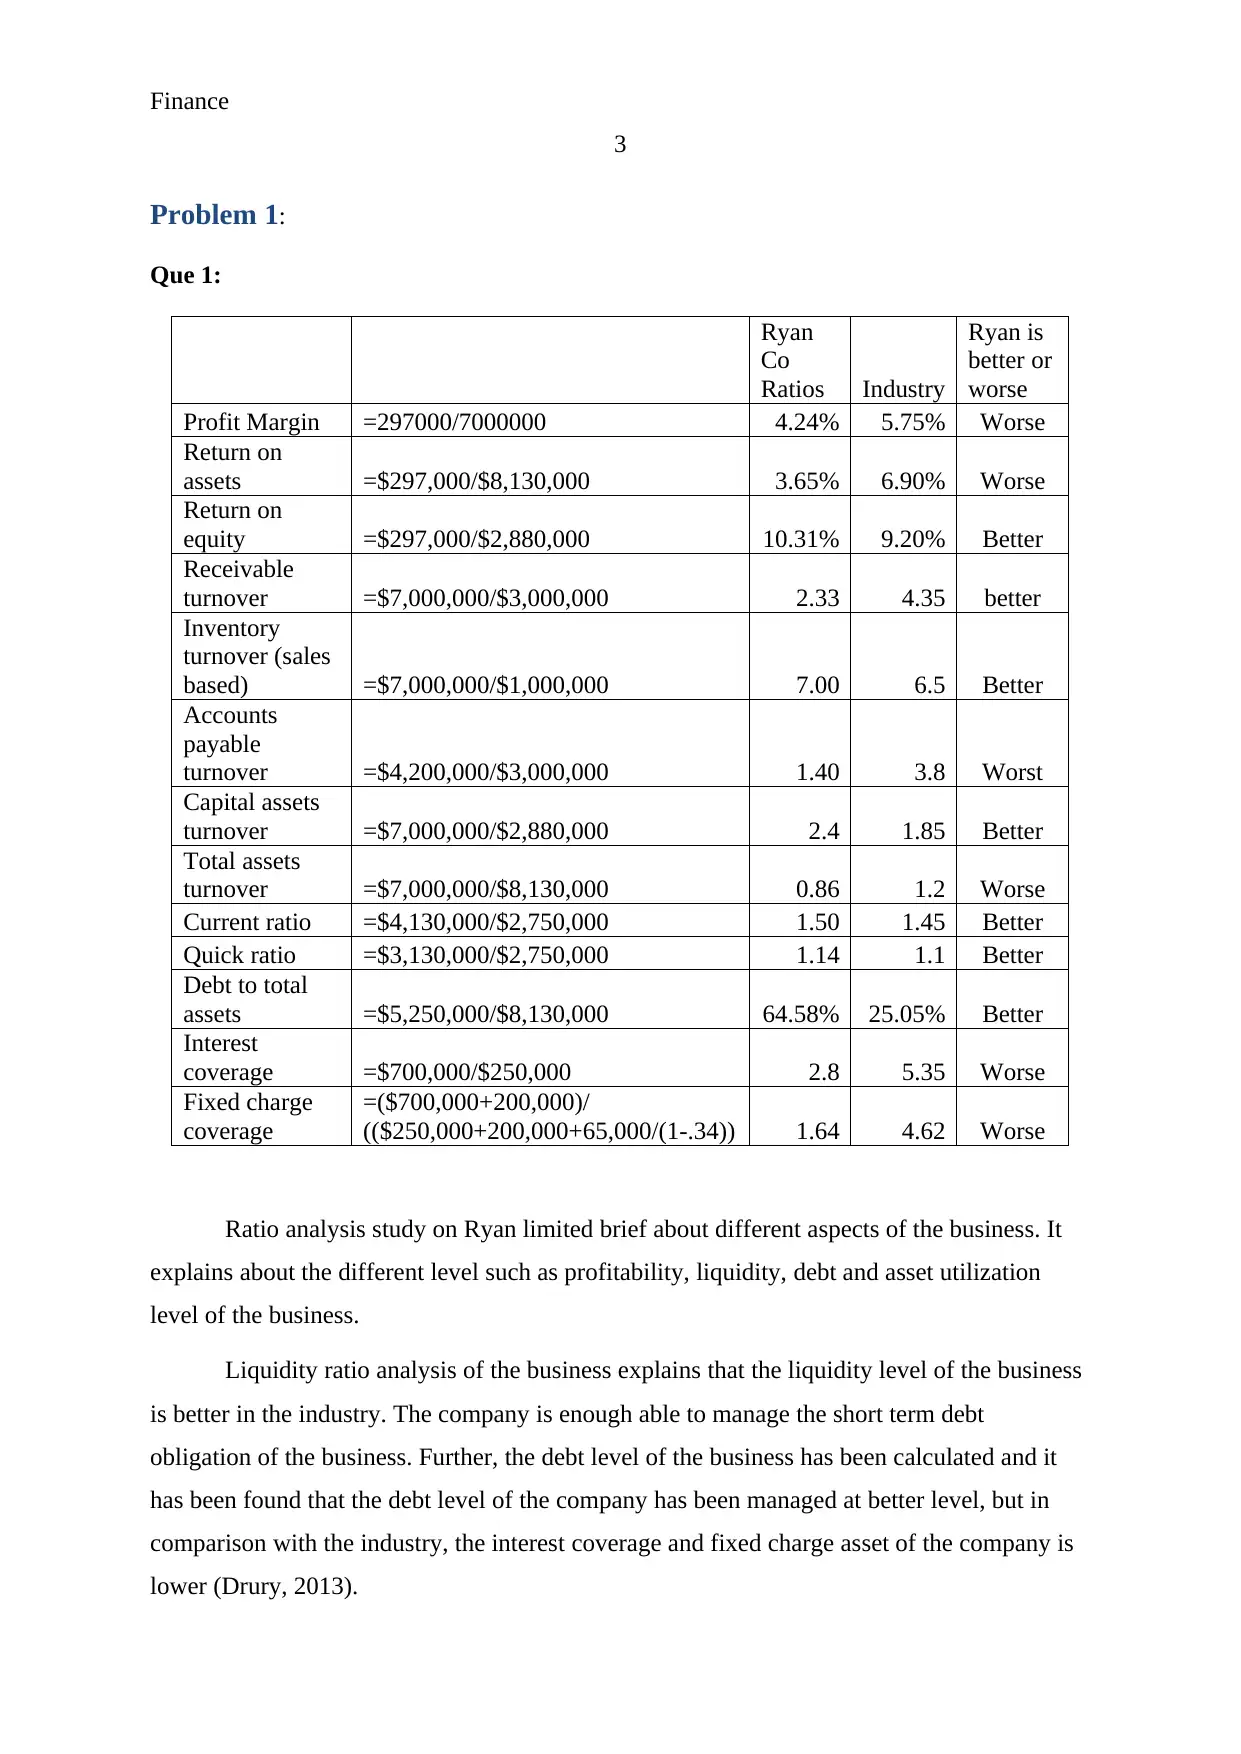
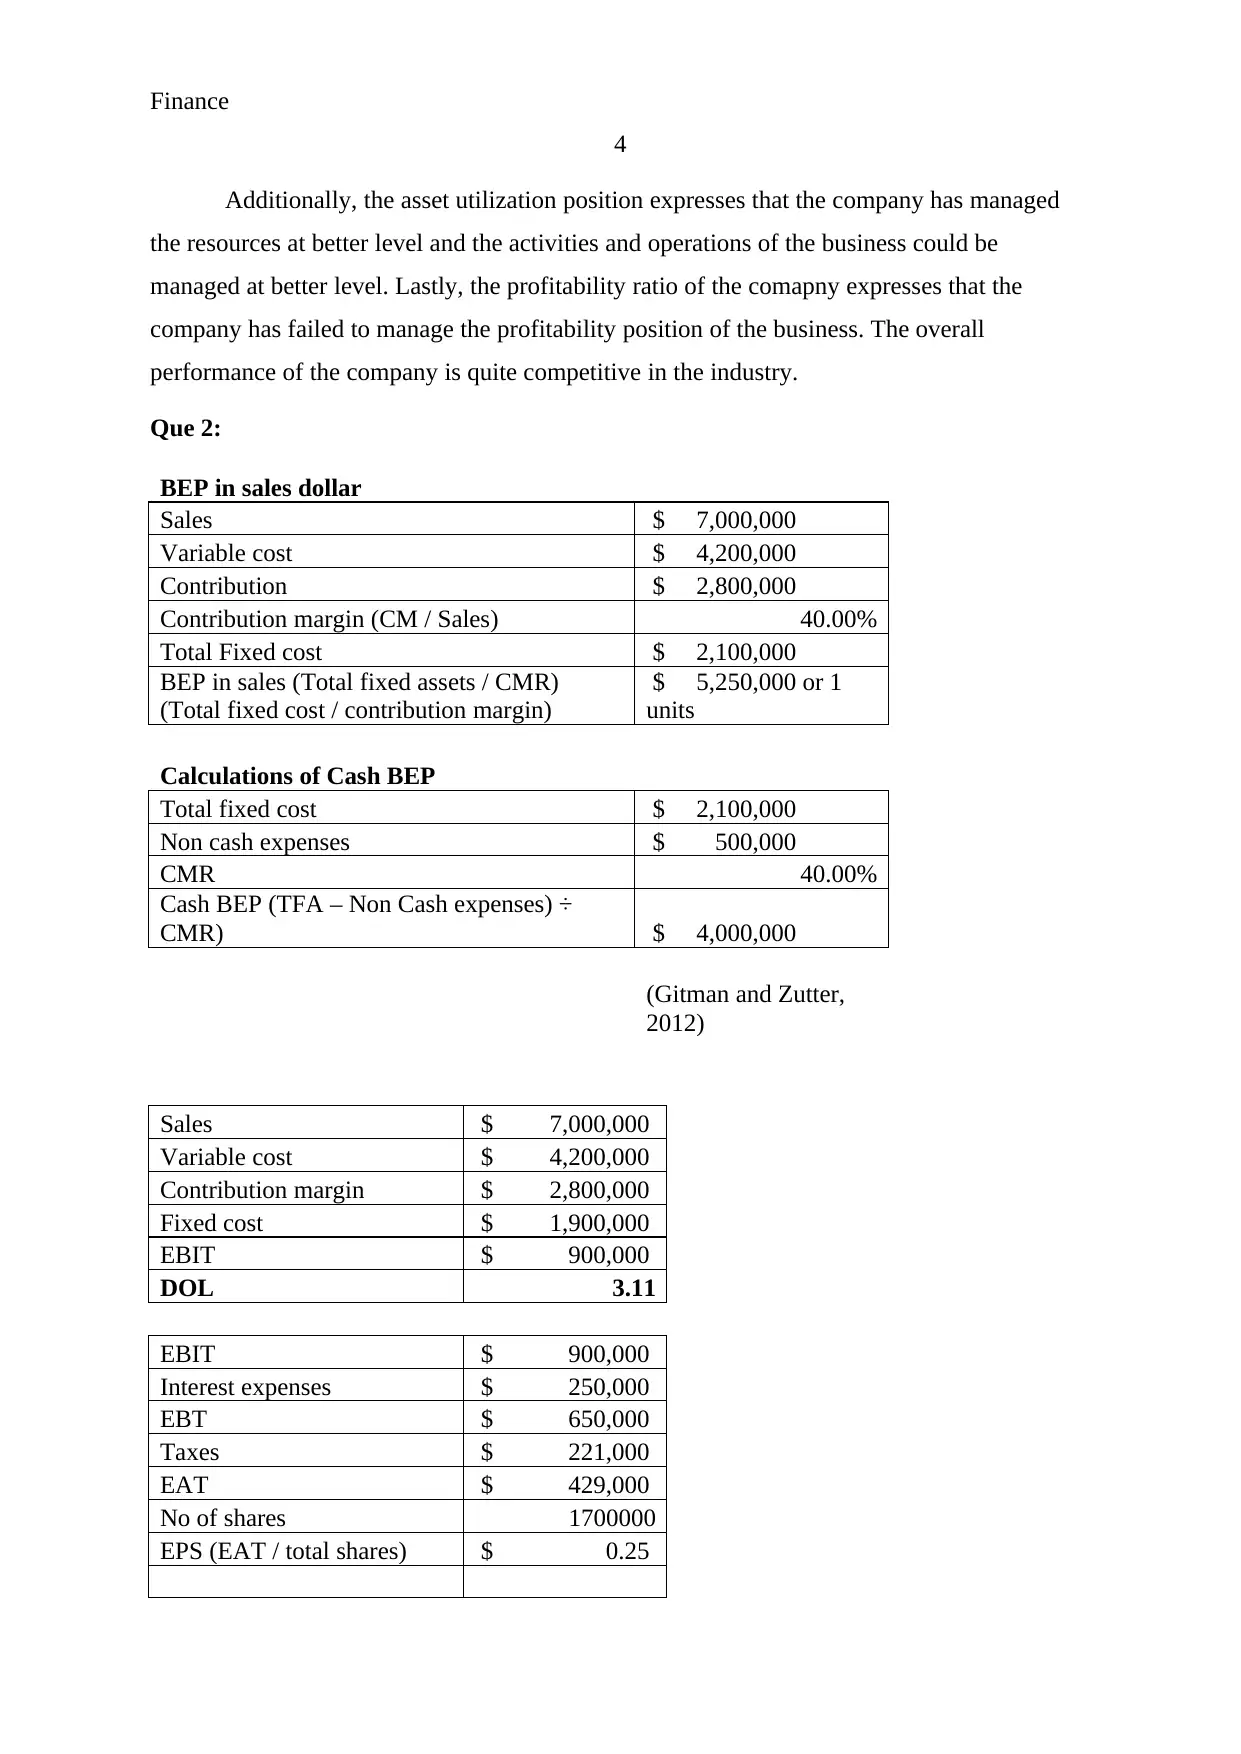
This finance project report provides a comprehensive analysis of Ryan Boot Company using financial ratios to assess its liquidity, debt, asset utilization, and profitability. It calculates break-even points, degrees of operating and financial leverage, and evaluates the risk associated with the company to determine if a bank should loan funds. The report also addresses the company's need for external funds based on anticipated sales increases and explores the impact of changing credit policies on incremental sales and profitability. Additionally, the project examines different financial plans, including conservative, hedged, and aggressive approaches, to optimize net income. The analysis concludes with recommendations for improving the company's financial performance and strategic decision-making.
1 out of 9

Your All-in-One AI-Powered Toolkit for Academic Success.
+13062052269
info@desklib.com
Available 24*7 on WhatsApp / Email
![[object Object]](/_next/static/media/star-bottom.7253800d.svg)
Copyright © 2020–2026 A2Z Services. All Rights Reserved. Developed and managed by ZUCOL.