Finance Case Study: Holding Period Returns and Financial Ratios
VerifiedAdded on 2023/03/20
|9
|1575
|22
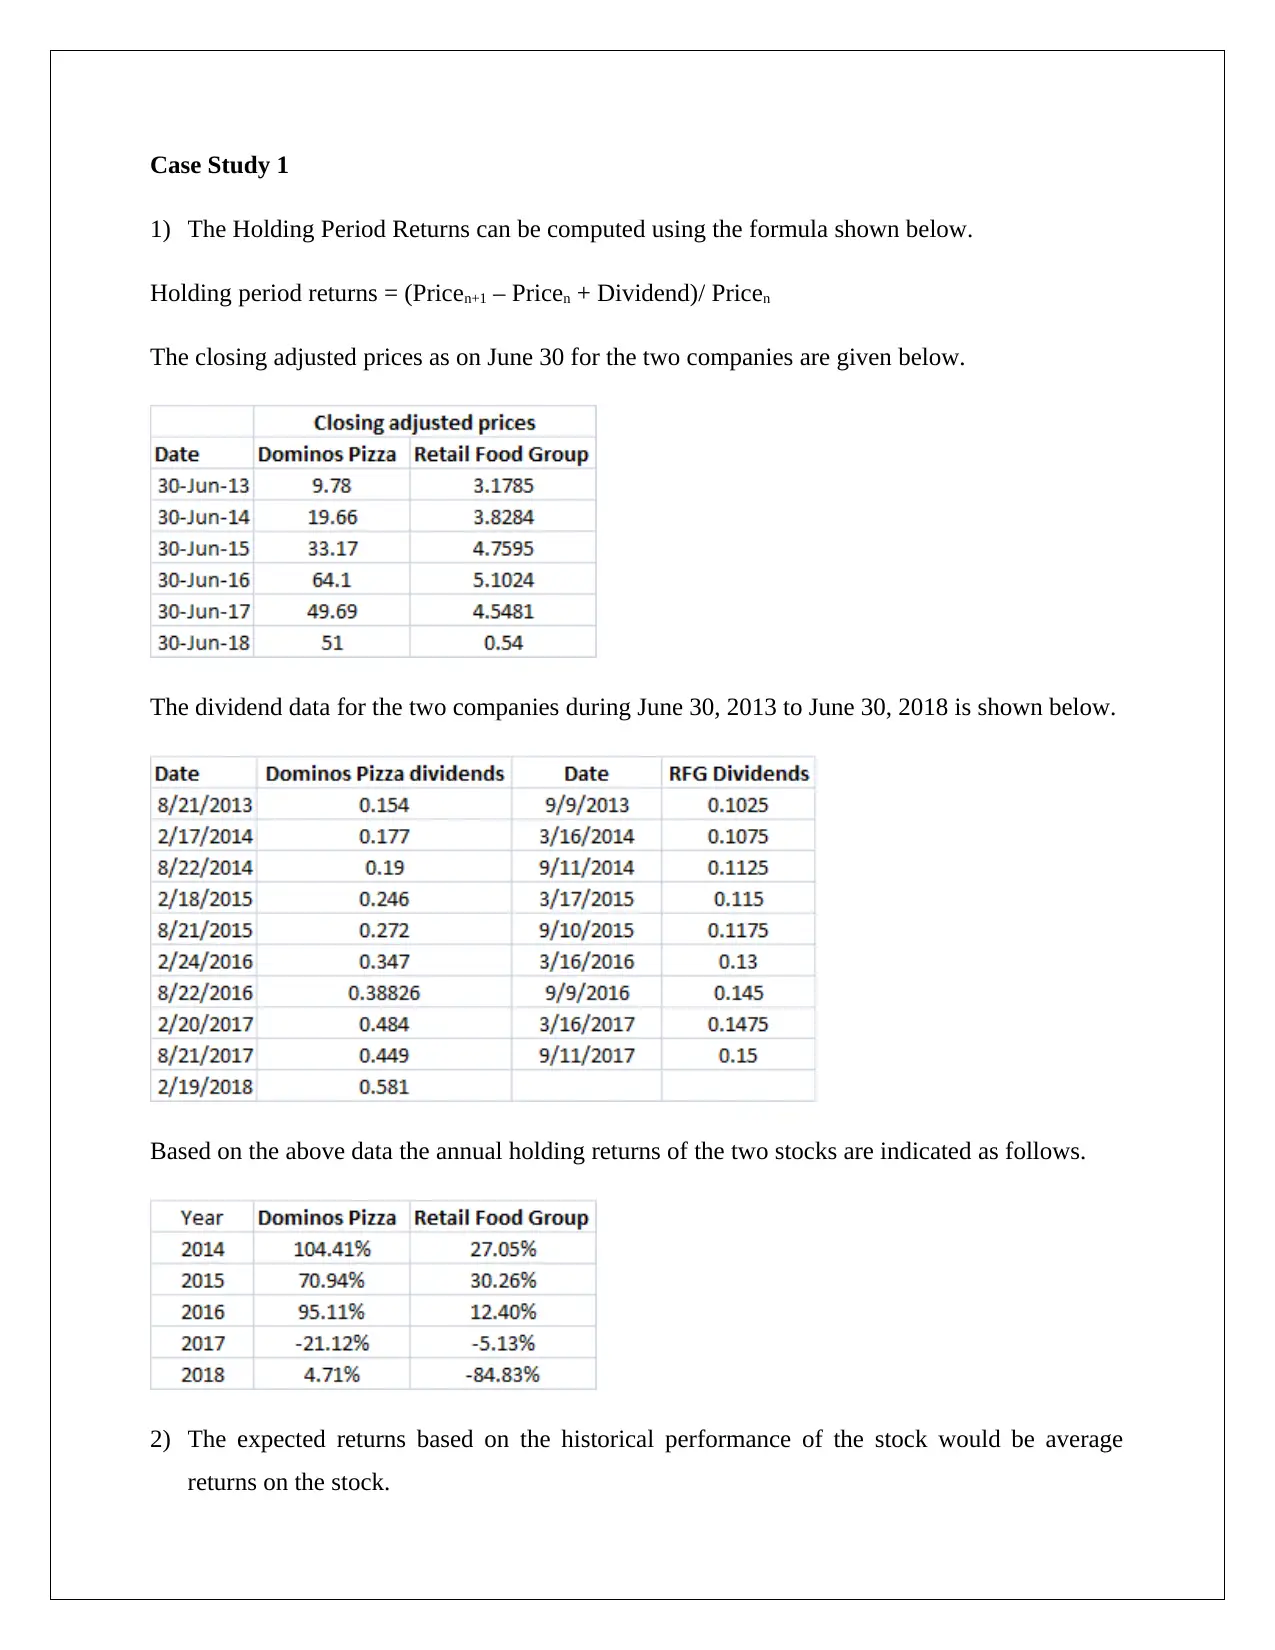
Case Study
AI Summary
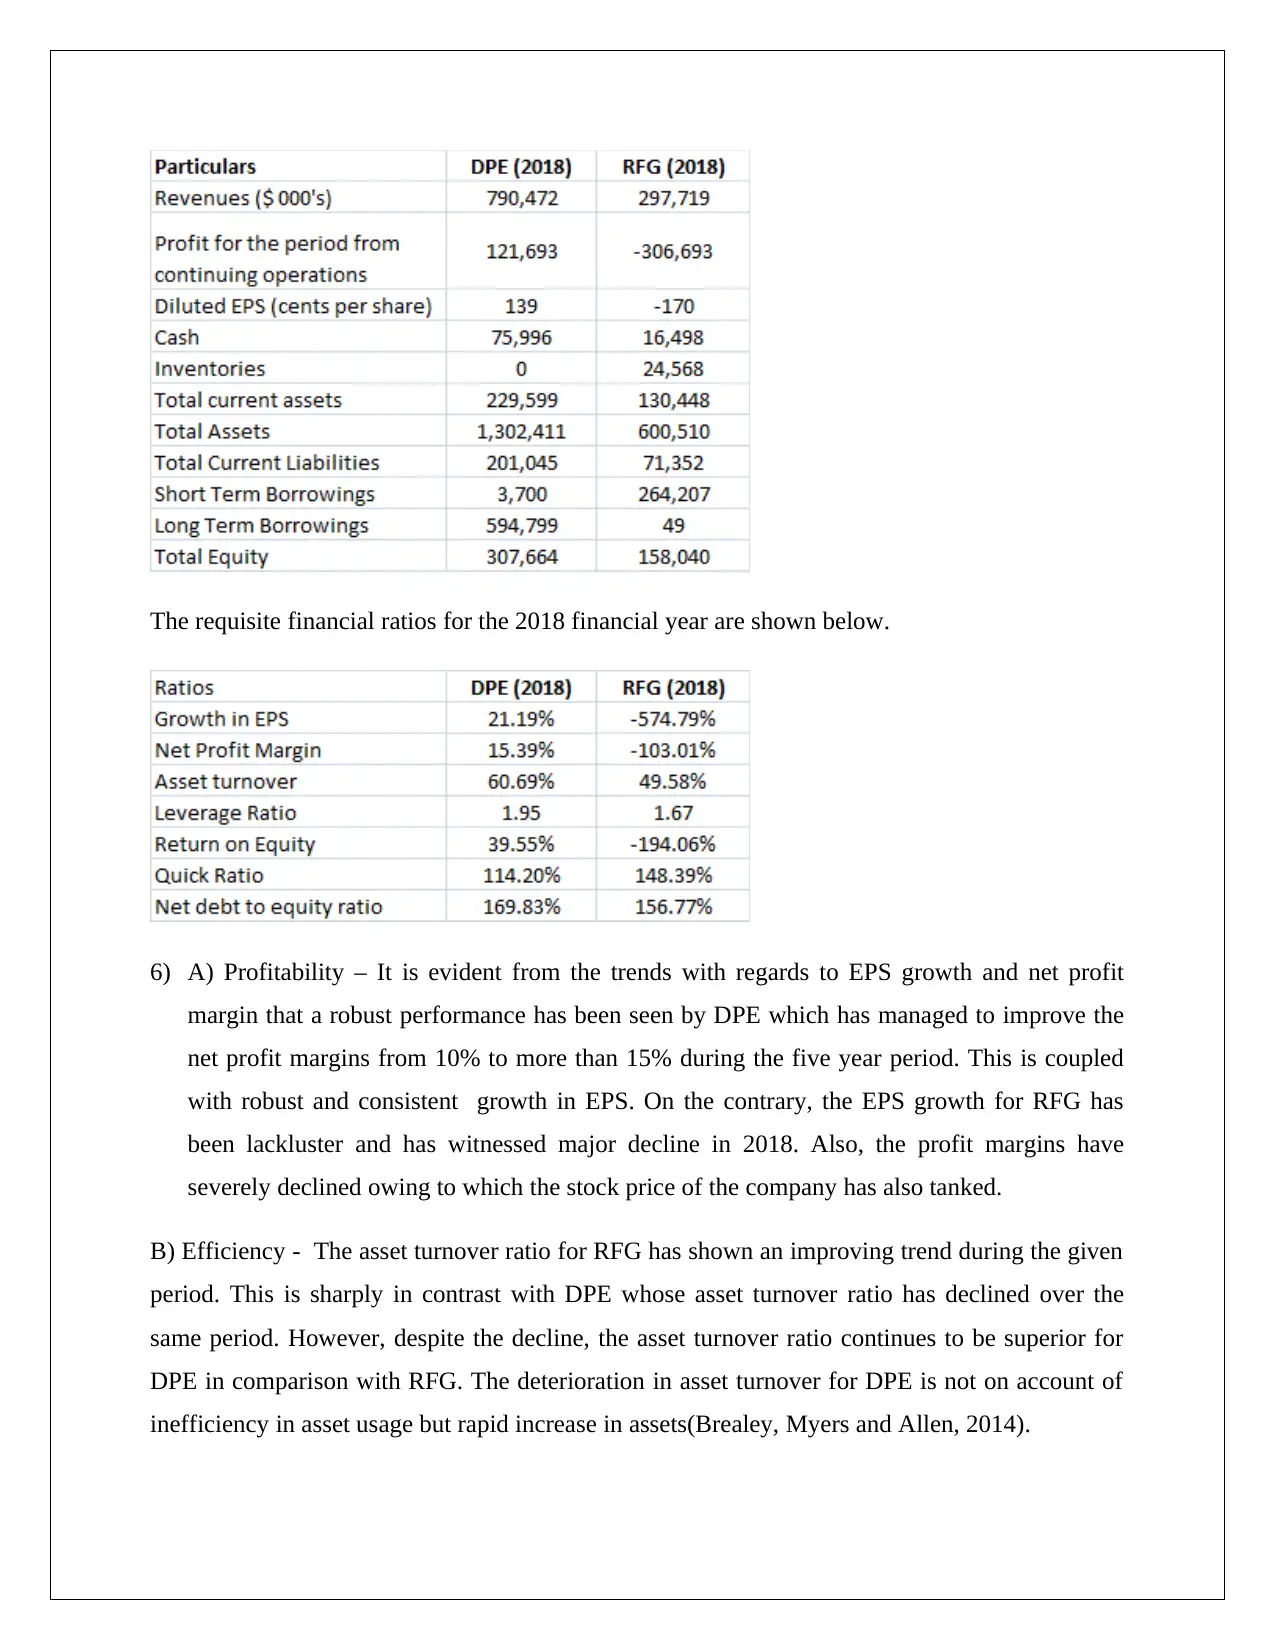
This finance case study analyzes the financial performance of Domino's Pizza Enterprises (DPE) and Retail Food Group (RFG). It calculates holding period returns for both companies from 2013 to 2018, comparing their shareholder returns and evaluating profitability, efficiency, liquidity, and solvency using financial ratios. The study also includes a break-even analysis and profitability assessment for a cupcake business, calculating contribution margins, break-even points, and net present value (NPV) for an investment scenario. The analysis concludes with investment recommendations and a discussion of associated risks. The case study demonstrates the application of financial concepts and decision-making.
1 out of 9
Related Documents


Your All-in-One AI-Powered Toolkit for Academic Success.
+13062052269
info@desklib.com
Available 24*7 on WhatsApp / Email
![[object Object]](/_next/static/media/star-bottom.7253800d.svg)
Copyright © 2020–2025 A2Z Services. All Rights Reserved. Developed and managed by ZUCOL.