Detailed Financial Analysis and Valuation: Tesco vs. Morrison's

Verified

Added on  2021/02/19

|21
|3429
|37
Report
AI Summary
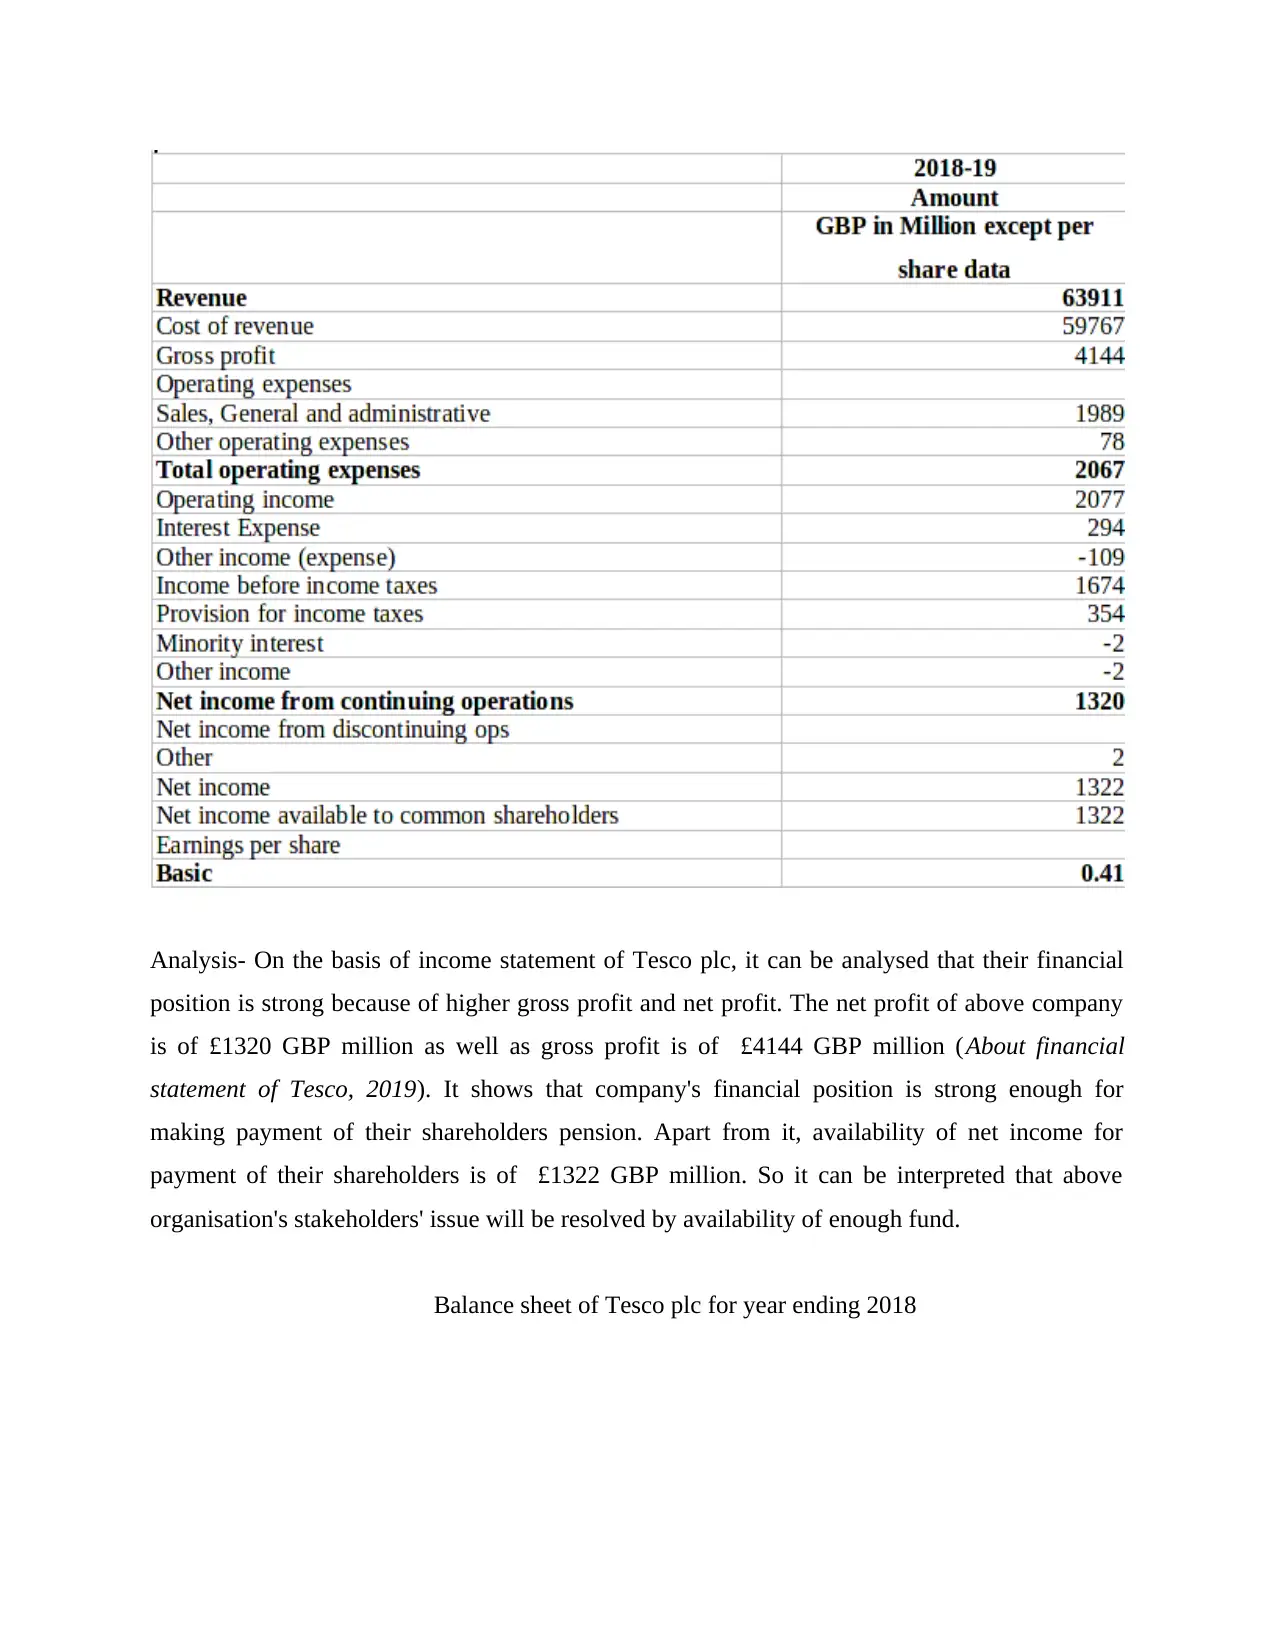
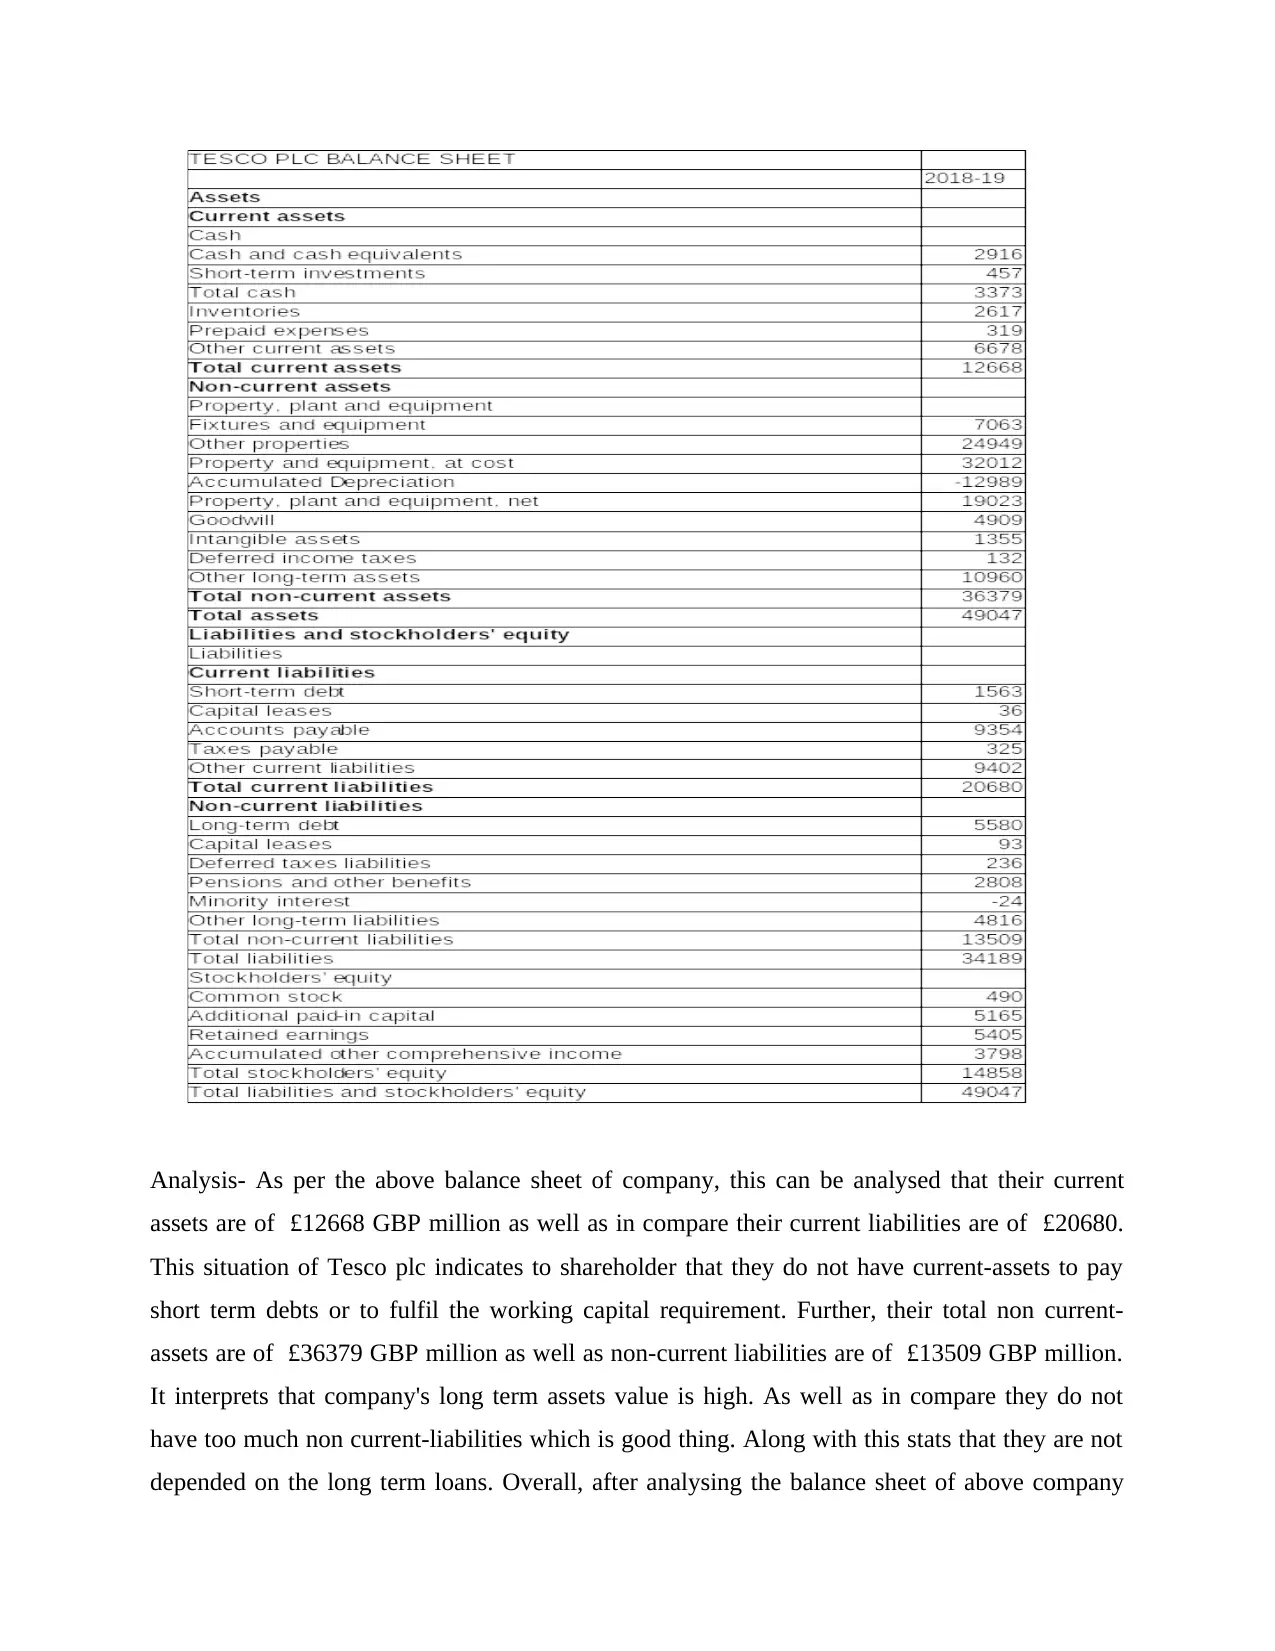
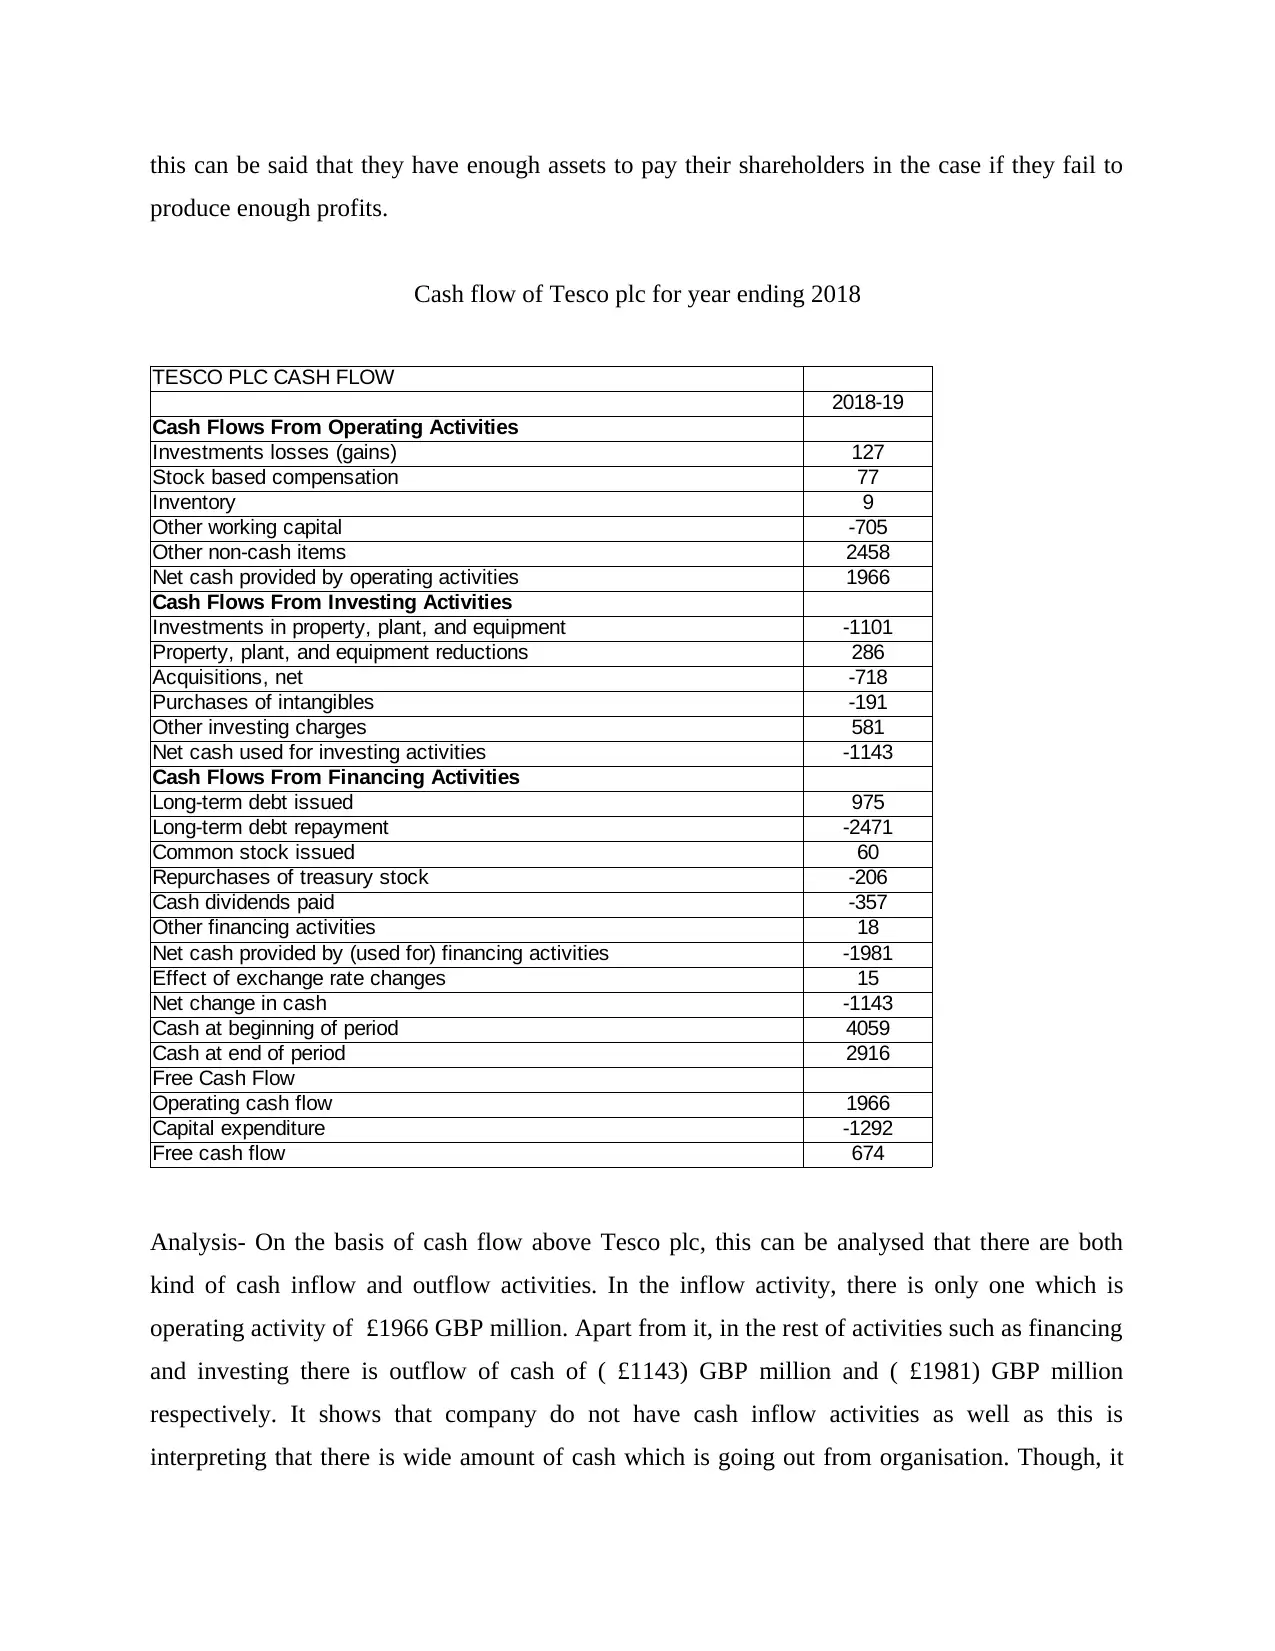
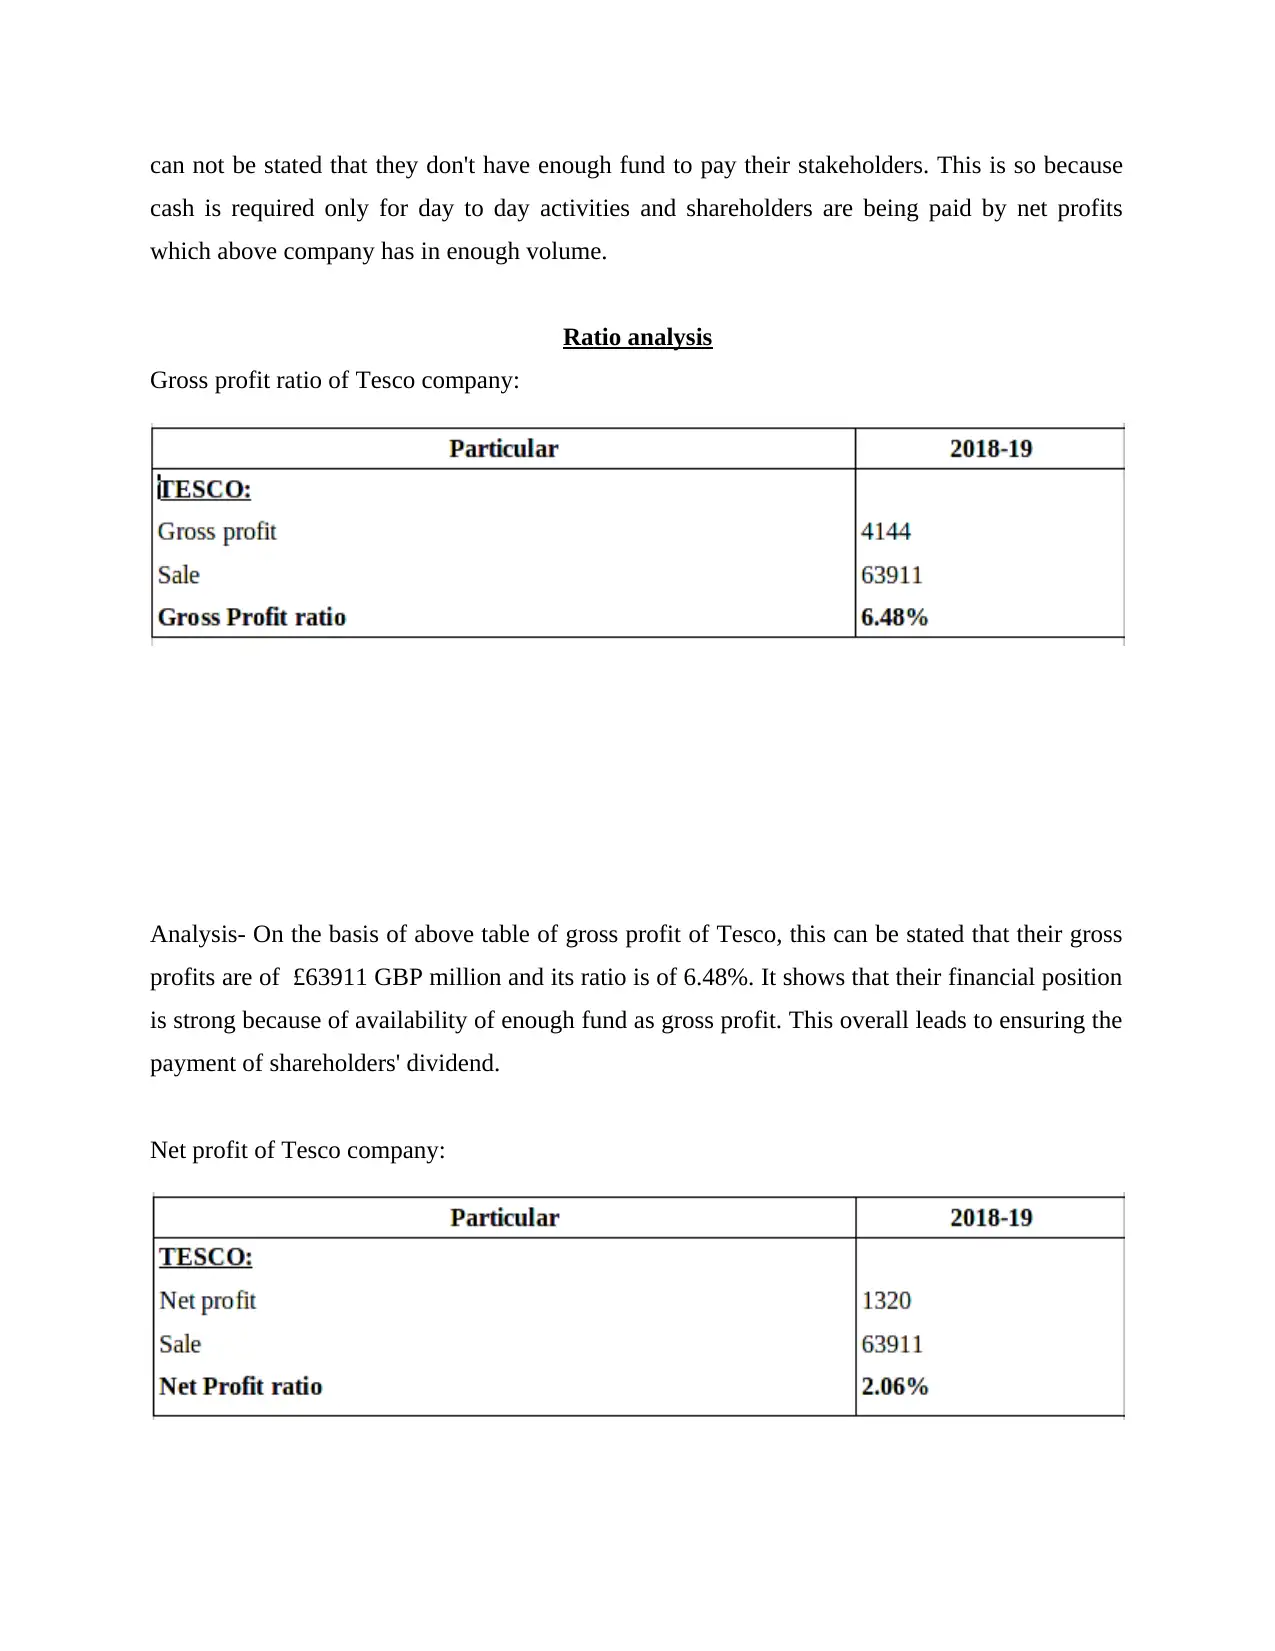
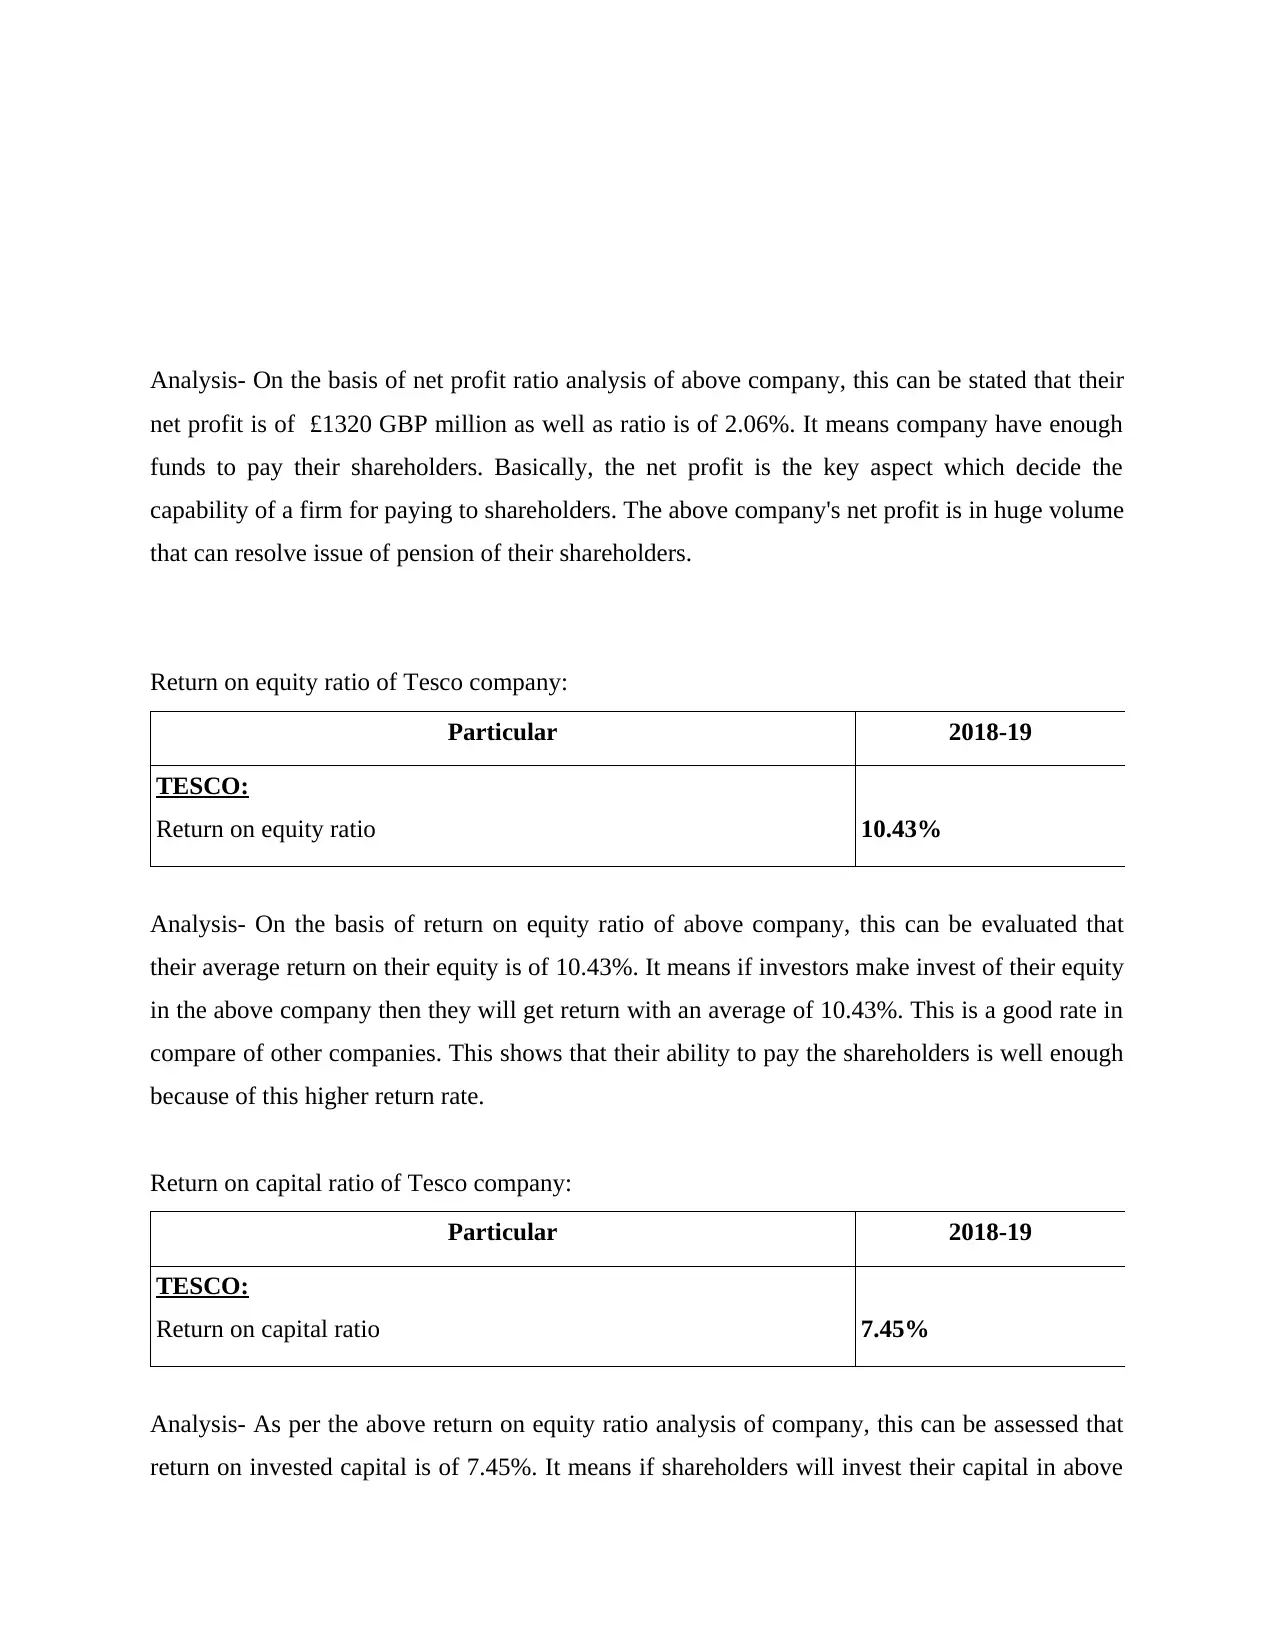
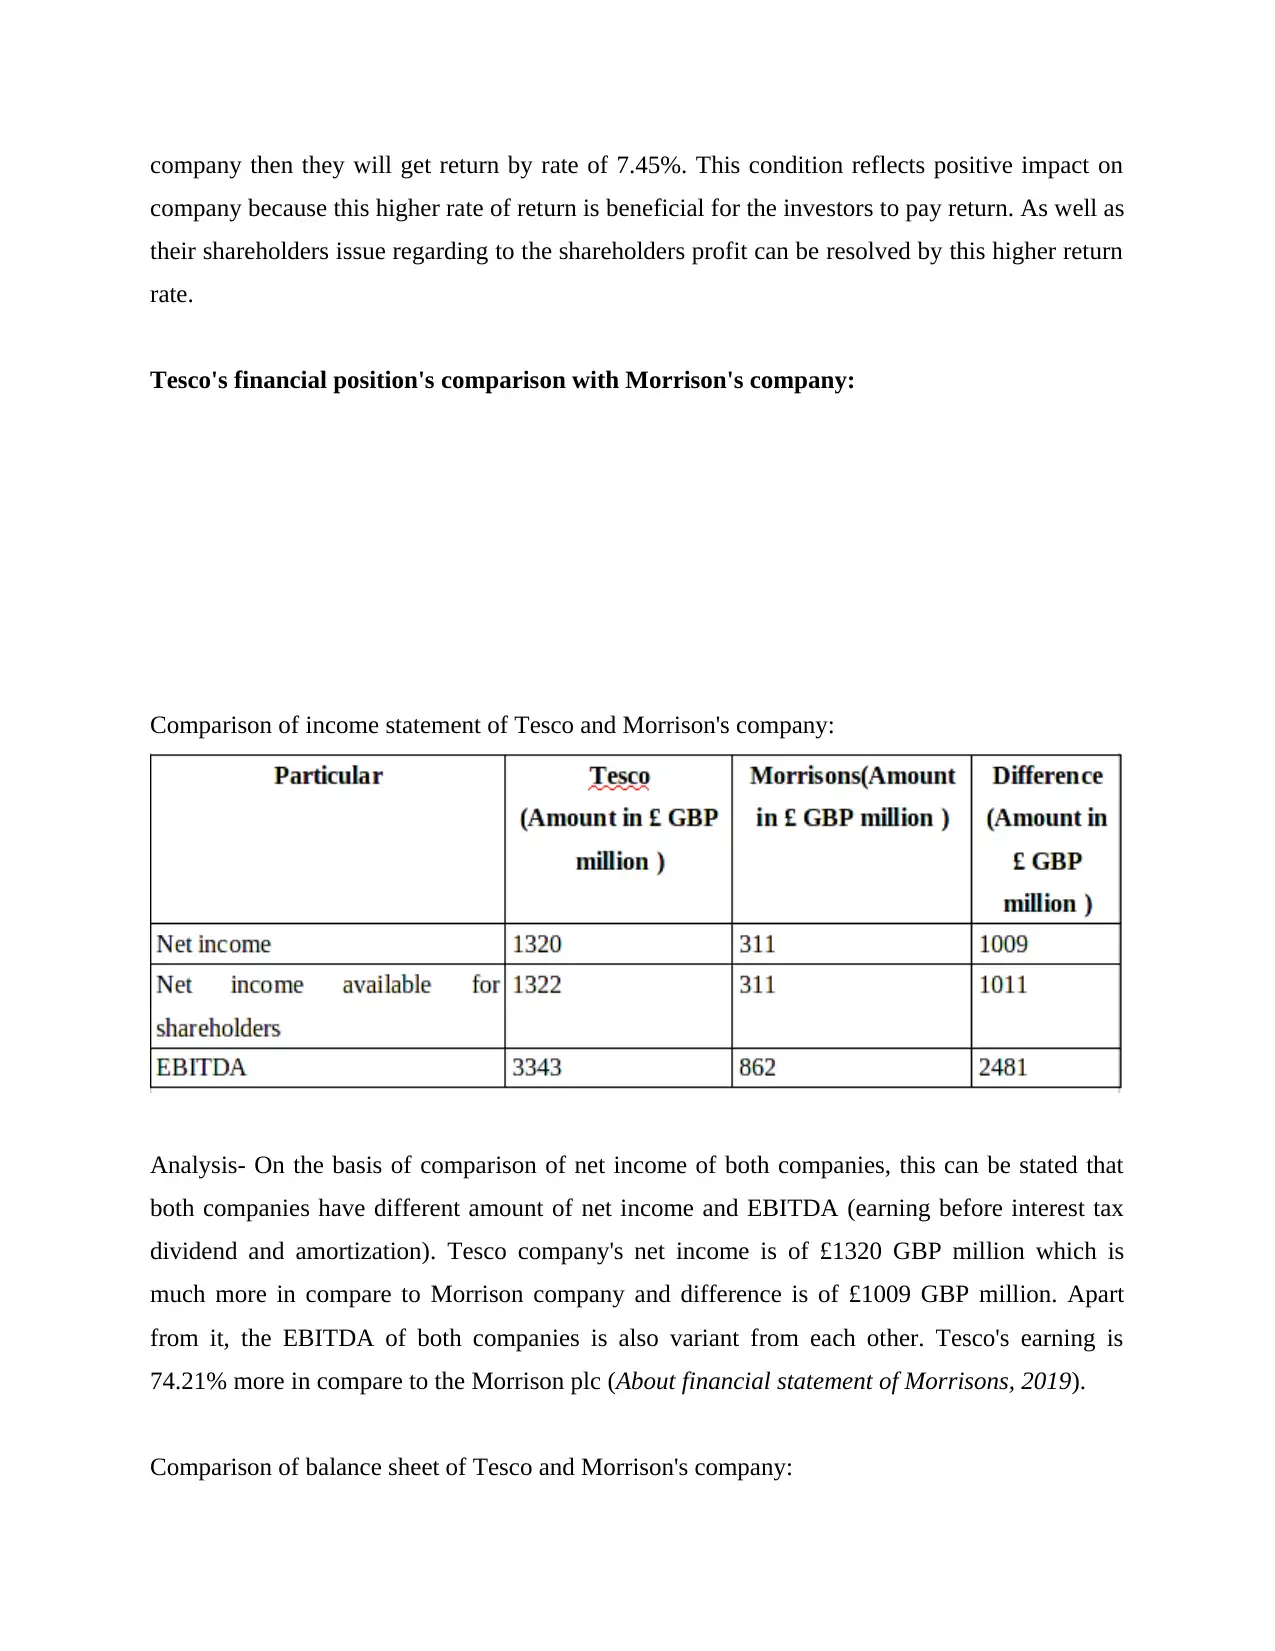
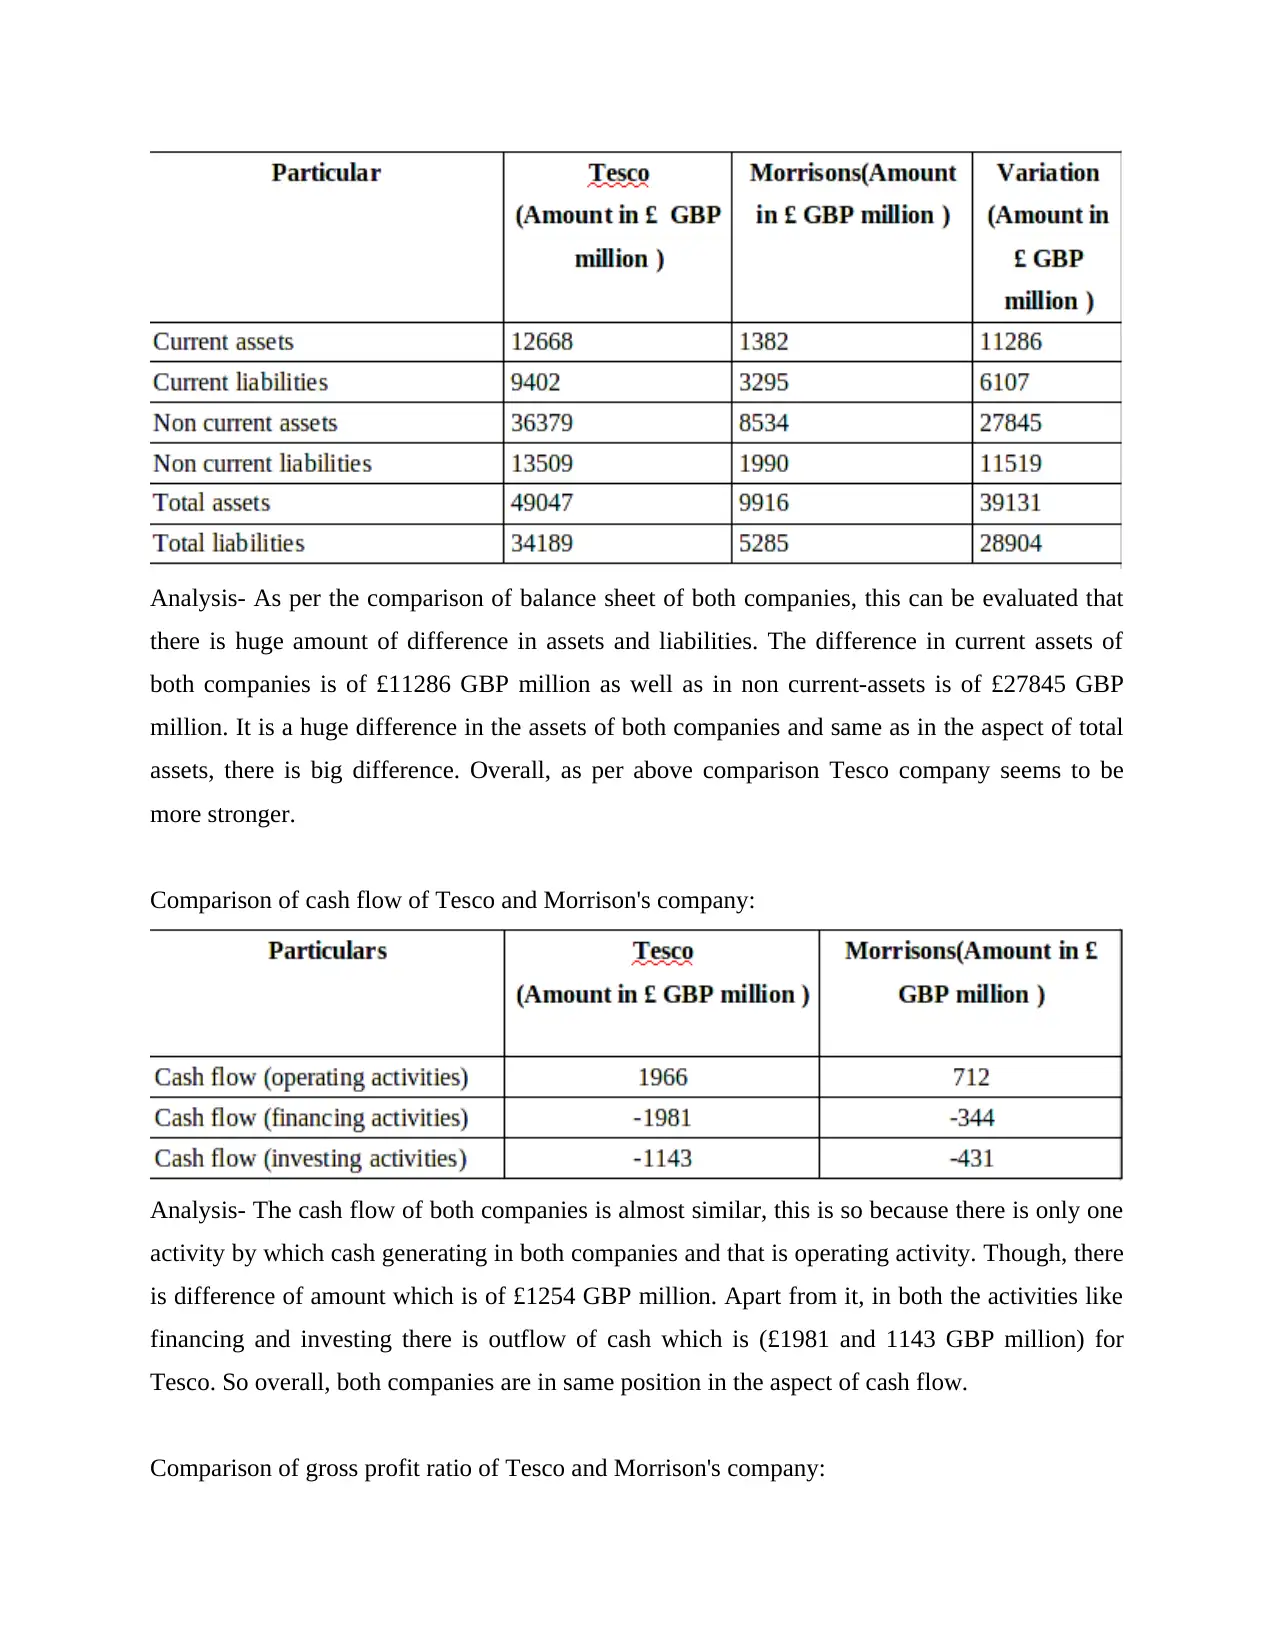
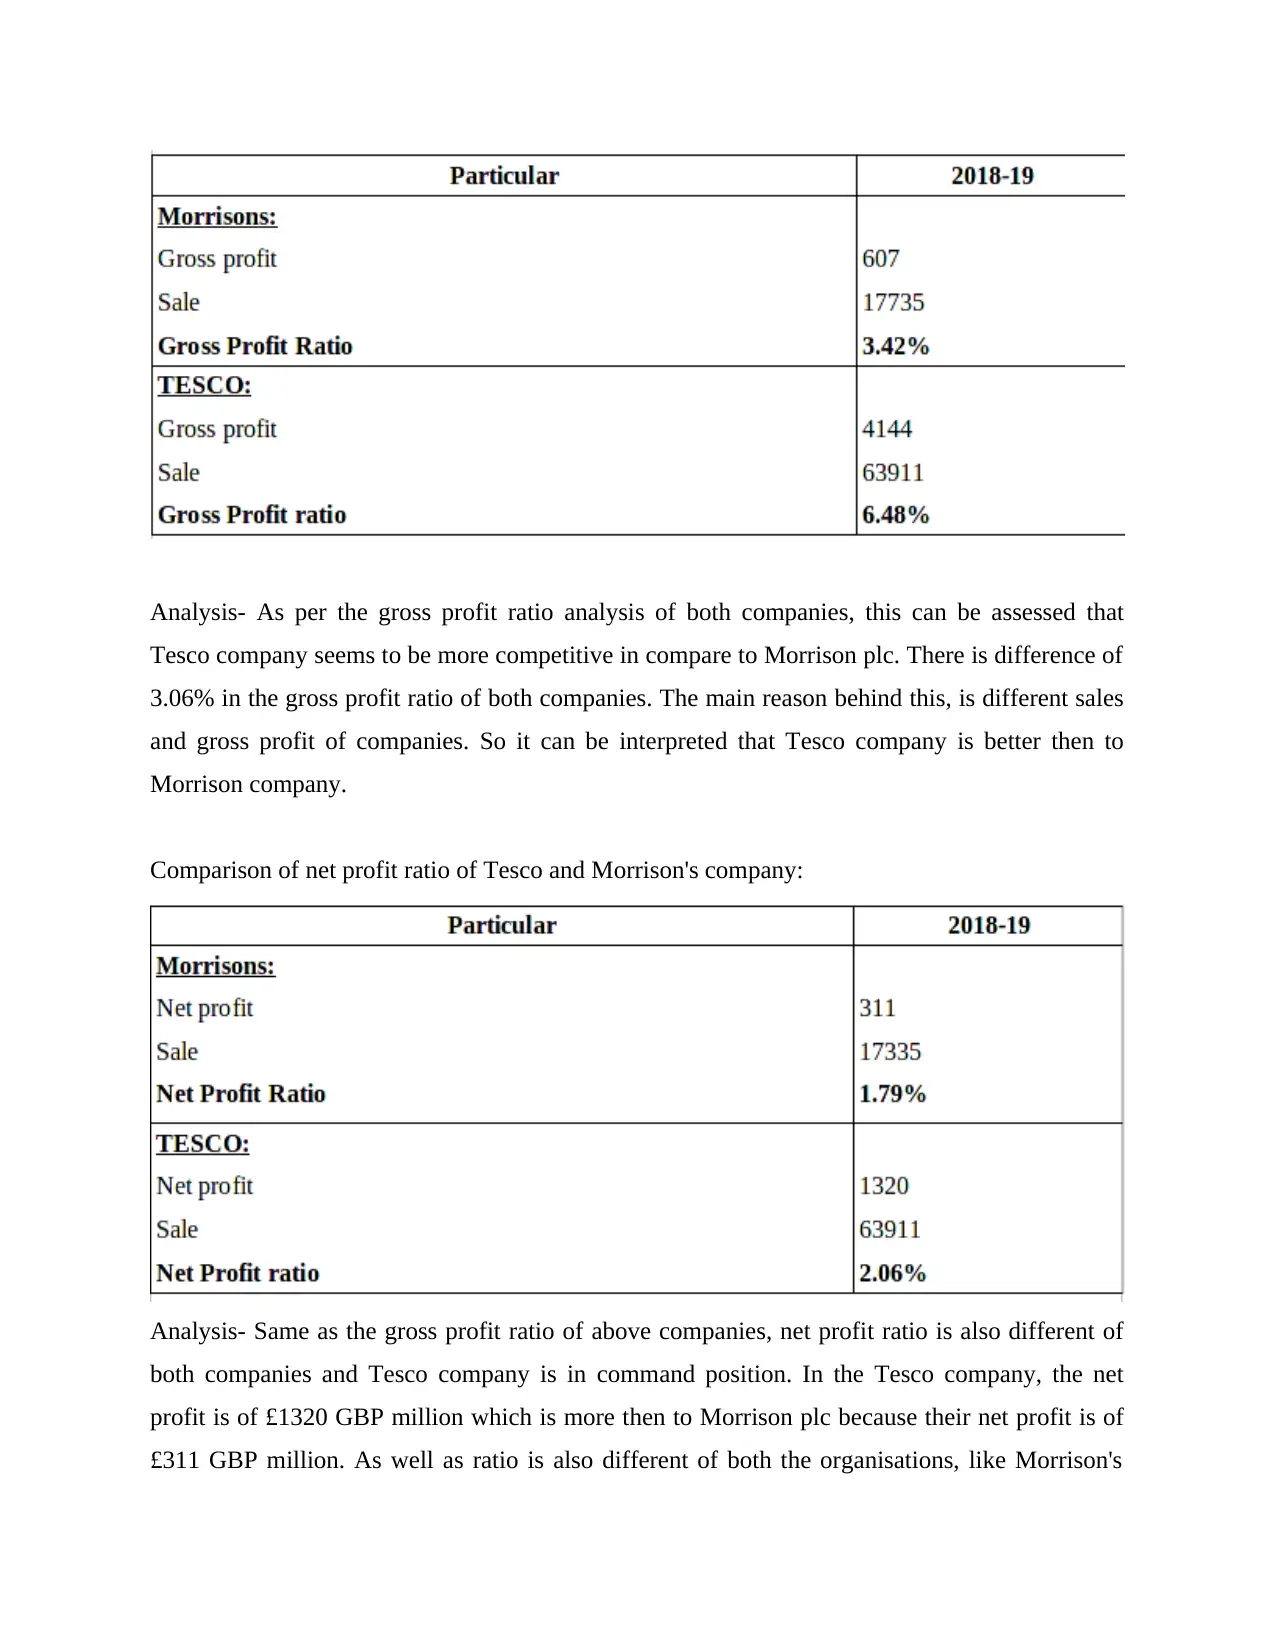
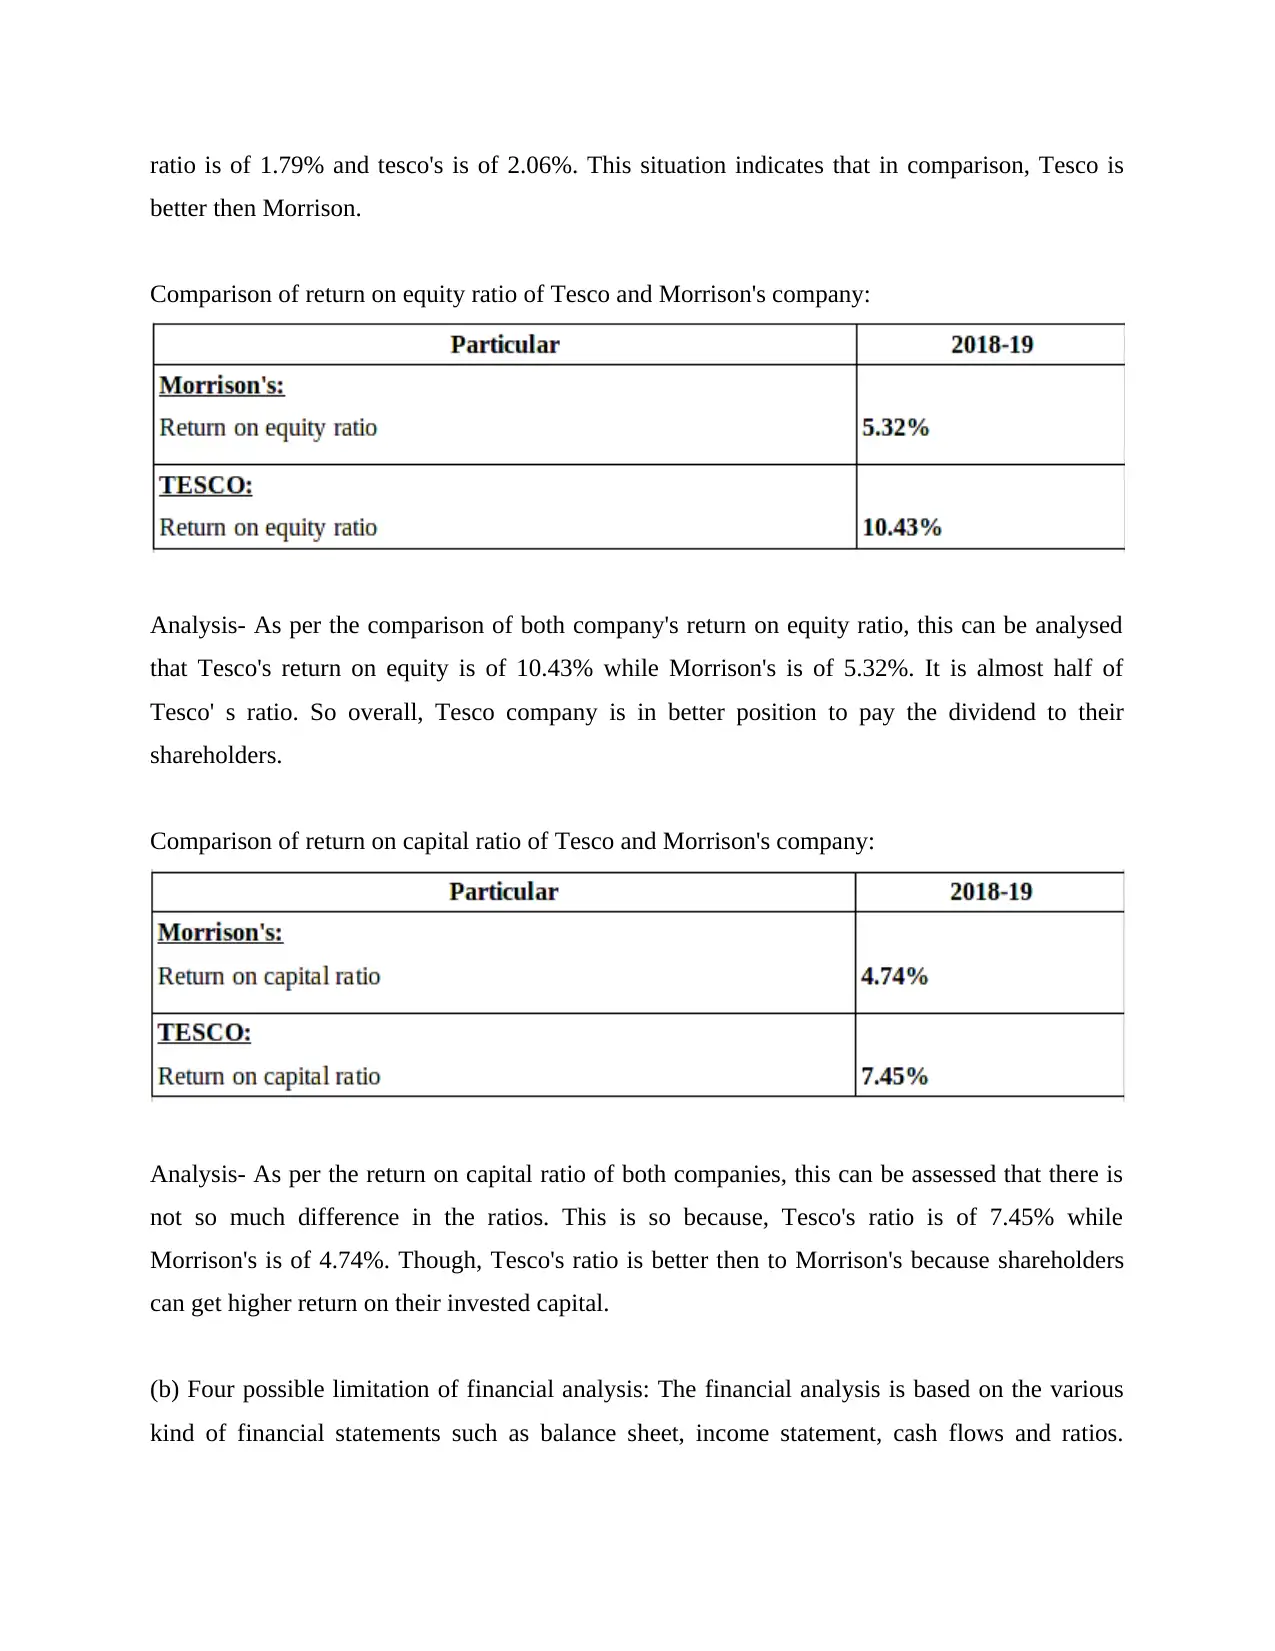
This report provides a detailed financial analysis of Tesco and Morrison's, including their income statements, balance sheets, and cash flow statements. It examines key financial ratios like gross profit margin, net profit margin, return on equity, and return on capital employed to assess their financial health and performance. The report compares the two companies across these metrics, highlighting their strengths and weaknesses. Furthermore, it delves into company valuation using an asset-based approach, presenting a detailed breakdown of assets and liabilities to determine the company's net asset value. Finally, it discusses the capital structure of the companies, offering insights into their financing strategies. The analysis aims to provide a comprehensive understanding of the companies' financial positions and aid in making informed investment decisions. The report also includes an analysis of the limitations of financial analysis.
Document Page
FINANCE
tabler-icon-diamond-filled.svg

Paraphrase This Document

Need a fresh take? Get an instant paraphrase of this document with our AI Paraphraser
Document Page
Table of Contents
INTRODUCTION...........................................................................................................................3
2.1 Financial analysis:.................................................................................................................3
2.2 Valuation of company:........................................................................................................13
2.3 Capital structure..................................................................................................................17
CONCLUSION..............................................................................................................................20
REFERENCES..............................................................................................................................21
Document Page
INTRODUCTION
The term finance is very crucial for organisations because, it is not only essential but also
in the absence of this companies can not even survive (Swift and Piff, 2014). In general, those
companies are considered strong who have enough fund. So, the availability of fund is the key to
success of organisations. For effective management of fund, companies prepare various kind of
financial statements such as income statement, balance sheet, cash flow, ratio calculation etc. In
the project report, detailed analysis of financial statements of both companies is included. As
well as the valuation of company is done with the help of financial reports. Along with in the
end part of project report, various kind of calculation is done on the basis of capital structure.
2.1 Financial analysis:
(a) Financial analysis- The Tesco company's financial statements are analysed below which are
as follows:
Income statement of Tesco plc for year ending 2018
Document Page
Analysis- On the basis of income statement of Tesco plc, it can be analysed that their financial
position is strong because of higher gross profit and net profit. The net profit of above company
is of £1320 GBP million as well as gross profit is of £4144 GBP million (About financial
statement of Tesco, 2019). It shows that company's financial position is strong enough for
making payment of their shareholders pension. Apart from it, availability of net income for
payment of their shareholders is of £1322 GBP million. So it can be interpreted that above
organisation's stakeholders' issue will be resolved by availability of enough fund.
Balance sheet of Tesco plc for year ending 2018
tabler-icon-diamond-filled.svg

Paraphrase This Document

Need a fresh take? Get an instant paraphrase of this document with our AI Paraphraser
Document Page
Analysis- As per the above balance sheet of company, this can be analysed that their current
assets are of £12668 GBP million as well as in compare their current liabilities are of £20680.
This situation of Tesco plc indicates to shareholder that they do not have current-assets to pay
short term debts or to fulfil the working capital requirement. Further, their total non current-
assets are of £36379 GBP million as well as non-current liabilities are of £13509 GBP million.
It interprets that company's long term assets value is high. As well as in compare they do not
have too much non current-liabilities which is good thing. Along with this stats that they are not
depended on the long term loans. Overall, after analysing the balance sheet of above company
Document Page
this can be said that they have enough assets to pay their shareholders in the case if they fail to
produce enough profits.
Cash flow of Tesco plc for year ending 2018
TESCO PLC CASH FLOW
2018-19
Cash Flows From Operating Activities
Investments losses (gains) 127
Stock based compensation 77
Inventory 9
Other working capital -705
Other non-cash items 2458
Net cash provided by operating activities 1966
Cash Flows From Investing Activities
Investments in property, plant, and equipment -1101
Property, plant, and equipment reductions 286
Acquisitions, net -718
Purchases of intangibles -191
Other investing charges 581
Net cash used for investing activities -1143
Cash Flows From Financing Activities
Long-term debt issued 975
Long-term debt repayment -2471
Common stock issued 60
Repurchases of treasury stock -206
Cash dividends paid -357
Other financing activities 18
Net cash provided by (used for) financing activities -1981
Effect of exchange rate changes 15
Net change in cash -1143
Cash at beginning of period 4059
Cash at end of period 2916
Free Cash Flow
Operating cash flow 1966
Capital expenditure -1292
Free cash flow 674
Analysis- On the basis of cash flow above Tesco plc, this can be analysed that there are both
kind of cash inflow and outflow activities. In the inflow activity, there is only one which is
operating activity of £1966 GBP million. Apart from it, in the rest of activities such as financing
and investing there is outflow of cash of ( £1143) GBP million and ( £1981) GBP million
respectively. It shows that company do not have cash inflow activities as well as this is
interpreting that there is wide amount of cash which is going out from organisation. Though, it
Document Page
can not be stated that they don't have enough fund to pay their stakeholders. This is so because
cash is required only for day to day activities and shareholders are being paid by net profits
which above company has in enough volume.
Ratio analysis
Gross profit ratio of Tesco company:
Analysis- On the basis of above table of gross profit of Tesco, this can be stated that their gross
profits are of £63911 GBP million and its ratio is of 6.48%. It shows that their financial position
is strong because of availability of enough fund as gross profit. This overall leads to ensuring the
payment of shareholders' dividend.
Net profit of Tesco company:
tabler-icon-diamond-filled.svg

Paraphrase This Document

Need a fresh take? Get an instant paraphrase of this document with our AI Paraphraser
Document Page
Analysis- On the basis of net profit ratio analysis of above company, this can be stated that their
net profit is of £1320 GBP million as well as ratio is of 2.06%. It means company have enough
funds to pay their shareholders. Basically, the net profit is the key aspect which decide the
capability of a firm for paying to shareholders. The above company's net profit is in huge volume
that can resolve issue of pension of their shareholders.
Return on equity ratio of Tesco company:
Particular 2018-19
TESCO:
Return on equity ratio 10.43%
Analysis- On the basis of return on equity ratio of above company, this can be evaluated that
their average return on their equity is of 10.43%. It means if investors make invest of their equity
in the above company then they will get return with an average of 10.43%. This is a good rate in
compare of other companies. This shows that their ability to pay the shareholders is well enough
because of this higher return rate.
Return on capital ratio of Tesco company:
Particular 2018-19
TESCO:
Return on capital ratio 7.45%
Analysis- As per the above return on equity ratio analysis of company, this can be assessed that
return on invested capital is of 7.45%. It means if shareholders will invest their capital in above
Document Page
company then they will get return by rate of 7.45%. This condition reflects positive impact on
company because this higher rate of return is beneficial for the investors to pay return. As well as
their shareholders issue regarding to the shareholders profit can be resolved by this higher return
rate.
Tesco's financial position's comparison with Morrison's company:
Comparison of income statement of Tesco and Morrison's company:
Analysis- On the basis of comparison of net income of both companies, this can be stated that
both companies have different amount of net income and EBITDA (earning before interest tax
dividend and amortization). Tesco company's net income is of £1320 GBP million which is
much more in compare to Morrison company and difference is of £1009 GBP million. Apart
from it, the EBITDA of both companies is also variant from each other. Tesco's earning is
74.21% more in compare to the Morrison plc (About financial statement of Morrisons, 2019).
Comparison of balance sheet of Tesco and Morrison's company:
Document Page
Analysis- As per the comparison of balance sheet of both companies, this can be evaluated that
there is huge amount of difference in assets and liabilities. The difference in current assets of
both companies is of £11286 GBP million as well as in non current-assets is of £27845 GBP
million. It is a huge difference in the assets of both companies and same as in the aspect of total
assets, there is big difference. Overall, as per above comparison Tesco company seems to be
more stronger.
Comparison of cash flow of Tesco and Morrison's company:
Analysis- The cash flow of both companies is almost similar, this is so because there is only one
activity by which cash generating in both companies and that is operating activity. Though, there
is difference of amount which is of £1254 GBP million. Apart from it, in both the activities like
financing and investing there is outflow of cash which is (£1981 and 1143 GBP million) for
Tesco. So overall, both companies are in same position in the aspect of cash flow.
Comparison of gross profit ratio of Tesco and Morrison's company:
tabler-icon-diamond-filled.svg

Paraphrase This Document

Need a fresh take? Get an instant paraphrase of this document with our AI Paraphraser
Document Page
Analysis- As per the gross profit ratio analysis of both companies, this can be assessed that
Tesco company seems to be more competitive in compare to Morrison plc. There is difference of
3.06% in the gross profit ratio of both companies. The main reason behind this, is different sales
and gross profit of companies. So it can be interpreted that Tesco company is better then to
Morrison company.
Comparison of net profit ratio of Tesco and Morrison's company:
Analysis- Same as the gross profit ratio of above companies, net profit ratio is also different of
both companies and Tesco company is in command position. In the Tesco company, the net
profit is of £1320 GBP million which is more then to Morrison plc because their net profit is of
£311 GBP million. As well as ratio is also different of both the organisations, like Morrison's
Document Page
ratio is of 1.79% and tesco's is of 2.06%. This situation indicates that in comparison, Tesco is
better then Morrison.
Comparison of return on equity ratio of Tesco and Morrison's company:
Analysis- As per the comparison of both company's return on equity ratio, this can be analysed
that Tesco's return on equity is of 10.43% while Morrison's is of 5.32%. It is almost half of
Tesco' s ratio. So overall, Tesco company is in better position to pay the dividend to their
shareholders.
Comparison of return on capital ratio of Tesco and Morrison's company:
Analysis- As per the return on capital ratio of both companies, this can be assessed that there is
not so much difference in the ratios. This is so because, Tesco's ratio is of 7.45% while
Morrison's is of 4.74%. Though, Tesco's ratio is better then to Morrison's because shareholders
can get higher return on their invested capital.
(b) Four possible limitation of financial analysis: The financial analysis is based on the various
kind of financial statements such as balance sheet, income statement, cash flows and ratios.
chevron_up_icon
1 out of 21
circle_padding
hide_on_mobile
zoom_out_icon
[object Object]