(PDF) Case Examples of Project Evaluations
VerifiedAdded on 2021/05/31
|6
|1278
|54
AI Summary
Contribute Materials
Your contribution can guide someone’s learning journey. Share your
documents today.

FINANCE
Secure Best Marks with AI Grader
Need help grading? Try our AI Grader for instant feedback on your assignments.
To : CEO, Pinto Limited
From : STUDENT’S NAME
Date : 18TH MAY, 2018
Subject : Evaluation of introduction of new project
This project is made in order to check the feasibility of the project with the help of capital
budgeting technique. The projected cash flows are used to carry out capital budgeting.
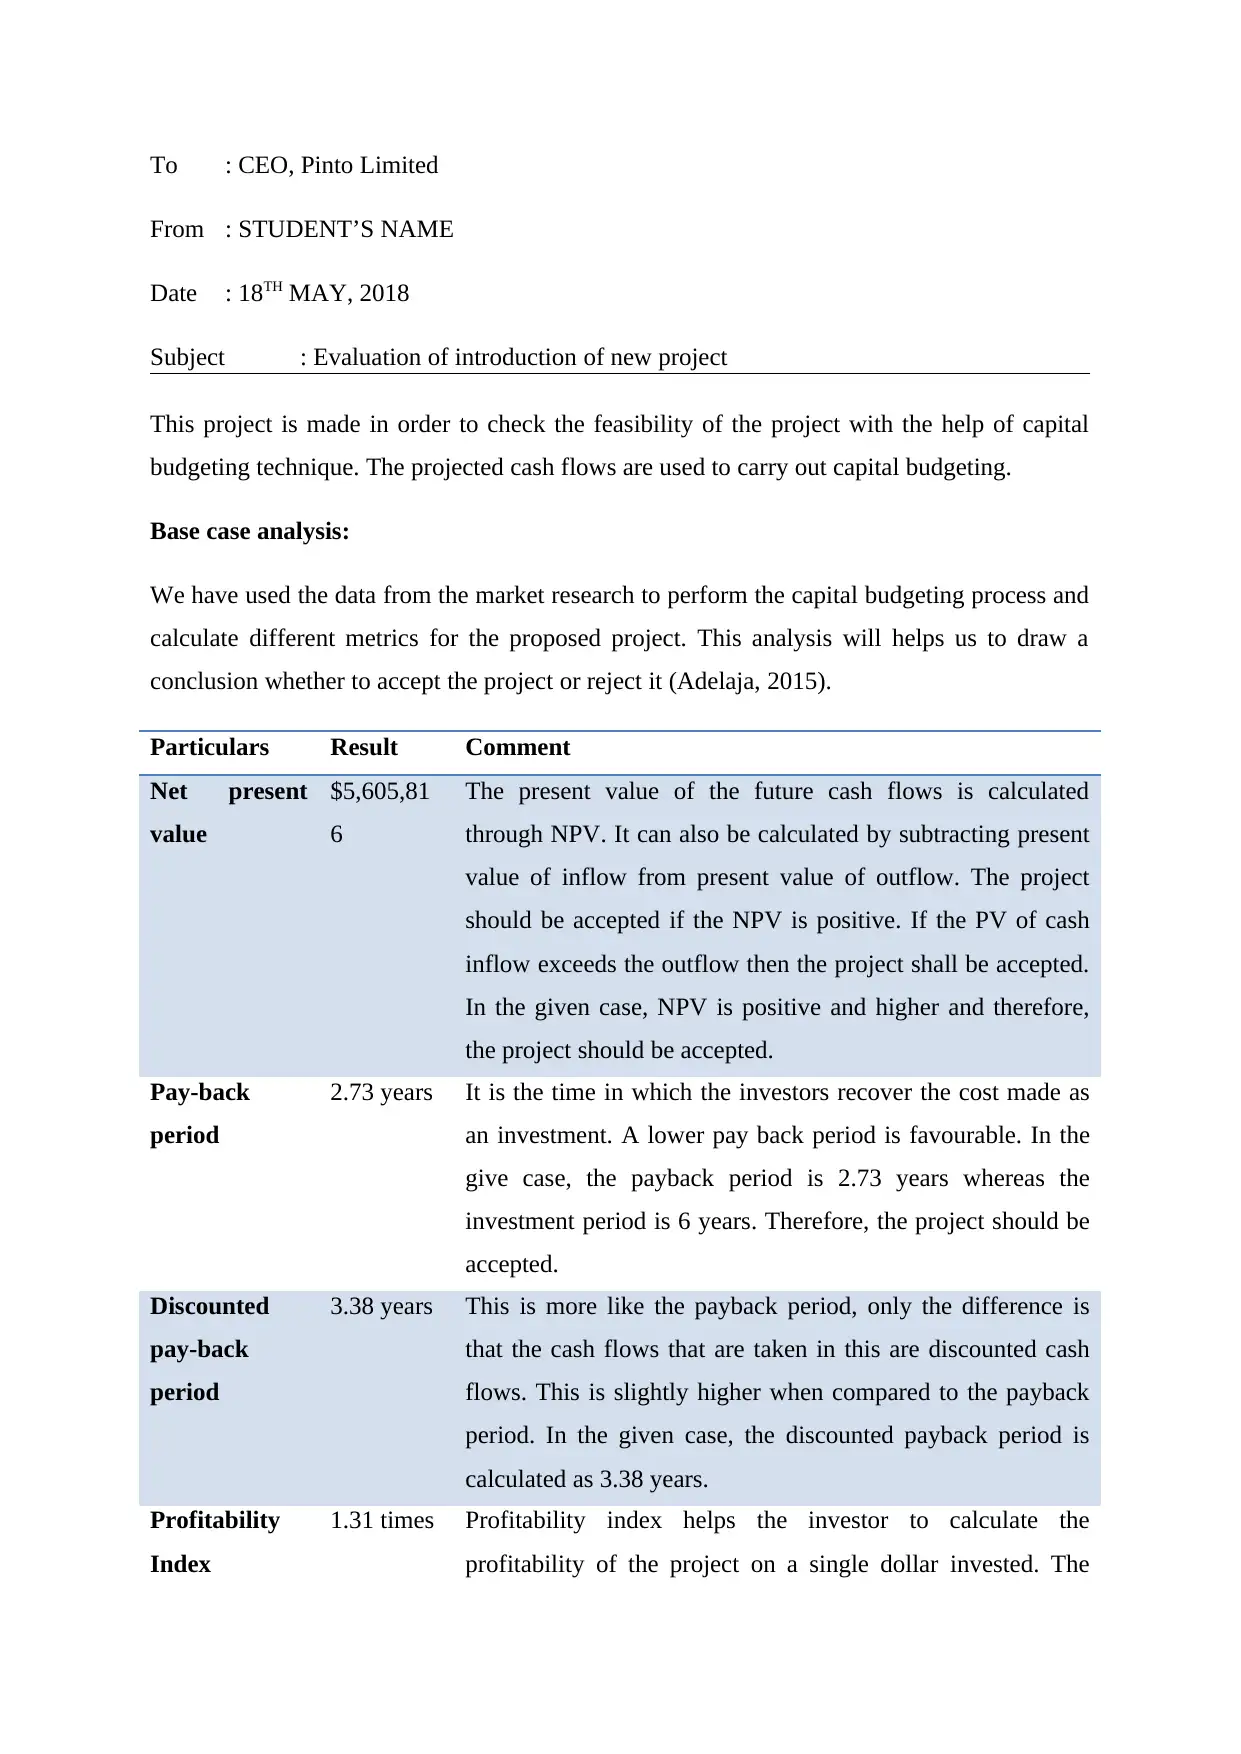
Base case analysis:
We have used the data from the market research to perform the capital budgeting process and
calculate different metrics for the proposed project. This analysis will helps us to draw a
conclusion whether to accept the project or reject it (Adelaja, 2015).
Particulars Result Comment
Net present
value
$5,605,81
6
The present value of the future cash flows is calculated
through NPV. It can also be calculated by subtracting present
value of inflow from present value of outflow. The project
should be accepted if the NPV is positive. If the PV of cash
inflow exceeds the outflow then the project shall be accepted.
In the given case, NPV is positive and higher and therefore,
the project should be accepted.
Pay-back
period
2.73 years It is the time in which the investors recover the cost made as
an investment. A lower pay back period is favourable. In the
give case, the payback period is 2.73 years whereas the
investment period is 6 years. Therefore, the project should be
accepted.
Discounted
pay-back
period
3.38 years This is more like the payback period, only the difference is
that the cash flows that are taken in this are discounted cash
flows. This is slightly higher when compared to the payback
period. In the given case, the discounted payback period is
calculated as 3.38 years.
Profitability
Index
1.31 times Profitability index helps the investor to calculate the
profitability of the project on a single dollar invested. The
From : STUDENT’S NAME
Date : 18TH MAY, 2018
Subject : Evaluation of introduction of new project
This project is made in order to check the feasibility of the project with the help of capital
budgeting technique. The projected cash flows are used to carry out capital budgeting.
Base case analysis:
We have used the data from the market research to perform the capital budgeting process and
calculate different metrics for the proposed project. This analysis will helps us to draw a
conclusion whether to accept the project or reject it (Adelaja, 2015).
Particulars Result Comment
Net present
value
$5,605,81
6
The present value of the future cash flows is calculated
through NPV. It can also be calculated by subtracting present
value of inflow from present value of outflow. The project
should be accepted if the NPV is positive. If the PV of cash
inflow exceeds the outflow then the project shall be accepted.
In the given case, NPV is positive and higher and therefore,
the project should be accepted.
Pay-back
period
2.73 years It is the time in which the investors recover the cost made as
an investment. A lower pay back period is favourable. In the
give case, the payback period is 2.73 years whereas the
investment period is 6 years. Therefore, the project should be
accepted.
Discounted
pay-back
period
3.38 years This is more like the payback period, only the difference is
that the cash flows that are taken in this are discounted cash
flows. This is slightly higher when compared to the payback
period. In the given case, the discounted payback period is
calculated as 3.38 years.
Profitability
Index
1.31 times Profitability index helps the investor to calculate the
profitability of the project on a single dollar invested. The
profitability index is 1.31 times. This shows that the project
will earn $1.31 for every $1 invested.
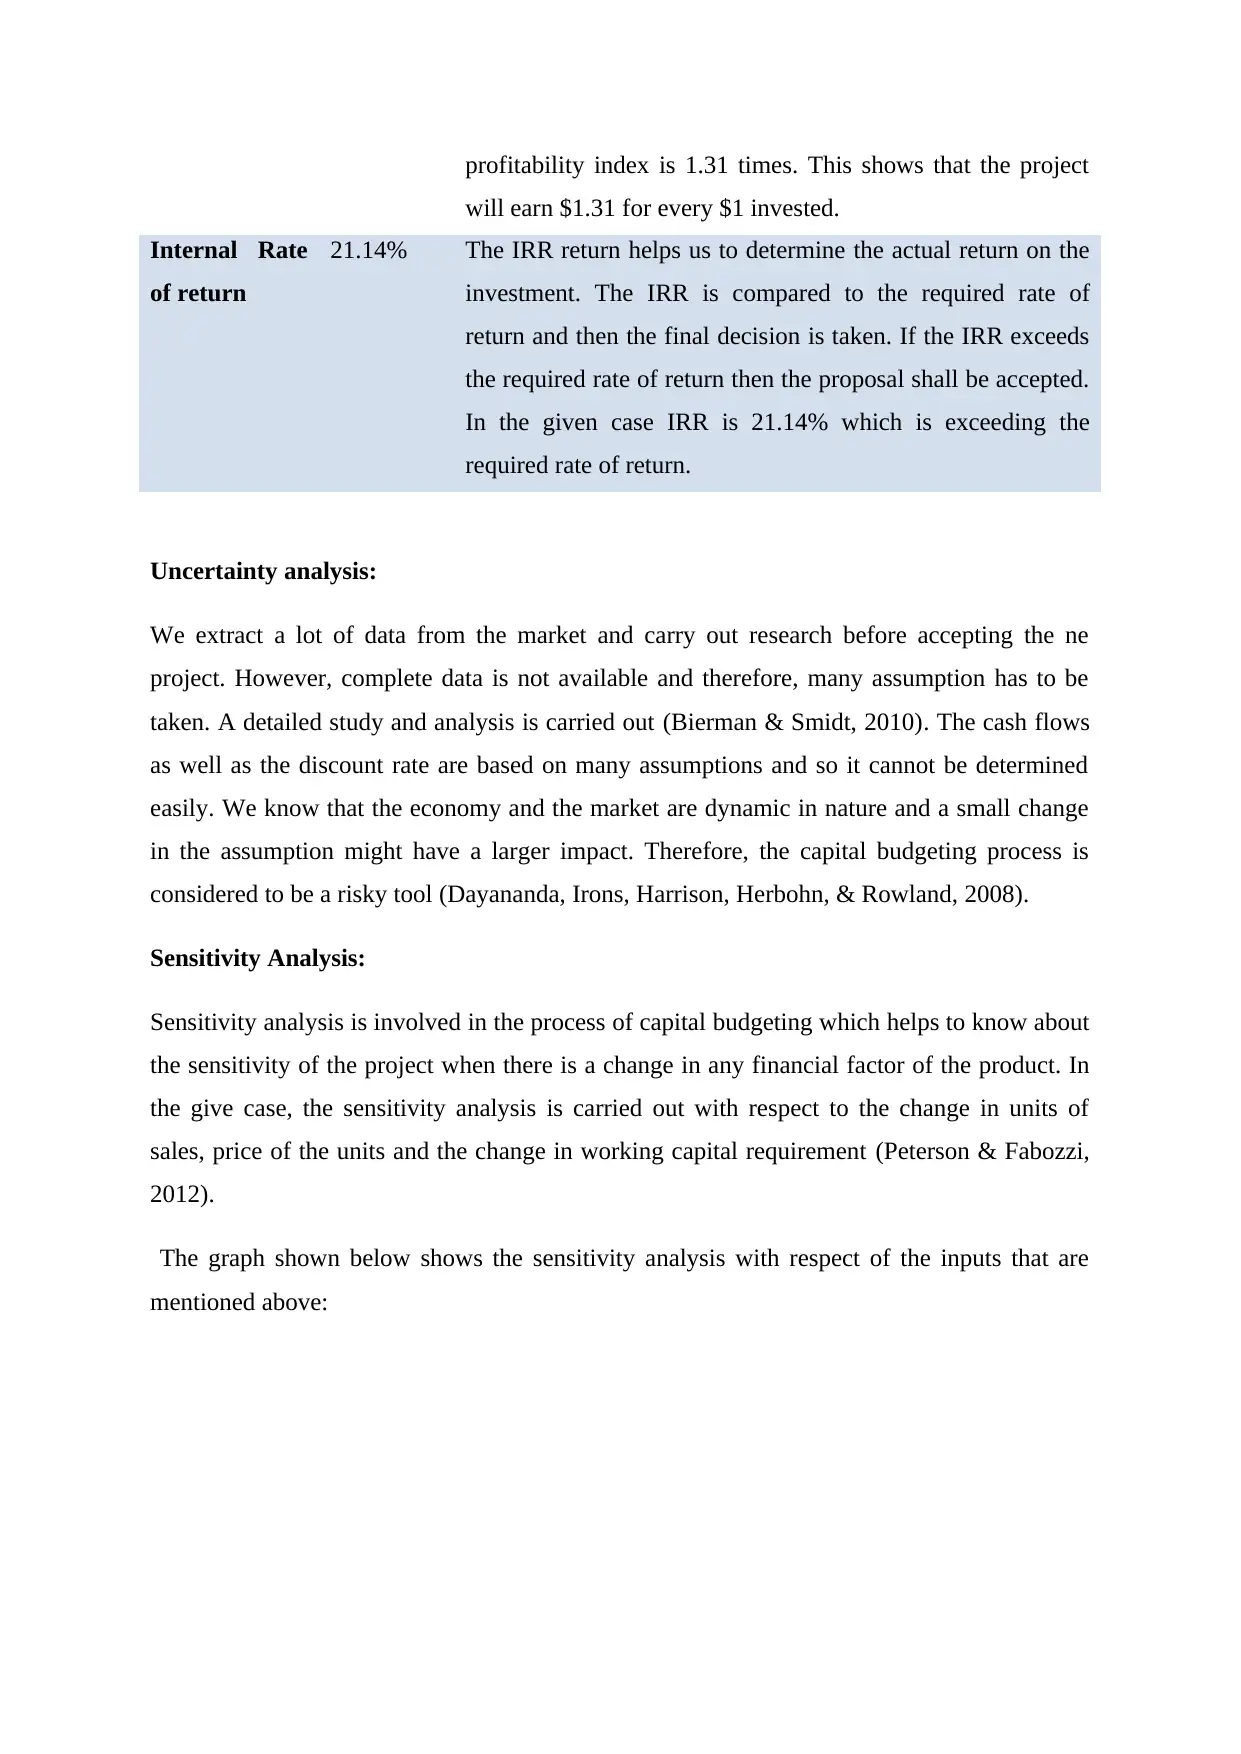
Internal Rate
of return
21.14% The IRR return helps us to determine the actual return on the
investment. The IRR is compared to the required rate of
return and then the final decision is taken. If the IRR exceeds
the required rate of return then the proposal shall be accepted.
In the given case IRR is 21.14% which is exceeding the
required rate of return.
Uncertainty analysis:
We extract a lot of data from the market and carry out research before accepting the ne
project. However, complete data is not available and therefore, many assumption has to be
taken. A detailed study and analysis is carried out (Bierman & Smidt, 2010). The cash flows
as well as the discount rate are based on many assumptions and so it cannot be determined
easily. We know that the economy and the market are dynamic in nature and a small change
in the assumption might have a larger impact. Therefore, the capital budgeting process is
considered to be a risky tool (Dayananda, Irons, Harrison, Herbohn, & Rowland, 2008).
Sensitivity Analysis:
Sensitivity analysis is involved in the process of capital budgeting which helps to know about
the sensitivity of the project when there is a change in any financial factor of the product. In
the give case, the sensitivity analysis is carried out with respect to the change in units of
sales, price of the units and the change in working capital requirement (Peterson & Fabozzi,
2012).
The graph shown below shows the sensitivity analysis with respect of the inputs that are
mentioned above:
will earn $1.31 for every $1 invested.
Internal Rate
of return
21.14% The IRR return helps us to determine the actual return on the
investment. The IRR is compared to the required rate of
return and then the final decision is taken. If the IRR exceeds
the required rate of return then the proposal shall be accepted.
In the given case IRR is 21.14% which is exceeding the
required rate of return.
Uncertainty analysis:
We extract a lot of data from the market and carry out research before accepting the ne
project. However, complete data is not available and therefore, many assumption has to be
taken. A detailed study and analysis is carried out (Bierman & Smidt, 2010). The cash flows
as well as the discount rate are based on many assumptions and so it cannot be determined
easily. We know that the economy and the market are dynamic in nature and a small change
in the assumption might have a larger impact. Therefore, the capital budgeting process is
considered to be a risky tool (Dayananda, Irons, Harrison, Herbohn, & Rowland, 2008).
Sensitivity Analysis:
Sensitivity analysis is involved in the process of capital budgeting which helps to know about
the sensitivity of the project when there is a change in any financial factor of the product. In
the give case, the sensitivity analysis is carried out with respect to the change in units of
sales, price of the units and the change in working capital requirement (Peterson & Fabozzi,
2012).
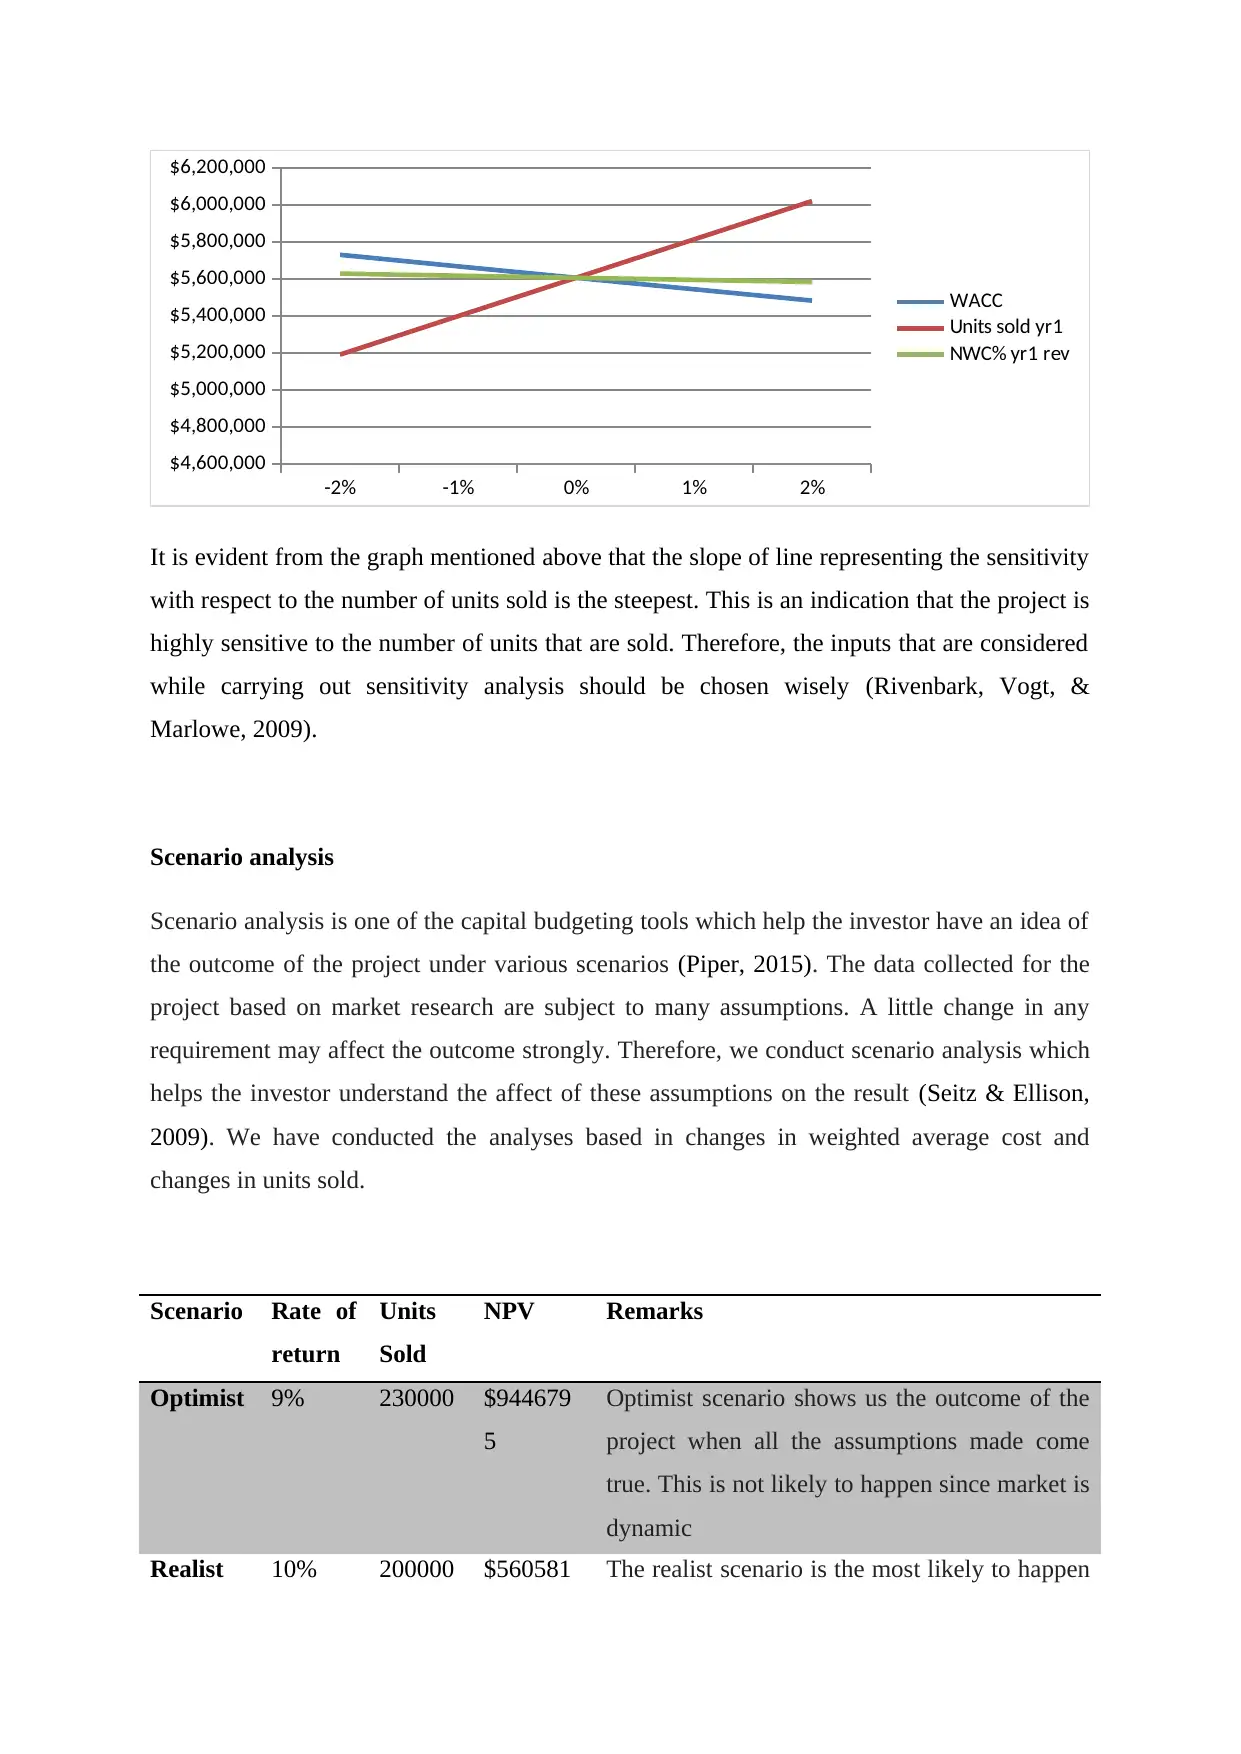
The graph shown below shows the sensitivity analysis with respect of the inputs that are
mentioned above:
-2% -1% 0% 1% 2%
$4,600,000
$4,800,000
$5,000,000
$5,200,000
$5,400,000
$5,600,000
$5,800,000
$6,000,000
$6,200,000
WACC
Units sold yr1
NWC% yr1 rev
It is evident from the graph mentioned above that the slope of line representing the sensitivity
with respect to the number of units sold is the steepest. This is an indication that the project is
highly sensitive to the number of units that are sold. Therefore, the inputs that are considered
while carrying out sensitivity analysis should be chosen wisely (Rivenbark, Vogt, &
Marlowe, 2009).
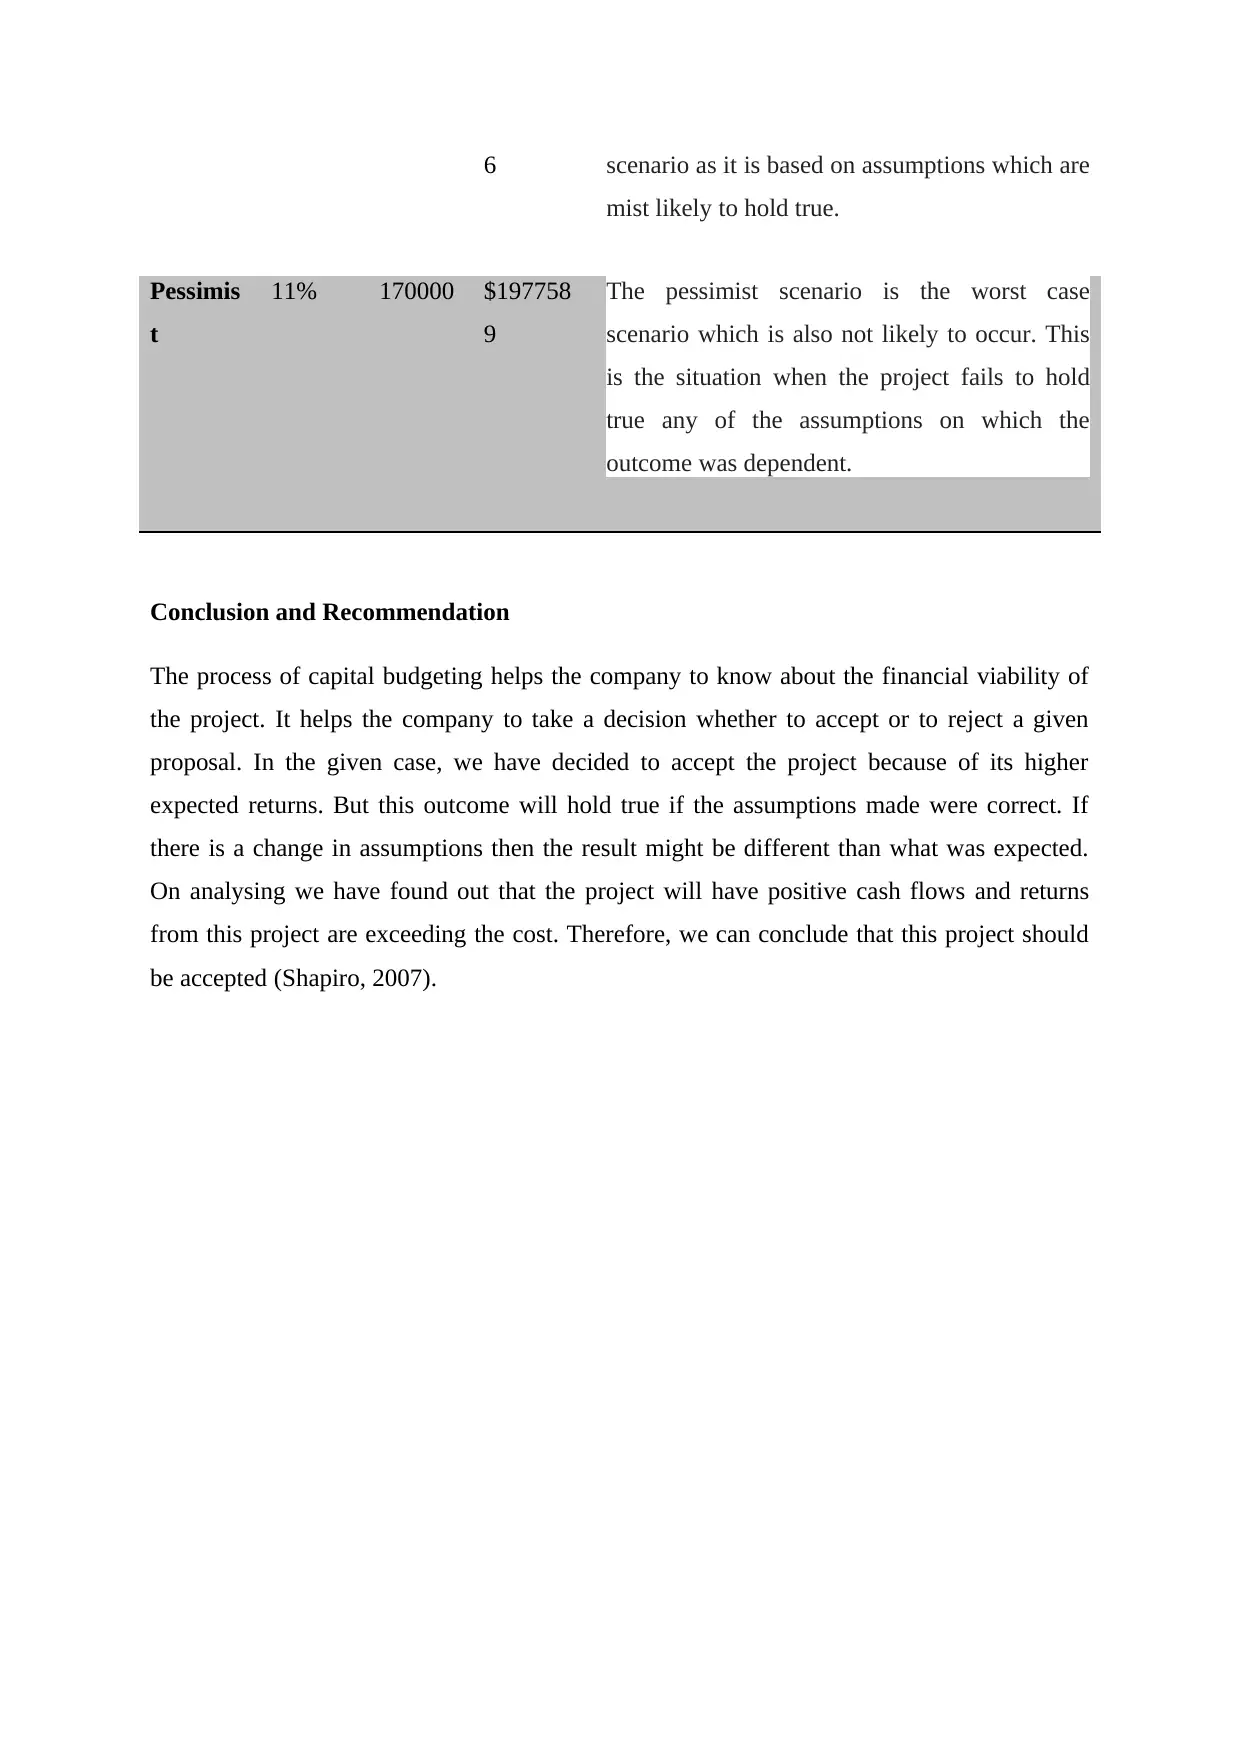
Scenario analysis
Scenario analysis is one of the capital budgeting tools which help the investor have an idea of
the outcome of the project under various scenarios (Piper, 2015). The data collected for the
project based on market research are subject to many assumptions. A little change in any
requirement may affect the outcome strongly. Therefore, we conduct scenario analysis which
helps the investor understand the affect of these assumptions on the result (Seitz & Ellison,
2009). We have conducted the analyses based in changes in weighted average cost and
changes in units sold.
Scenario Rate of
return
Units
Sold
NPV Remarks
Optimist 9% 230000 $944679
5
Optimist scenario shows us the outcome of the
project when all the assumptions made come
true. This is not likely to happen since market is
dynamic
Realist 10% 200000 $560581 The realist scenario is the most likely to happen
$4,600,000
$4,800,000
$5,000,000
$5,200,000
$5,400,000
$5,600,000
$5,800,000
$6,000,000
$6,200,000
WACC
Units sold yr1
NWC% yr1 rev
It is evident from the graph mentioned above that the slope of line representing the sensitivity
with respect to the number of units sold is the steepest. This is an indication that the project is
highly sensitive to the number of units that are sold. Therefore, the inputs that are considered
while carrying out sensitivity analysis should be chosen wisely (Rivenbark, Vogt, &
Marlowe, 2009).
Scenario analysis
Scenario analysis is one of the capital budgeting tools which help the investor have an idea of
the outcome of the project under various scenarios (Piper, 2015). The data collected for the
project based on market research are subject to many assumptions. A little change in any
requirement may affect the outcome strongly. Therefore, we conduct scenario analysis which
helps the investor understand the affect of these assumptions on the result (Seitz & Ellison,
2009). We have conducted the analyses based in changes in weighted average cost and
changes in units sold.
Scenario Rate of
return
Units
Sold
NPV Remarks
Optimist 9% 230000 $944679
5
Optimist scenario shows us the outcome of the
project when all the assumptions made come
true. This is not likely to happen since market is
dynamic
Realist 10% 200000 $560581 The realist scenario is the most likely to happen
Secure Best Marks with AI Grader
Need help grading? Try our AI Grader for instant feedback on your assignments.
6 scenario as it is based on assumptions which are
mist likely to hold true.
Pessimis
t
11% 170000 $197758
9
The pessimist scenario is the worst case
scenario which is also not likely to occur. This
is the situation when the project fails to hold
true any of the assumptions on which the
outcome was dependent.
Conclusion and Recommendation
The process of capital budgeting helps the company to know about the financial viability of
the project. It helps the company to take a decision whether to accept or to reject a given
proposal. In the given case, we have decided to accept the project because of its higher
expected returns. But this outcome will hold true if the assumptions made were correct. If
there is a change in assumptions then the result might be different than what was expected.
On analysing we have found out that the project will have positive cash flows and returns
from this project are exceeding the cost. Therefore, we can conclude that this project should
be accepted (Shapiro, 2007).
Bibliography
Adelaja, T. (2015). Capital Budgeting: Investment Appraisal Techniques Under Certainty.
Chicago: CreateSpace Independent Publishing Platform .
Bierman, H., & Smidt, S. (2010). The Capital Budgeting Decision. Boston: Routledge.
Dayananda, D., Irons, R., Harrison, S., Herbohn, J., & Rowland, P. (2008). Capital
Budgeting: Financial Appraisal of Investment Projects. Cambridge: Cambridge University
Press.
Peterson, P. P., & Fabozzi, F. J. (2012). Capital Budgeting. New York, NY: Wiley.
Piper, M. (2015). Accounting made simple. United States: CreateSpace Pub.
Rivenbark, W. C., Vogt, J., & Marlowe, J. (2009). Capital Budgeting and Finance: A Guide
for Local Governments. Washington, D.C.: ICMA Press.
Seitz, N., & Ellison, M. (2009). Capital Budgeting and Long-Term Financing Decisions.
New York: Thomson Learning.
Shapiro, A. C. (2007). Capital Budgeting and Investment Analysis. New Jersey: Wiley.
1 out of 6
Related Documents


Your All-in-One AI-Powered Toolkit for Academic Success.
+13062052269
info@desklib.com
Available 24*7 on WhatsApp / Email
![[object Object]](/_next/static/media/star-bottom.7253800d.svg)
Unlock your academic potential
© 2024 | Zucol Services PVT LTD | All rights reserved.