ACC1110 Financial Accounting: Working Capital Analysis Report

Verified

Added on  2022/08/23

|8
|1011
|18
Report
AI Summary
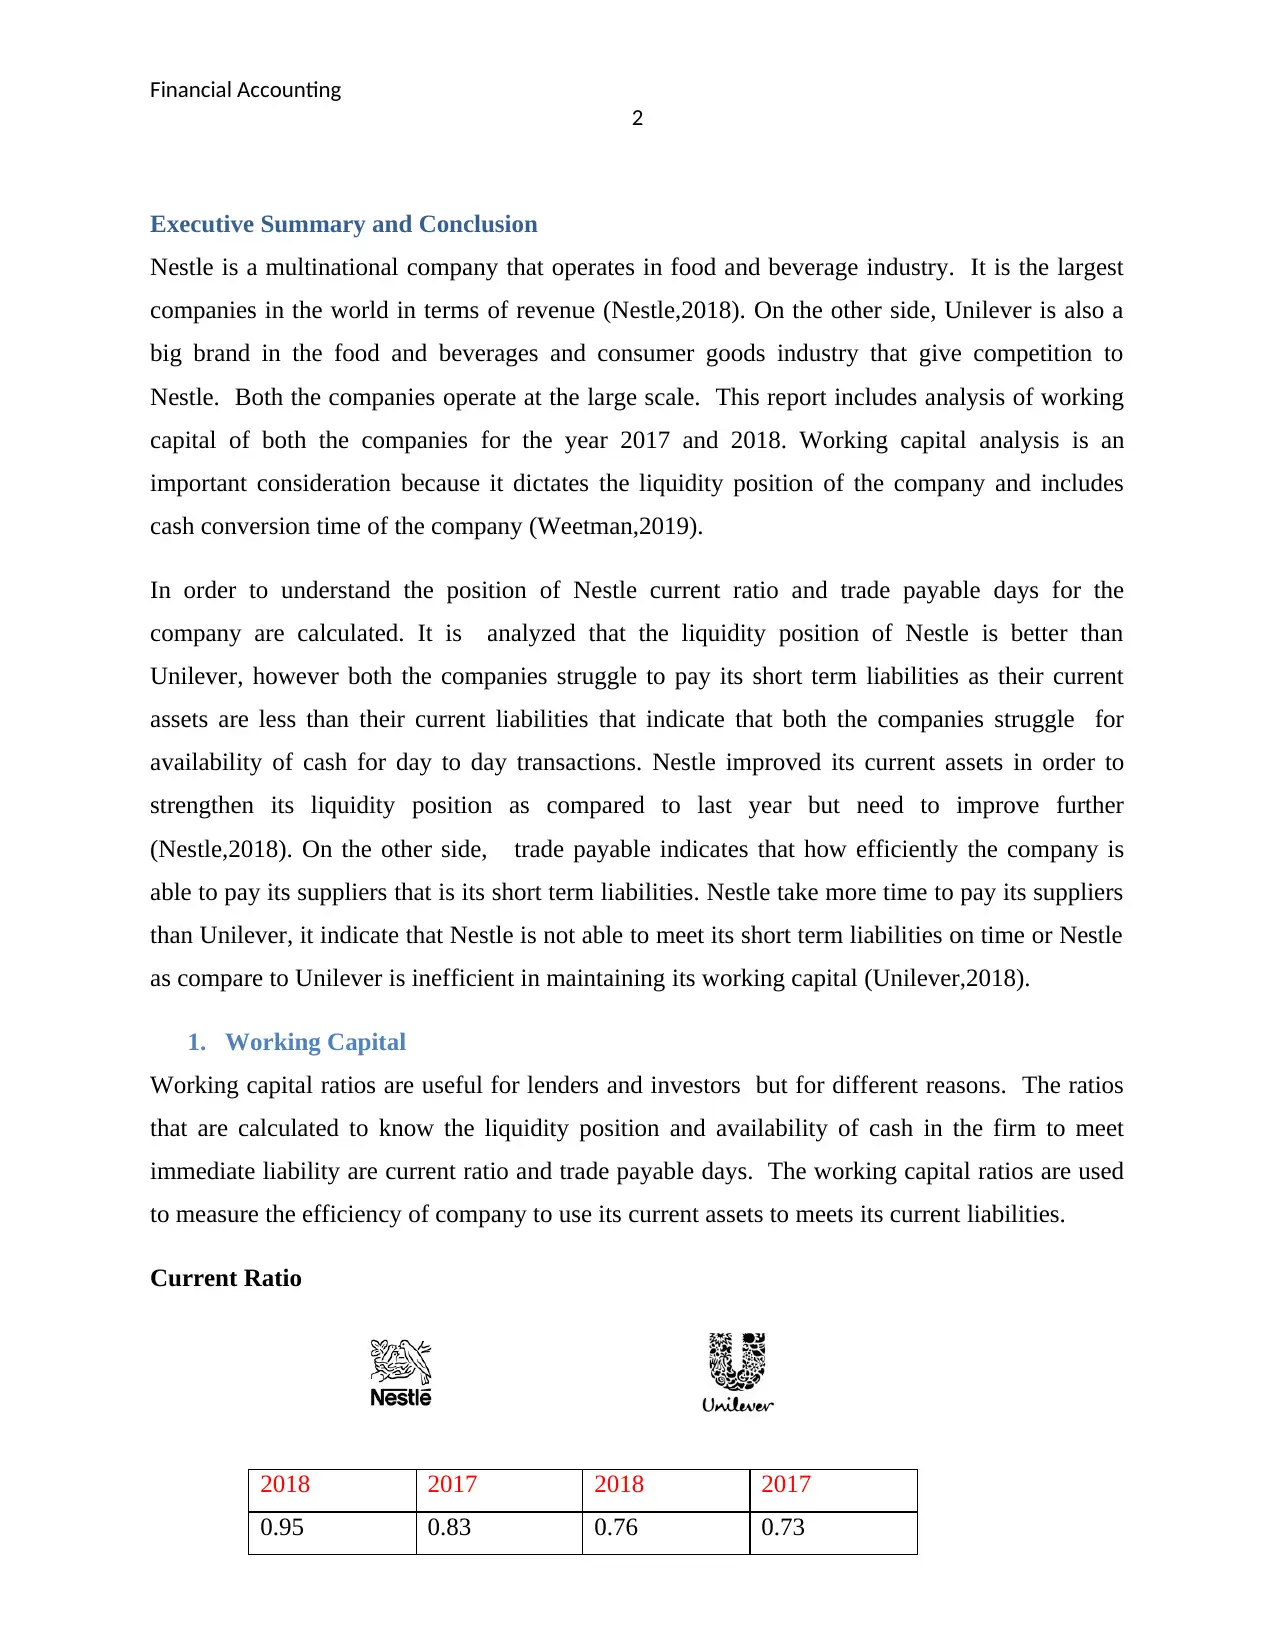
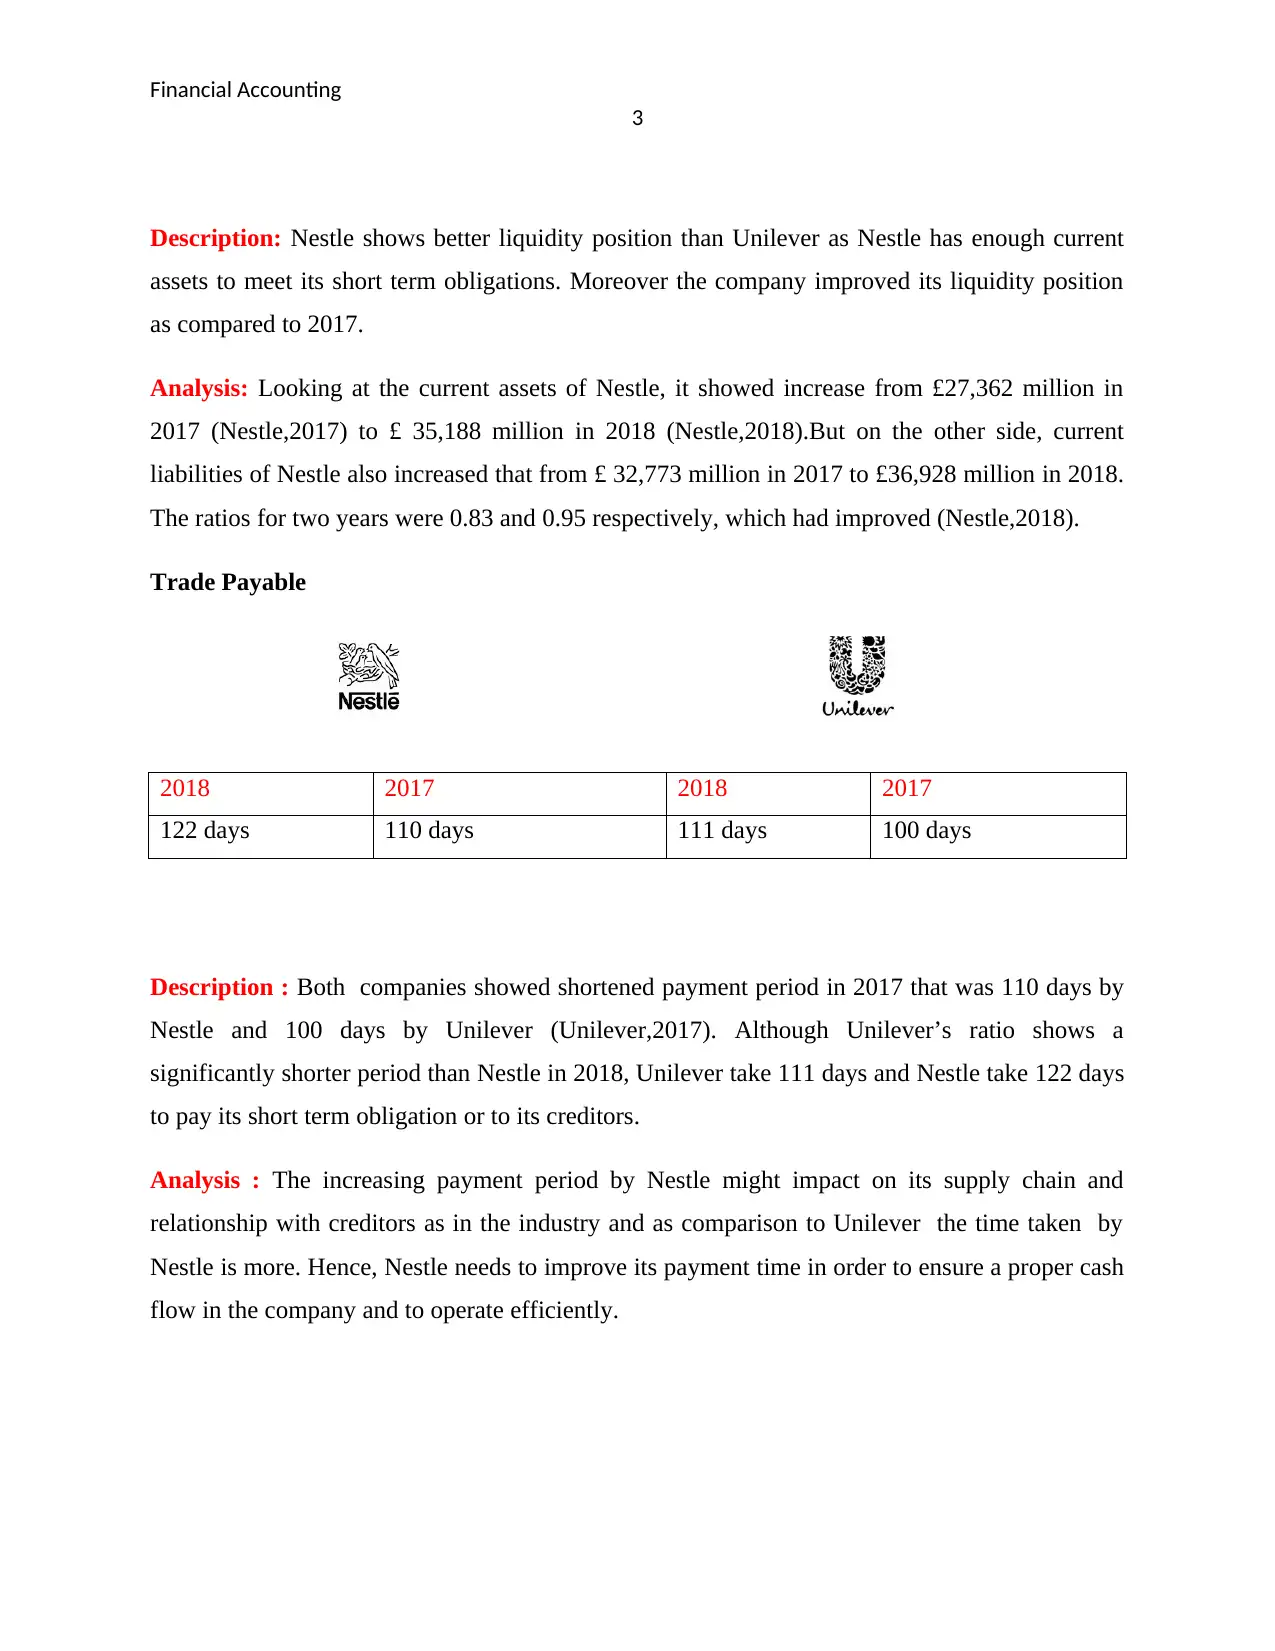
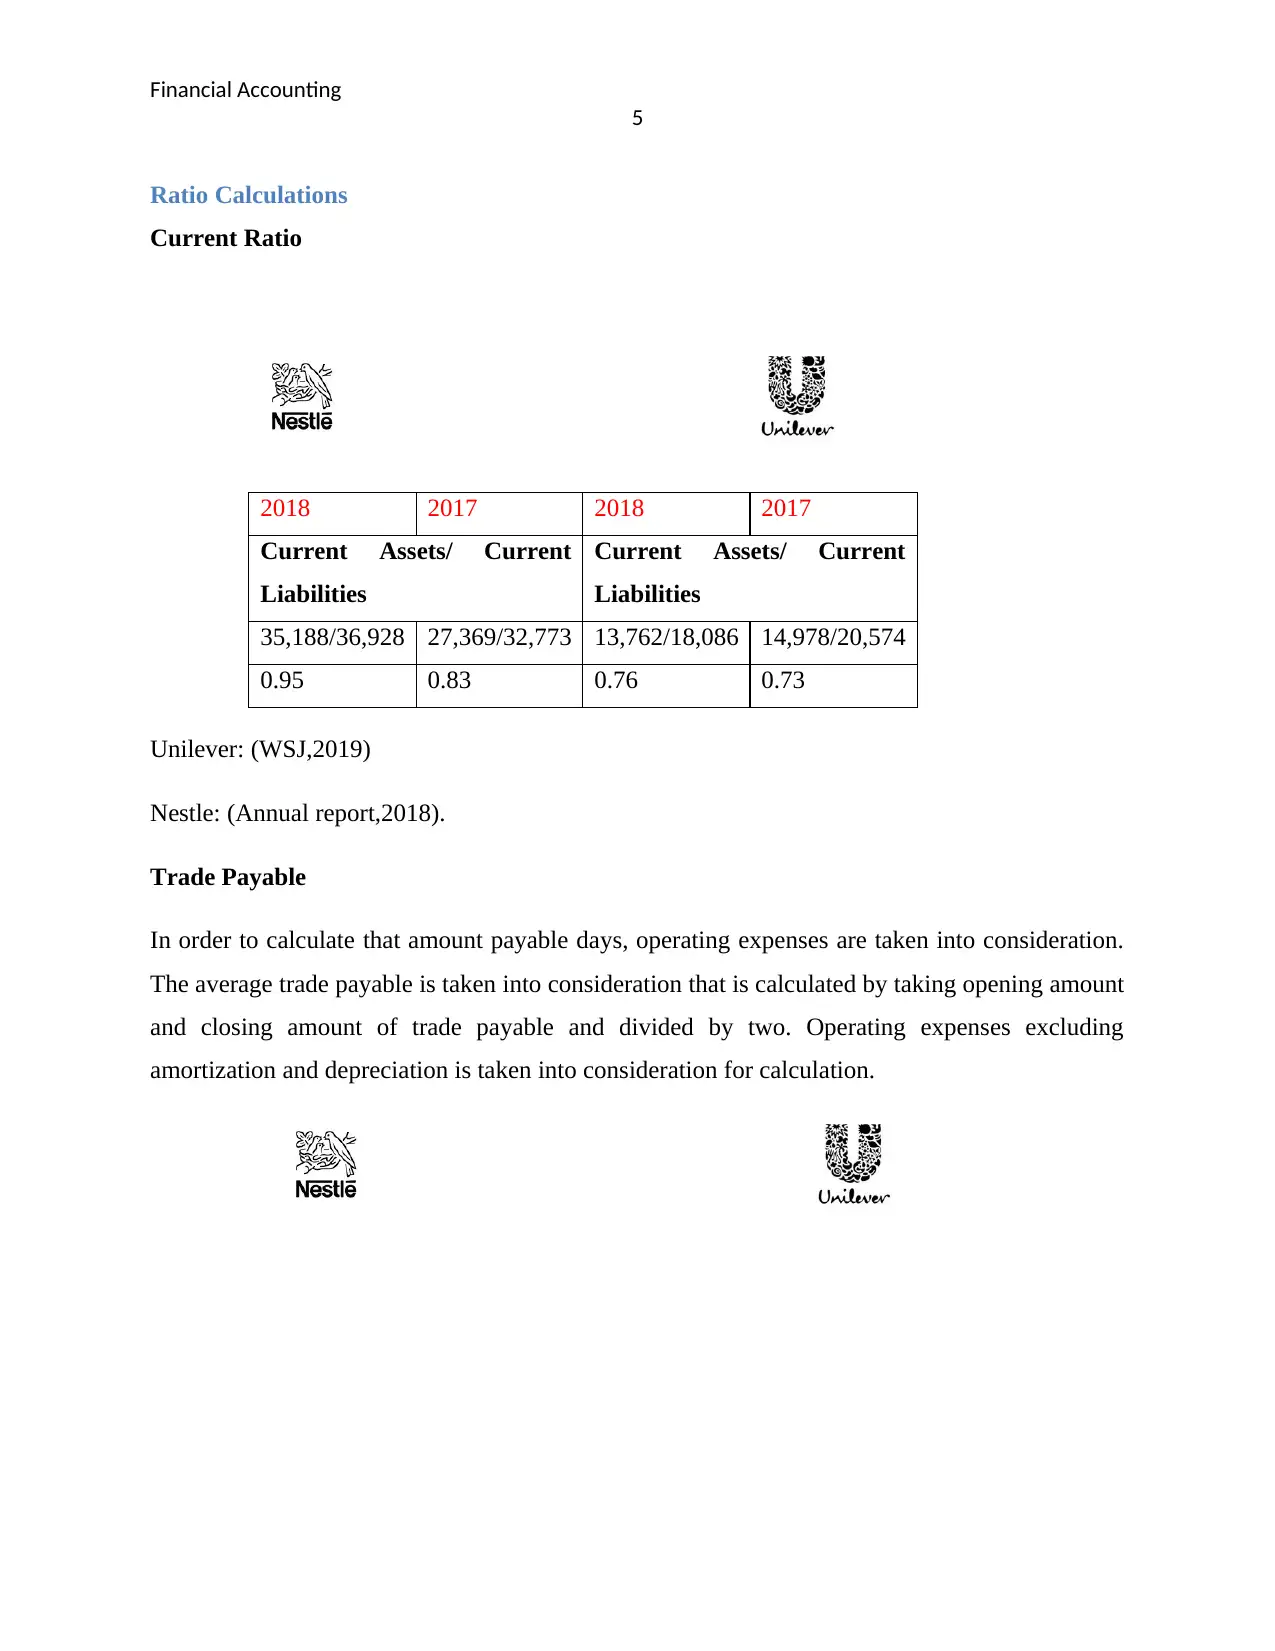
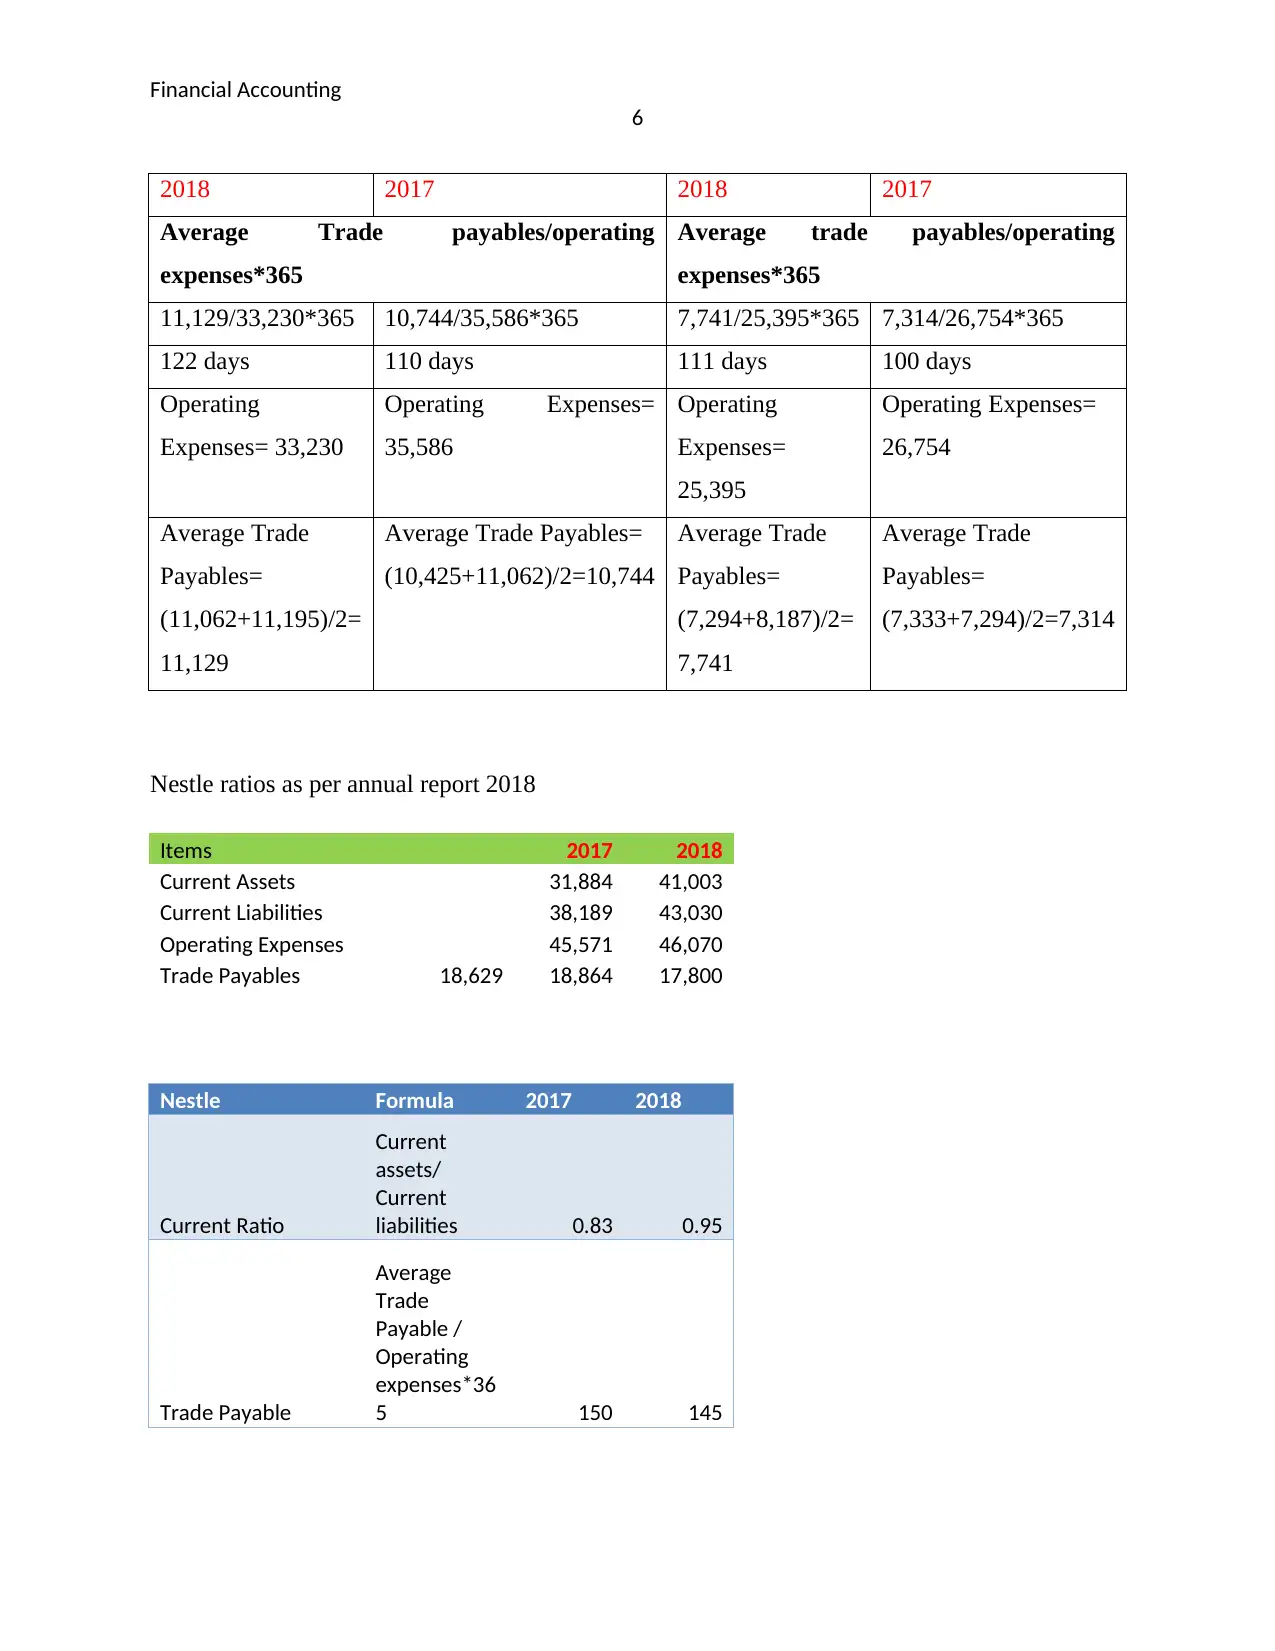
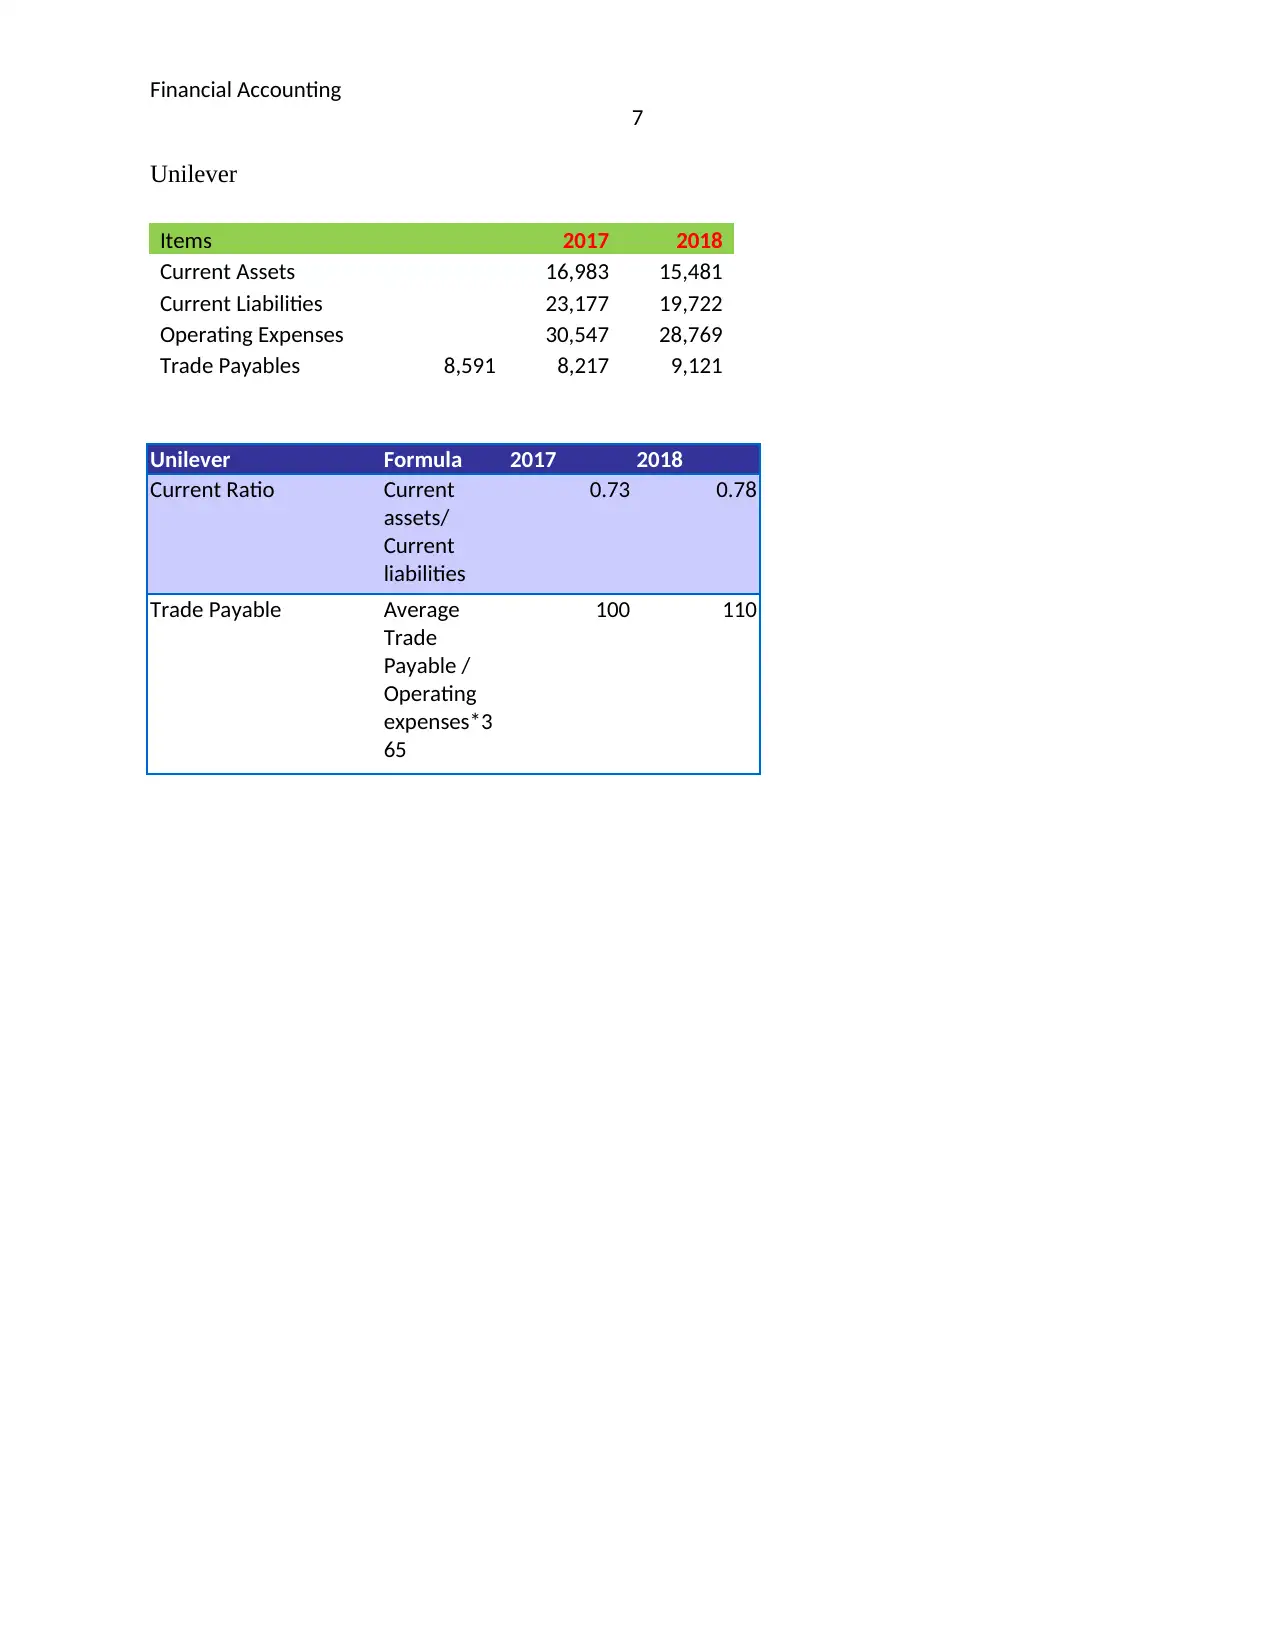
This financial accounting report analyzes the working capital of Nestle and Unilever for the years 2017 and 2018. The report focuses on key metrics such as current ratios and trade payable days to assess the liquidity positions of both companies. The analysis reveals that Nestle generally demonstrates a better liquidity position than Unilever, although both companies face challenges in meeting short-term liabilities. The report examines the trends in current assets, current liabilities, and trade payables, providing insights into the efficiency of working capital management. The report also includes ratio calculations and references to annual reports, offering a comprehensive overview of the financial performance of both companies. The report highlights areas where Nestle could improve its payment time to maintain a healthy cash flow and strengthen its relationships with creditors.
Document Page
RUNNING HEAD: FINANCIAL ACCOUNTING
0
Financial Accounting
tabler-icon-diamond-filled.svg

Secure Best Marks with AI Grader

Need help grading? Try our AI Grader for instant feedback on your assignments.
Document Page
Financial Accounting
1
Table of Contents
Executive Summary and Conclusion...............................................................................................2
1. Working Capital....................................................................................................................2
Appendices......................................................................................................................................5
References....................................................................................................................................5
Ratio Calculations........................................................................................................................6
Document Page
Financial Accounting
2
Executive Summary and Conclusion
Nestle is a multinational company that operates in food and beverage industry. It is the largest
companies in the world in terms of revenue (Nestle,2018). On the other side, Unilever is also a
big brand in the food and beverages and consumer goods industry that give competition to
Nestle. Both the companies operate at the large scale. This report includes analysis of working
capital of both the companies for the year 2017 and 2018. Working capital analysis is an
important consideration because it dictates the liquidity position of the company and includes
cash conversion time of the company (Weetman,2019).
In order to understand the position of Nestle current ratio and trade payable days for the
company are calculated. It is analyzed that the liquidity position of Nestle is better than
Unilever, however both the companies struggle to pay its short term liabilities as their current
assets are less than their current liabilities that indicate that both the companies struggle for
availability of cash for day to day transactions. Nestle improved its current assets in order to
strengthen its liquidity position as compared to last year but need to improve further
(Nestle,2018). On the other side, trade payable indicates that how efficiently the company is
able to pay its suppliers that is its short term liabilities. Nestle take more time to pay its suppliers
than Unilever, it indicate that Nestle is not able to meet its short term liabilities on time or Nestle
as compare to Unilever is inefficient in maintaining its working capital (Unilever,2018).
1. Working Capital
Working capital ratios are useful for lenders and investors but for different reasons. The ratios
that are calculated to know the liquidity position and availability of cash in the firm to meet
immediate liability are current ratio and trade payable days. The working capital ratios are used
to measure the efficiency of company to use its current assets to meets its current liabilities.
Current Ratio
2018 2017 2018 2017
0.95 0.83 0.76 0.73
Document Page
Financial Accounting
3
Description: Nestle shows better liquidity position than Unilever as Nestle has enough current
assets to meet its short term obligations. Moreover the company improved its liquidity position
as compared to 2017.
Analysis: Looking at the current assets of Nestle, it showed increase from £27,362 million in
2017 (Nestle,2017) to £ 35,188 million in 2018 (Nestle,2018).But on the other side, current
liabilities of Nestle also increased that from £ 32,773 million in 2017 to £36,928 million in 2018.
The ratios for two years were 0.83 and 0.95 respectively, which had improved (Nestle,2018).
Trade Payable
Description : Both companies showed shortened payment period in 2017 that was 110 days by
Nestle and 100 days by Unilever (Unilever,2017). Although Unilever’s ratio shows a
significantly shorter period than Nestle in 2018, Unilever take 111 days and Nestle take 122 days
to pay its short term obligation or to its creditors.
Analysis : The increasing payment period by Nestle might impact on its supply chain and
relationship with creditors as in the industry and as comparison to Unilever the time taken by
Nestle is more. Hence, Nestle needs to improve its payment time in order to ensure a proper cash
flow in the company and to operate efficiently.
2018 2017 2018 2017
122 days 110 days 111 days 100 days
tabler-icon-diamond-filled.svg

Secure Best Marks with AI Grader

Need help grading? Try our AI Grader for instant feedback on your assignments.
Document Page
Financial Accounting
4
Appendices
References
Nestle, 2018. Annual Report 2018. Available at: https://www.nestle.com/sites/default/files/asset-
library/documents/library/documents/annual_reports/2018-annual-review-en.pdf (Accessed on
16 March 2020)
Nestle,2017. Annual Report 2017. Available at:
https://www.nestle.com/investors/investorstories/annual-report-2017 (Accessed on 16 March
2020)
Unilever,2017. Annual Report 2017. Available at: https://www.unilever.com/Images/unilever-
annual-report-and-accounts-2017_tcm244-516456_en.pdf (Accessed on 16 March 2020)
Unilever,2018. Annual Report 2018. Available at: https://www.unilever.com/Images/unilever-
annual-report-and-accounts-2018_tcm244-534881_en.pdf (Accessed on 16 March 2020)
WSJ,2019. Financial Statement 2019. Available at:
https://www.wsj.com/market-data/quotes/UK/ULVR/financials/annual/balance-sheet (Accessed
on 16 March 2020)
Weetman, P., 2019. Financial and management accounting. Pearson UK.
Document Page
Financial Accounting
5
Ratio Calculations
Current Ratio
Unilever: (WSJ,2019)
Nestle: (Annual report,2018).
Trade Payable
In order to calculate that amount payable days, operating expenses are taken into consideration.
The average trade payable is taken into consideration that is calculated by taking opening amount
and closing amount of trade payable and divided by two. Operating expenses excluding
amortization and depreciation is taken into consideration for calculation.
2018 2017 2018 2017
Current Assets/ Current
Liabilities
Current Assets/ Current
Liabilities
35,188/36,928 27,369/32,773 13,762/18,086 14,978/20,574
0.95 0.83 0.76 0.73
Document Page
Financial Accounting
6
Nestle ratios as per annual report 2018
Items 2017 2018
Current Assets 31,884 41,003
Current Liabilities 38,189 43,030
Operating Expenses 45,571 46,070
Trade Payables 18,629 18,864 17,800
Nestle Formula 2017 2018
Current Ratio
Current
assets/
Current
liabilities 0.83 0.95
Trade Payable
Average
Trade
Payable /
Operating
expenses*36
5 150 145
2018 2017 2018 2017
Average Trade payables/operating
expenses*365
Average trade payables/operating
expenses*365
11,129/33,230*365 10,744/35,586*365 7,741/25,395*365 7,314/26,754*365
122 days 110 days 111 days 100 days
Operating
Expenses= 33,230
Operating Expenses=
35,586
Operating
Expenses=
25,395
Operating Expenses=
26,754
Average Trade
Payables=
(11,062+11,195)/2=
11,129
Average Trade Payables=
(10,425+11,062)/2=10,744
Average Trade
Payables=
(7,294+8,187)/2=
7,741
Average Trade
Payables=
(7,333+7,294)/2=7,314
tabler-icon-diamond-filled.svg

Paraphrase This Document

Need a fresh take? Get an instant paraphrase of this document with our AI Paraphraser
Document Page
Financial Accounting
7
Unilever
Items 2017 2018
Current Assets 16,983 15,481
Current Liabilities 23,177 19,722
Operating Expenses 30,547 28,769
Trade Payables 8,591 8,217 9,121
Unilever Formula 2017 2018
Current Ratio Current
assets/
Current
liabilities
0.73 0.78
Trade Payable Average
Trade
Payable /
Operating
expenses*3
65
100 110
chevron_up_icon
1 out of 8
circle_padding
hide_on_mobile
zoom_out_icon
logo.png

Your All-in-One AI-Powered Toolkit for Academic Success.

Available 24*7 on WhatsApp / Email

[object Object]