University Financial Analysis Project Report: Telstra Valuation
VerifiedAdded on 2023/03/30
|8
|1085
|454
Report
AI Summary
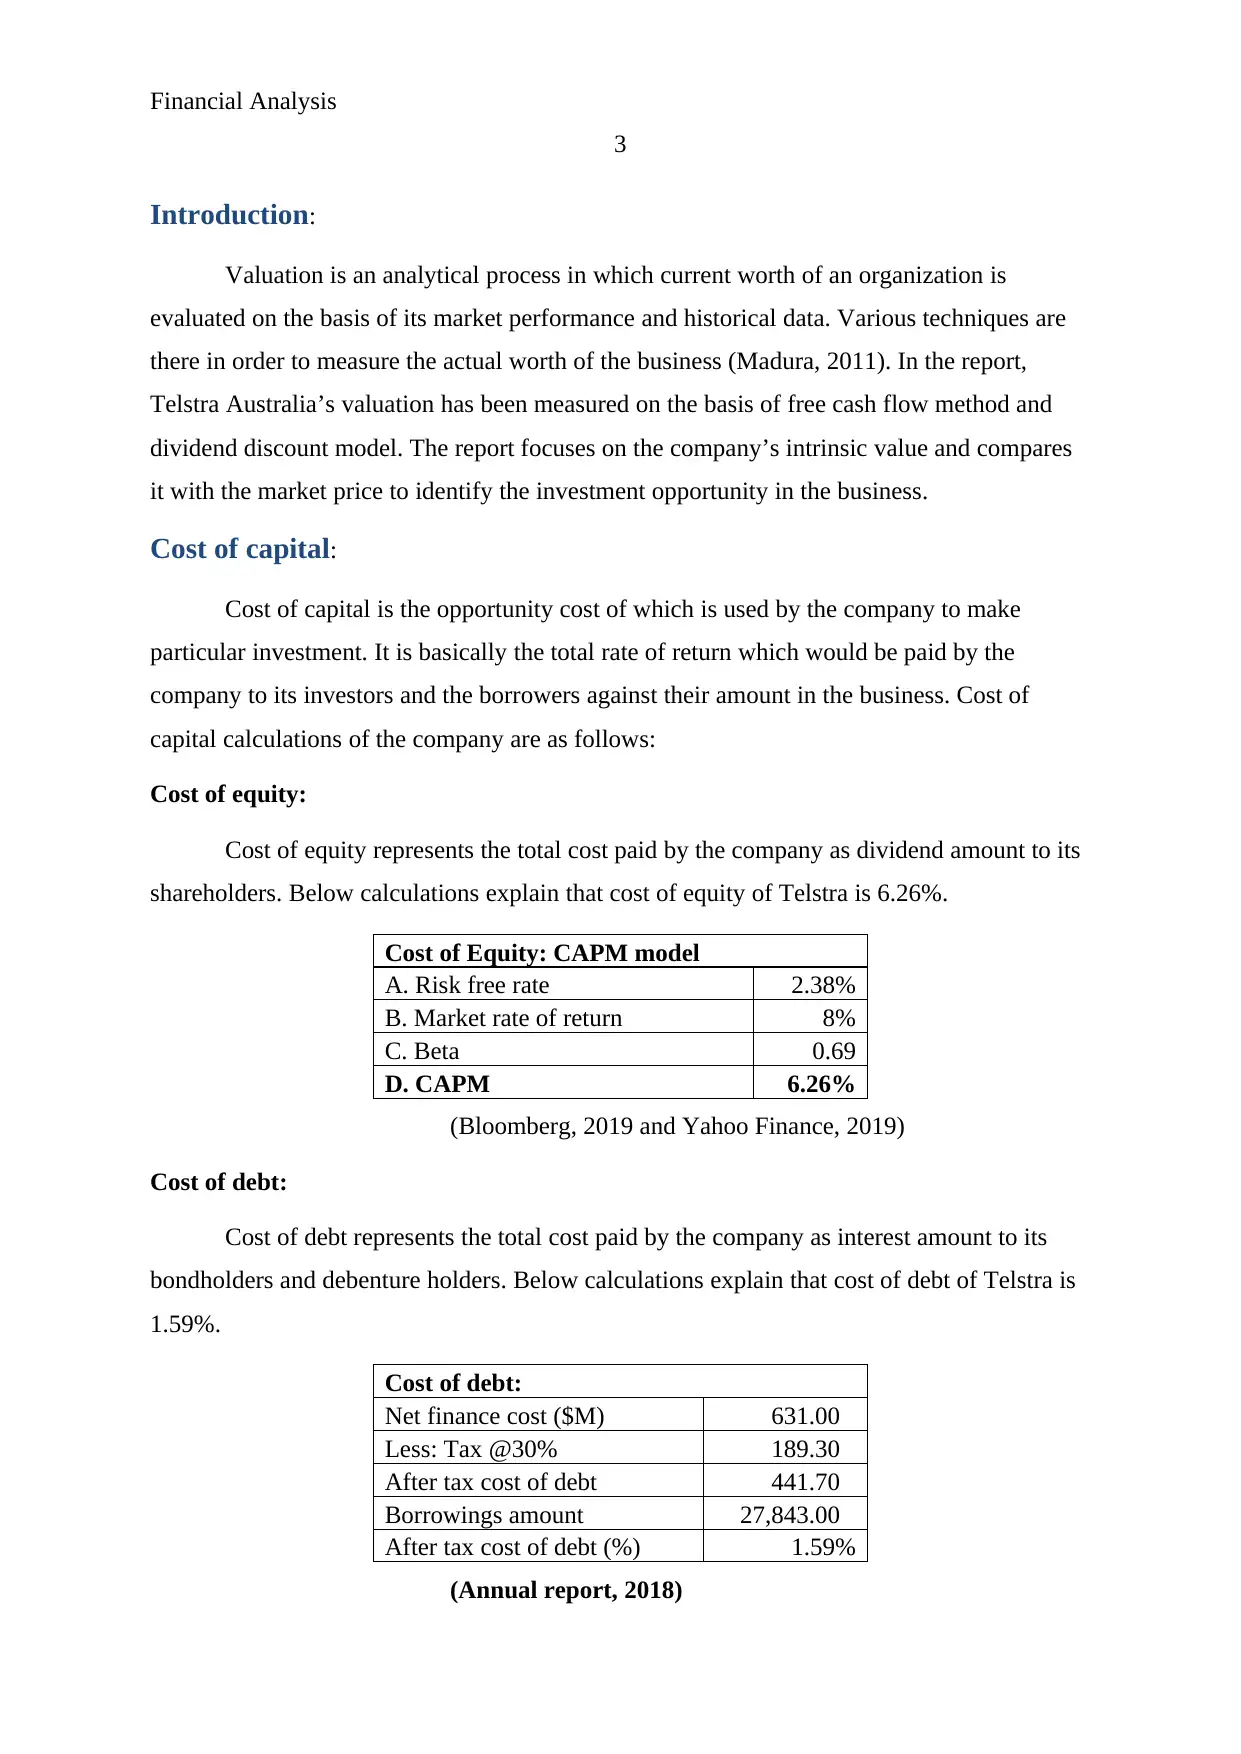
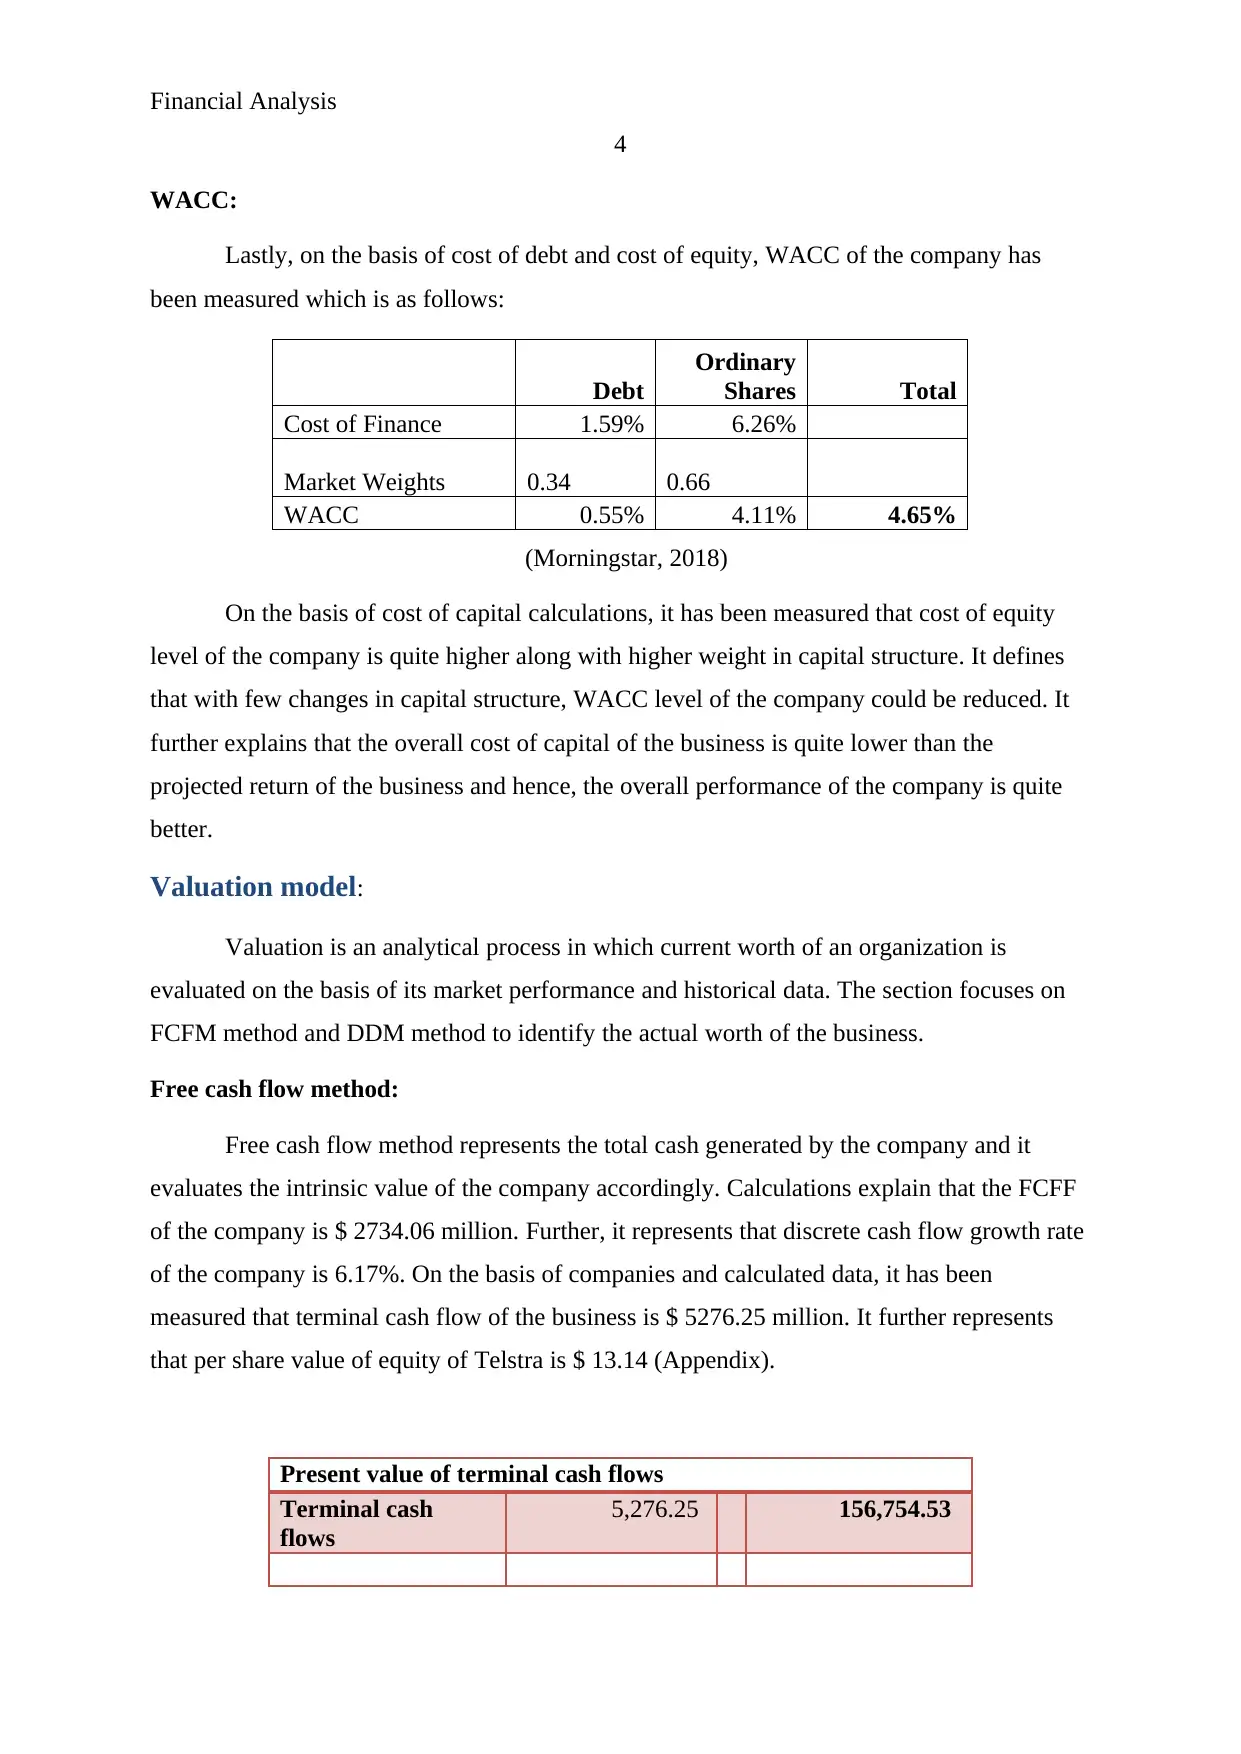
This report presents a financial analysis of Telstra, focusing on its valuation using two primary models: the Free Cash Flow Method (FCFM) and the Dividend Discount Model (DDM). The analysis begins with an introduction to valuation and its significance in determining a company's worth. It then calculates the cost of capital, including the cost of equity and cost of debt, and determines the Weighted Average Cost of Capital (WACC). The report then applies the FCFM and DDM to estimate the intrinsic value of Telstra's shares, comparing these values with the market price to identify potential investment opportunities. The diagnosis section compares the intrinsic value to the market price and provides investment recommendations. The report concludes with a summary of findings, suggesting a long-term investment in Telstra due to its undervalued stock price. References and an appendix with supporting calculations are included.


1 out of 8
Related Documents


Your All-in-One AI-Powered Toolkit for Academic Success.
+13062052269
info@desklib.com
Available 24*7 on WhatsApp / Email
![[object Object]](/_next/static/media/star-bottom.7253800d.svg)
Copyright © 2020–2025 A2Z Services. All Rights Reserved. Developed and managed by ZUCOL.