logo

Financial Analysis

Valuation flow chart, approaches to valuation, discounted dividends valuation, relative valuation, forecasting

8 Pages1085 Words454 Views
   

Added on  2023-03-30

About This Document

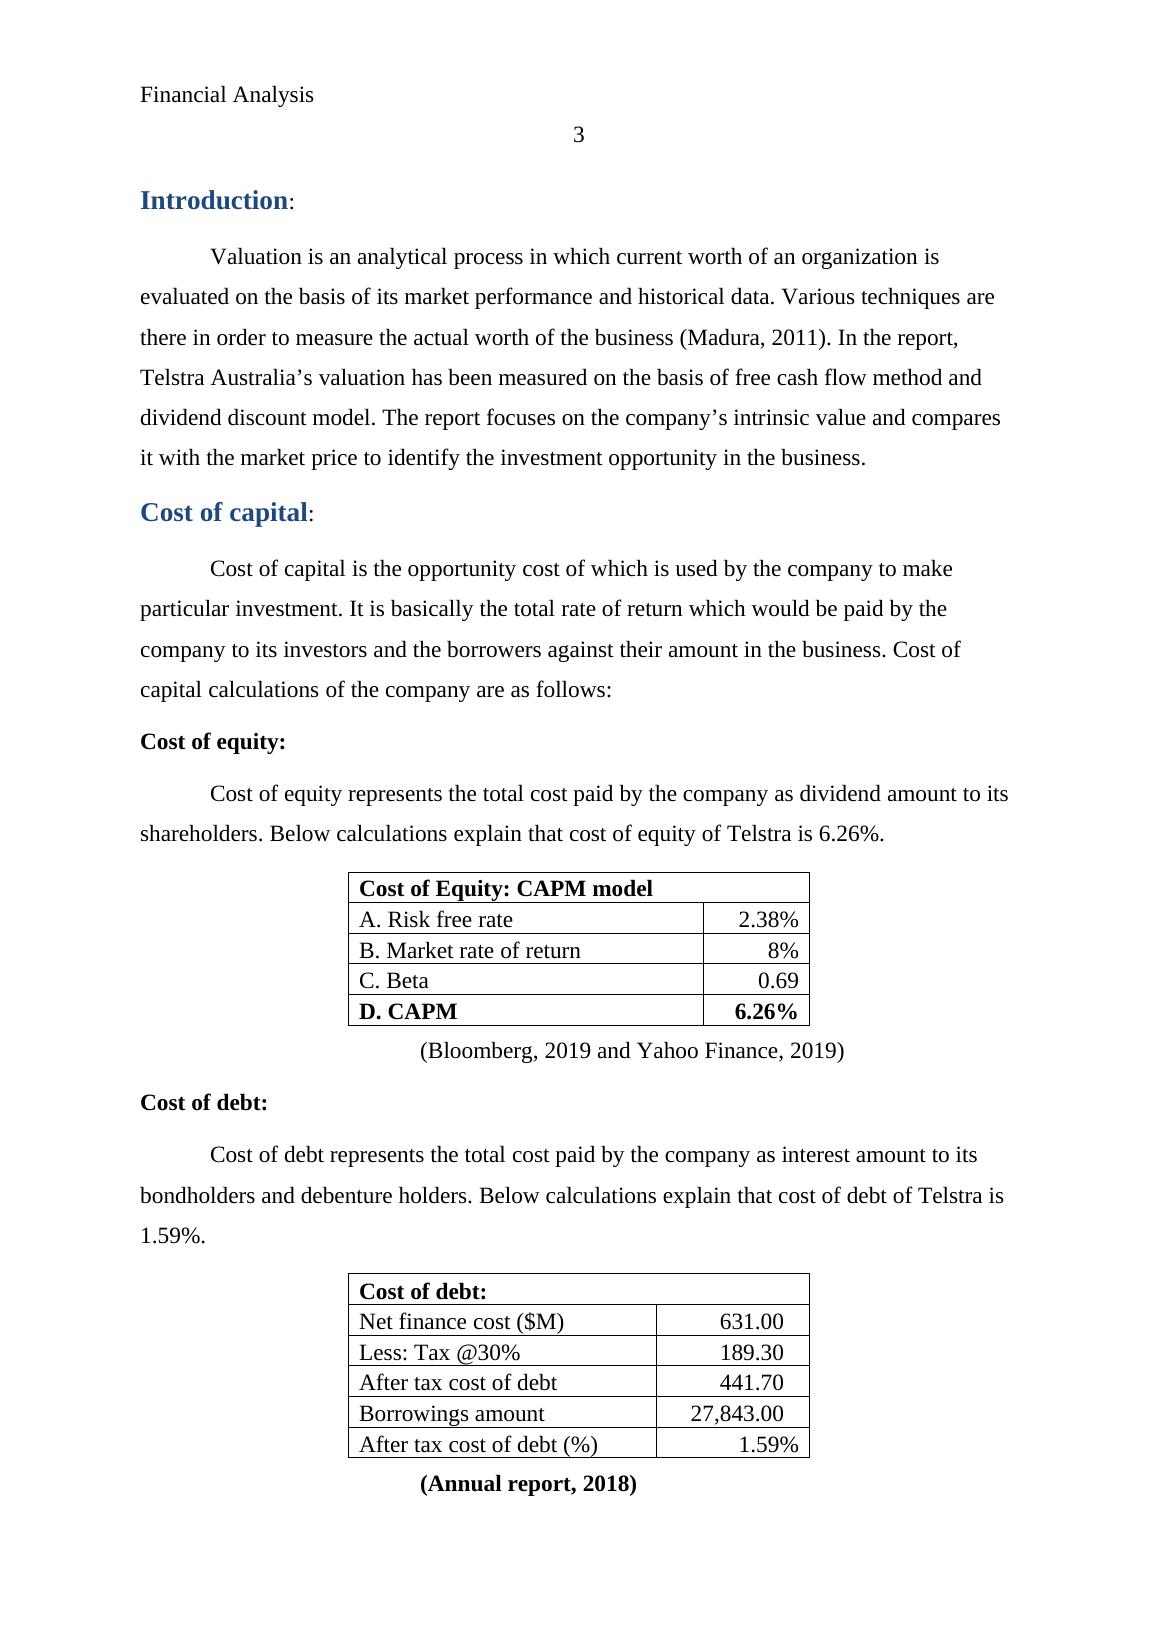
This report provides a financial analysis of Telstra Australia, including the valuation using free cash flow method and dividend discount model. It discusses the cost of capital, valuation model, diagnosis, and concludes with recommendations for investors.

Financial Analysis

Valuation flow chart, approaches to valuation, discounted dividends valuation, relative valuation, forecasting

   Added on 2023-03-30

ShareRelated Documents
Running Head: Financial Analysis
1
Project Report: Financial Analysis
Financial Analysis_1
Financial Analysis
2
Contents
Introduction.......................................................................................................................3
Cost of capital...................................................................................................................3
Valuation model................................................................................................................4
Diagnosis..........................................................................................................................5
Conclusion........................................................................................................................6
References.........................................................................................................................7
Appendix...........................................................................................................................8
Financial Analysis_2
Financial Analysis
3
Introduction:
Valuation is an analytical process in which current worth of an organization is
evaluated on the basis of its market performance and historical data. Various techniques are
there in order to measure the actual worth of the business (Madura, 2011). In the report,
Telstra Australia’s valuation has been measured on the basis of free cash flow method and
dividend discount model. The report focuses on the company’s intrinsic value and compares
it with the market price to identify the investment opportunity in the business.
Cost of capital:
Cost of capital is the opportunity cost of which is used by the company to make
particular investment. It is basically the total rate of return which would be paid by the
company to its investors and the borrowers against their amount in the business. Cost of
capital calculations of the company are as follows:
Cost of equity:
Cost of equity represents the total cost paid by the company as dividend amount to its
shareholders. Below calculations explain that cost of equity of Telstra is 6.26%.
Cost of Equity: CAPM model
A. Risk free rate 2.38%
B. Market rate of return 8%
C. Beta 0.69
D. CAPM 6.26%
(Bloomberg, 2019 and Yahoo Finance, 2019)
Cost of debt:
Cost of debt represents the total cost paid by the company as interest amount to its
bondholders and debenture holders. Below calculations explain that cost of debt of Telstra is
1.59%.
Cost of debt:
Net finance cost ($M) 631.00
Less: Tax @30% 189.30
After tax cost of debt 441.70
Borrowings amount 27,843.00
After tax cost of debt (%) 1.59%
(Annual report, 2018)
Financial Analysis_3

End of preview

Want to access all the pages? Upload your documents or become a member.

Related Documents
Application and Effect of Capital Budgeting
|11
|1700
|16

Determining Capital Structure and Weighted Average Cost of Capital (WACC)
|5
|1146
|111

Weighted Average Cost of Capital of the Hotel
|10
|1362
|128

Analysis of Parcel’s Limited
|10
|1547
|223

Financial Management in Organisation - Assignment
|13
|3537
|169

Proper Format of Financial Statements
|11
|1750
|133