Financial Analysis and Business Risk: Nestle Company Report
VerifiedAdded on 2022/08/16
|28
|5277
|15
Report
AI Summary
This report provides a comprehensive financial analysis of Nestle, a leading food and beverage company. It begins by calculating and interpreting key financial ratios, including profitability, liquidity, efficiency, and coverage ratios, for the years 2017 and 2018. The analysis delves into the importance and limitations of these ratios, offering insights into Nestle's financial health and performance. Furthermore, the report employs SWOT and Porter's Five Forces analyses to evaluate Nestle's strategic position within the industry, examining its strengths, weaknesses, opportunities, and threats, as well as the competitive forces shaping its market. Finally, the report addresses business risk, identifying various types of risks and outlining methods for their identification and mitigation, providing a holistic view of Nestle's financial and operational landscape.
Running head: FINANCIAL ANALYSIS AND BUSINESS RISK
FINANCIAL ANALYSIS AND BUSINESS RISK
Name of the Student
Name of the University
Author’s Note:
FINANCIAL ANALYSIS AND BUSINESS RISK
Name of the Student
Name of the University
Author’s Note:
Paraphrase This Document
Need a fresh take? Get an instant paraphrase of this document with our AI Paraphraser
1FINANCIAL ANALYSIS AND BUSINESS RISK
Executive Summary
The aim of the report is to calculate the required financial ratio of Nestle, one of the world’s
largest food and beverage providing Company and to conduct an overview of different financial
ratios such as Profitability, Liquidity, efficiency and coverage ratio of the respective organization
for the last two the financial year 2017 & 2018. The study also discusses the importance and
drawbacks of the selected ratios. Moreover, the report focuses on a comprehensive analysis of
the brand through the SWOT approach and Porter’s five forces approach. In addition, the report
covers the area related to the given study specifying the different types of business risks and how
it can be identified including the methods to mitigate those risks.
2FINANCIAL ANALYSIS AND BUSINESS RISK
Table of Contents
Introduction......................................................................................................................................4
Discussion........................................................................................................................................5
Answer 1(a).................................................................................................................................5
Profitability ratio......................................................................................................................5
Liquidity ratio..........................................................................................................................7
Activity ratio............................................................................................................................8
Coverage ratio........................................................................................................................10
Importance of selected ratios.................................................................................................11
Barriers of selected ratios......................................................................................................13
Answer 1(b)...............................................................................................................................14
SWOT Analysis of Nestle.....................................................................................................14
Porter’s Five Forces Analysis................................................................................................17
Answer 2(a)...............................................................................................................................18
Techniques used in identifying risks.....................................................................................18
Types of business risk............................................................................................................19
Answer 2(b)...............................................................................................................................20
Methods to moderate risks.....................................................................................................20
Conclusion.....................................................................................................................................22
⊘ This is a preview!⊘
Do you want full access?
Subscribe today to unlock all pages.
Trusted by 1+ million students worldwide
3FINANCIAL ANALYSIS AND BUSINESS RISK
References......................................................................................................................................23
Bibliography..................................................................................................................................25
Appendix........................................................................................................................................27
Paraphrase This Document
Need a fresh take? Get an instant paraphrase of this document with our AI Paraphraser
4FINANCIAL ANALYSIS AND BUSINESS RISK
Introduction
Nestle, incorporated in 1866, is one of the world’s largest food and beverage providing
brand whose headquarter is situated in Switzerland. In this report, different financial ratios such
as Profitability, Liquidity, efficiency and coverage ratio of the above-mentioned Company is
calculated for the last two financial year 2017 & 2018 taking the amounts from the annual report
of the Company. Ratios are crucial to make an idea about how an entity is performing are what
area need to be checked regarding improving its performance level. The importance and
drawbacks of the selected ratios have also been studied in the report and how they affect the
performance of the Company at a financial level. Moreover, the report focuses on a broad
analysis of the Nestle brand through SWOT approach and Porter’s five forces approach on the
basis of information availed from financial statement and reports of the Company. In addition,
the report deals with the area related to the given case study specifying the different types of
business risks and how the German Company can identify their main risk. Lastly, concerning
those identified risk different methods used by the organization to mitigate such risks are
evaluated in the report.
5FINANCIAL ANALYSIS AND BUSINESS RISK
Discussion
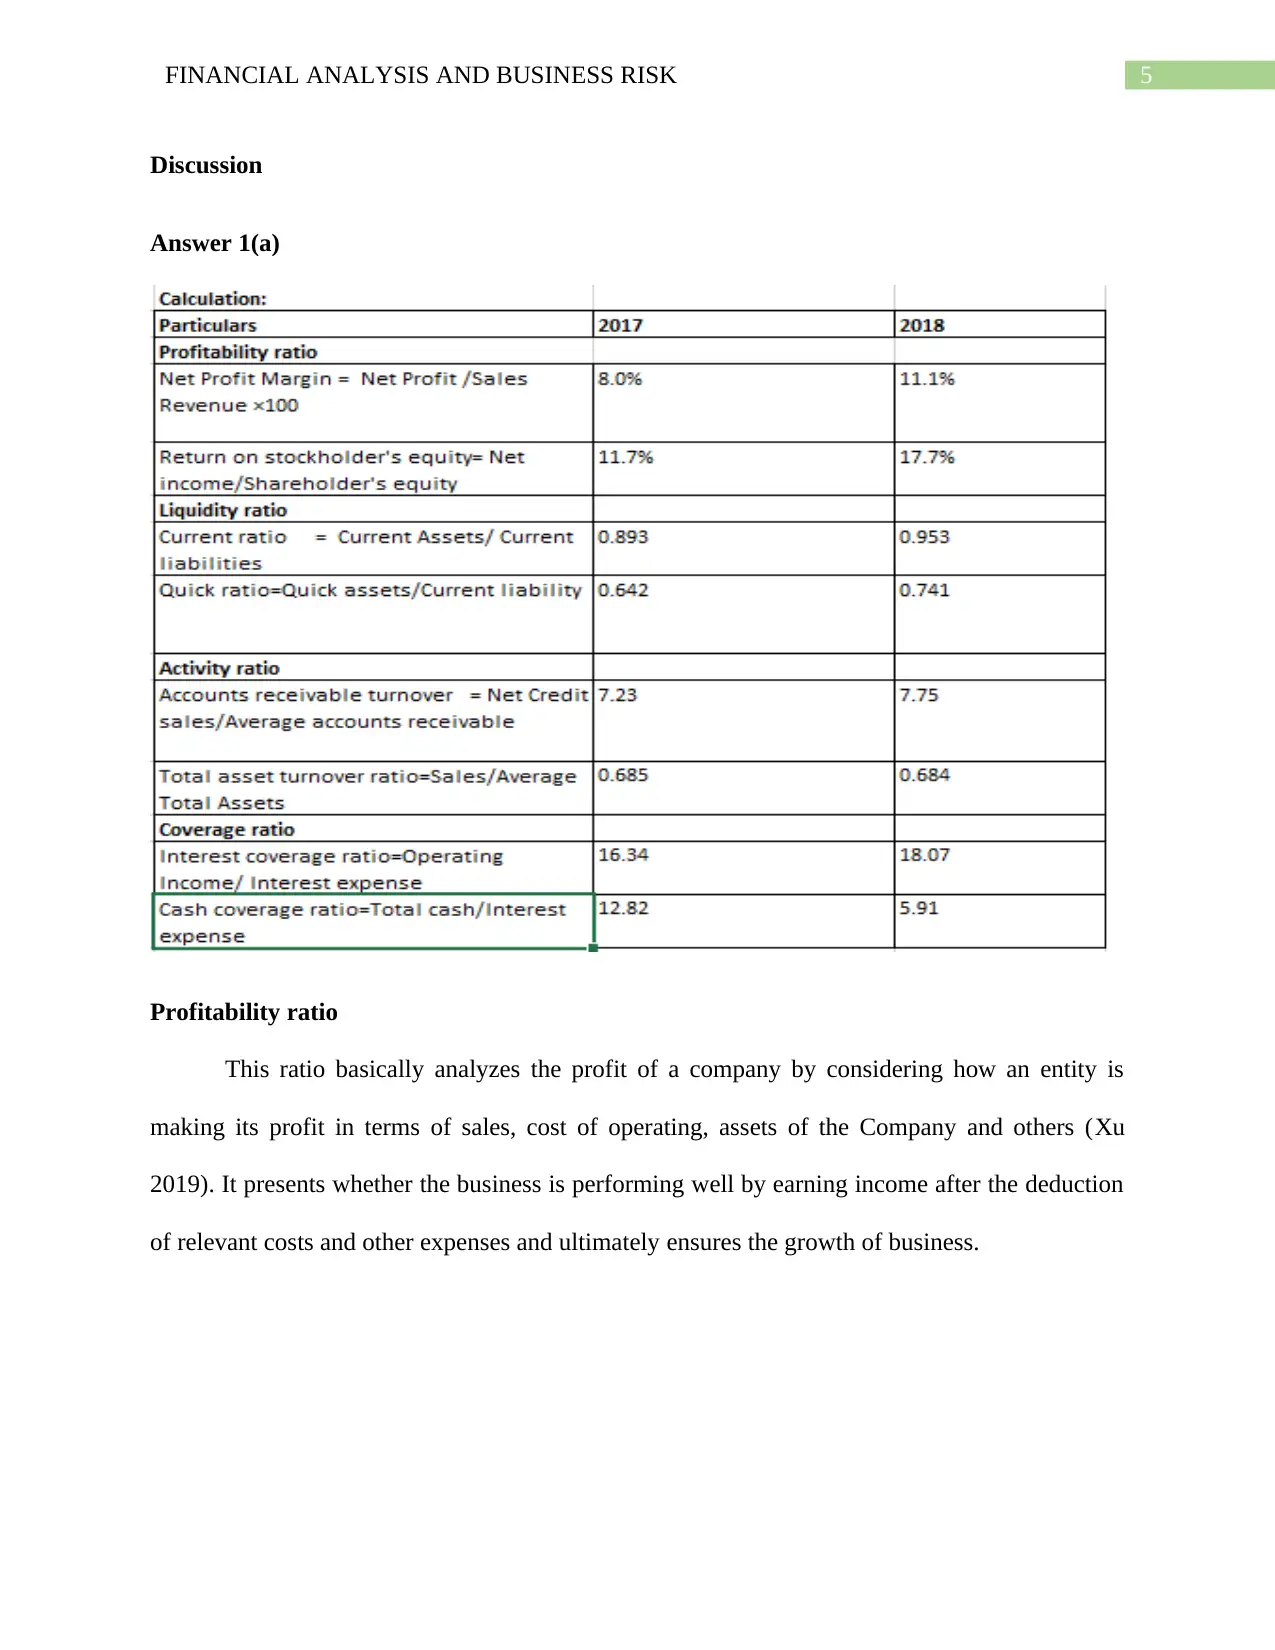
Answer 1(a)
Profitability ratio
This ratio basically analyzes the profit of a company by considering how an entity is
making its profit in terms of sales, cost of operating, assets of the Company and others (Xu
2019). It presents whether the business is performing well by earning income after the deduction
of relevant costs and other expenses and ultimately ensures the growth of business.
Discussion
Answer 1(a)
Profitability ratio
This ratio basically analyzes the profit of a company by considering how an entity is
making its profit in terms of sales, cost of operating, assets of the Company and others (Xu
2019). It presents whether the business is performing well by earning income after the deduction
of relevant costs and other expenses and ultimately ensures the growth of business.
⊘ This is a preview!⊘
Do you want full access?
Subscribe today to unlock all pages.
Trusted by 1+ million students worldwide
6FINANCIAL ANALYSIS AND BUSINESS RISK
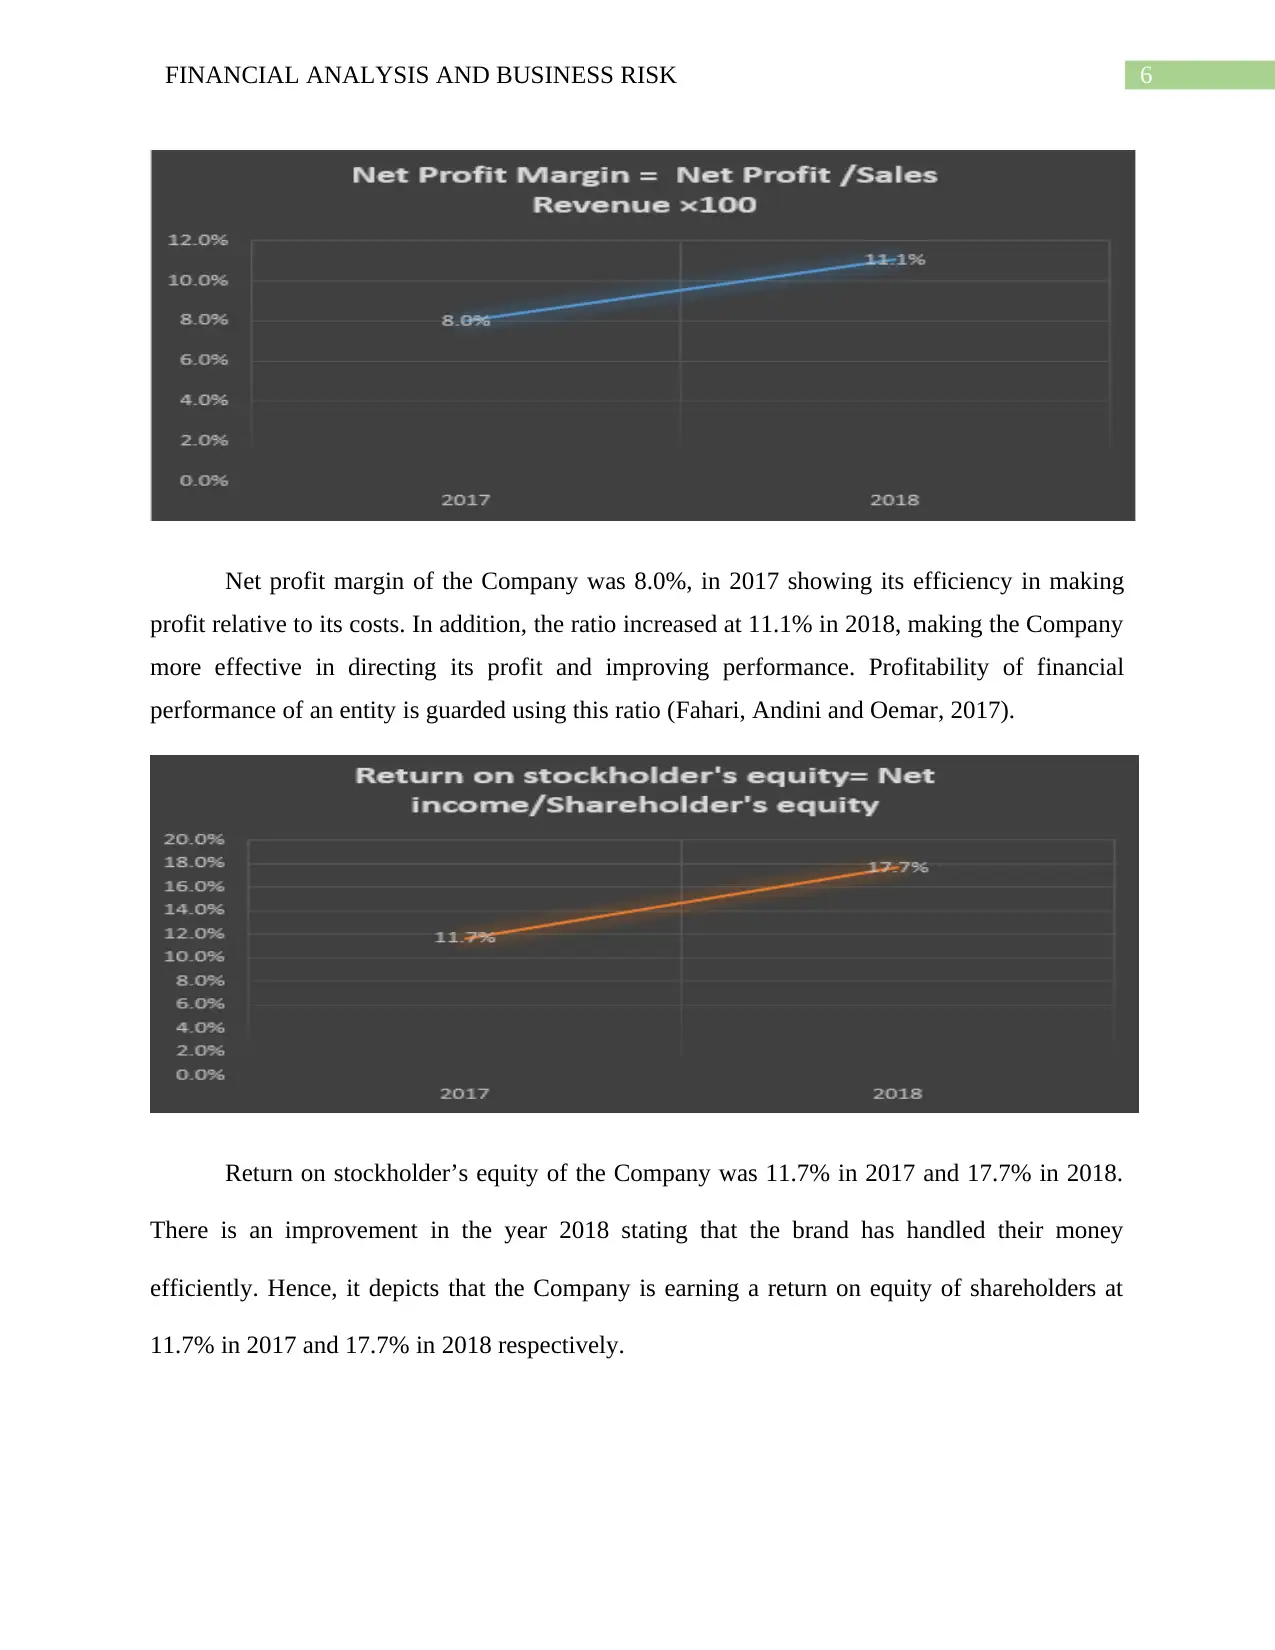
Net profit margin of the Company was 8.0%, in 2017 showing its efficiency in making
profit relative to its costs. In addition, the ratio increased at 11.1% in 2018, making the Company
more effective in directing its profit and improving performance. Profitability of financial
performance of an entity is guarded using this ratio (Fahari, Andini and Oemar, 2017).
Return on stockholder’s equity of the Company was 11.7% in 2017 and 17.7% in 2018.
There is an improvement in the year 2018 stating that the brand has handled their money
efficiently. Hence, it depicts that the Company is earning a return on equity of shareholders at
11.7% in 2017 and 17.7% in 2018 respectively.
Paraphrase This Document
Need a fresh take? Get an instant paraphrase of this document with our AI Paraphraser
7FINANCIAL ANALYSIS AND BUSINESS RISK
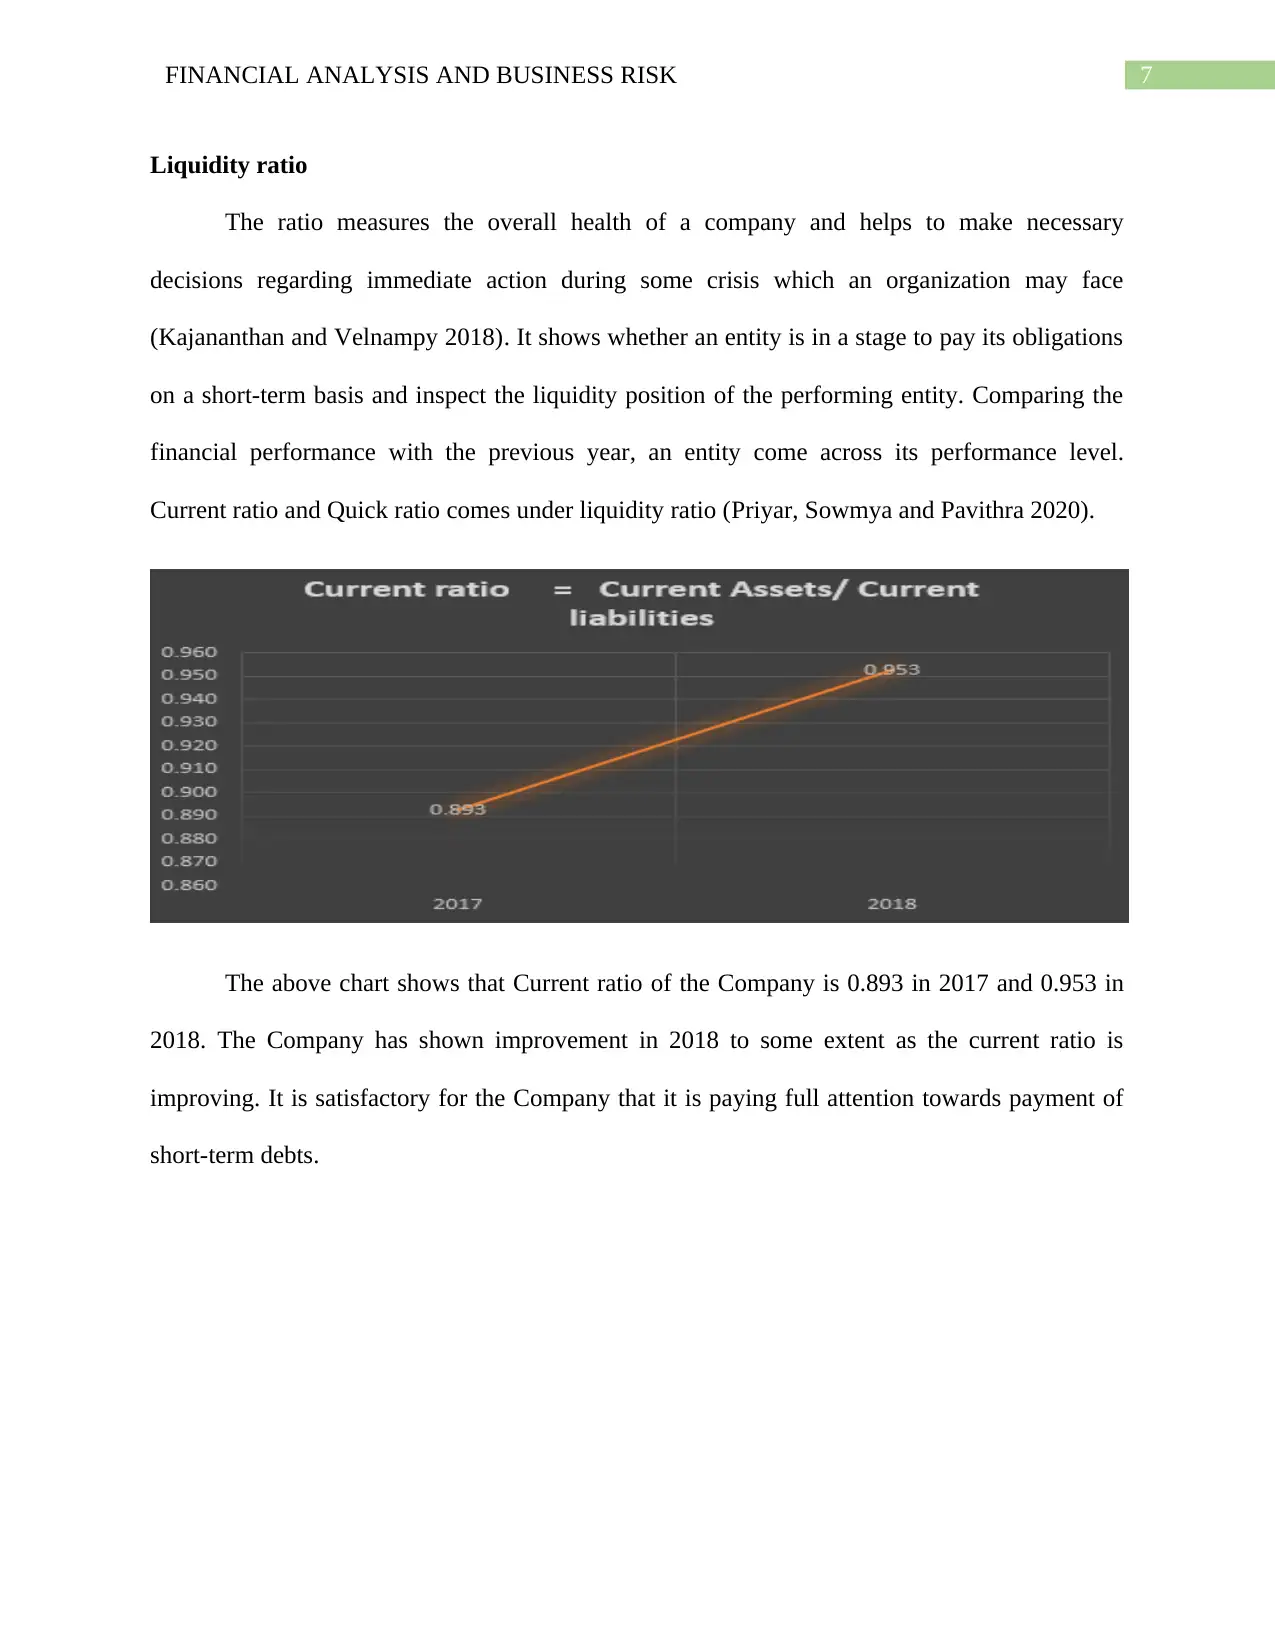
Liquidity ratio
The ratio measures the overall health of a company and helps to make necessary
decisions regarding immediate action during some crisis which an organization may face
(Kajananthan and Velnampy 2018). It shows whether an entity is in a stage to pay its obligations
on a short-term basis and inspect the liquidity position of the performing entity. Comparing the
financial performance with the previous year, an entity come across its performance level.
Current ratio and Quick ratio comes under liquidity ratio (Priyar, Sowmya and Pavithra 2020).
The above chart shows that Current ratio of the Company is 0.893 in 2017 and 0.953 in
2018. The Company has shown improvement in 2018 to some extent as the current ratio is
improving. It is satisfactory for the Company that it is paying full attention towards payment of
short-term debts.
8FINANCIAL ANALYSIS AND BUSINESS RISK
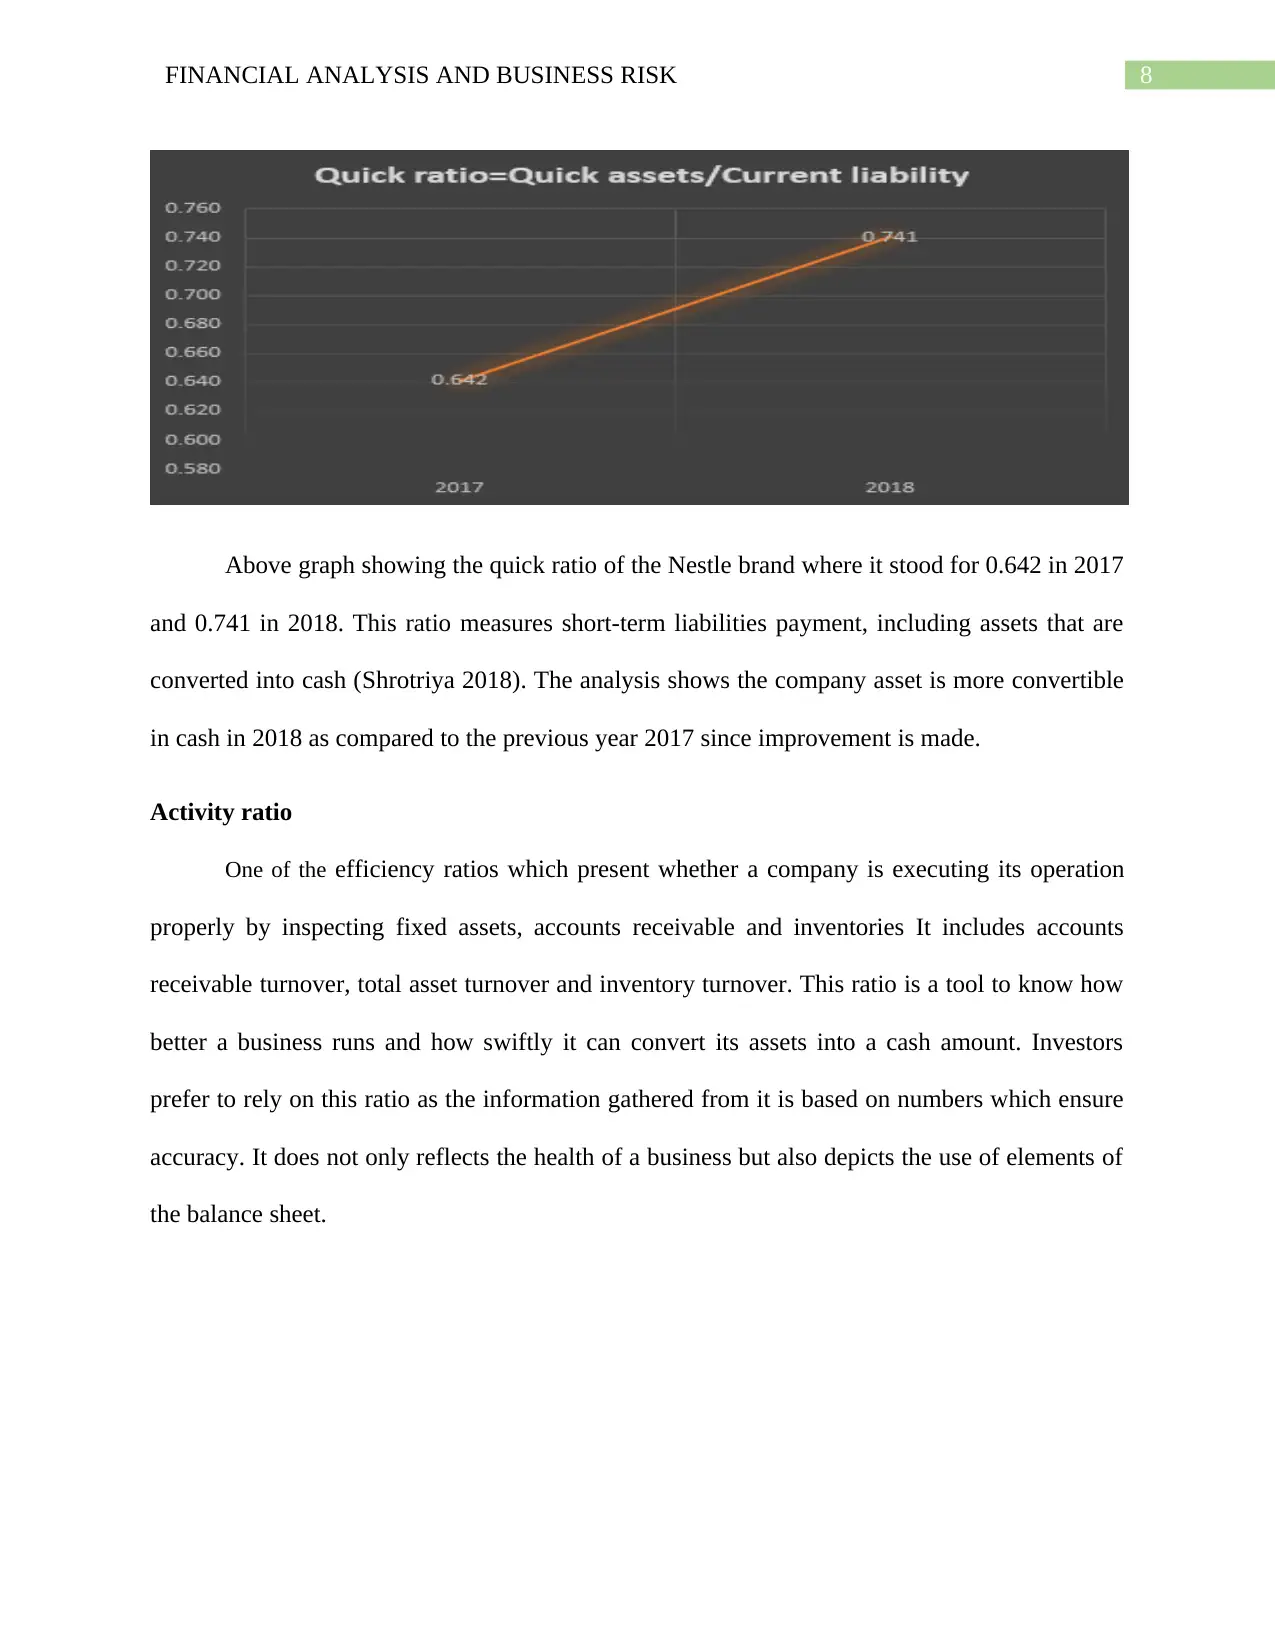
Above graph showing the quick ratio of the Nestle brand where it stood for 0.642 in 2017
and 0.741 in 2018. This ratio measures short-term liabilities payment, including assets that are
converted into cash (Shrotriya 2018). The analysis shows the company asset is more convertible
in cash in 2018 as compared to the previous year 2017 since improvement is made.
Activity ratio
One of the efficiency ratios which present whether a company is executing its operation
properly by inspecting fixed assets, accounts receivable and inventories It includes accounts
receivable turnover, total asset turnover and inventory turnover. This ratio is a tool to know how
better a business runs and how swiftly it can convert its assets into a cash amount. Investors
prefer to rely on this ratio as the information gathered from it is based on numbers which ensure
accuracy. It does not only reflects the health of a business but also depicts the use of elements of
the balance sheet.
⊘ This is a preview!⊘
Do you want full access?
Subscribe today to unlock all pages.
Trusted by 1+ million students worldwide
9FINANCIAL ANALYSIS AND BUSINESS RISK
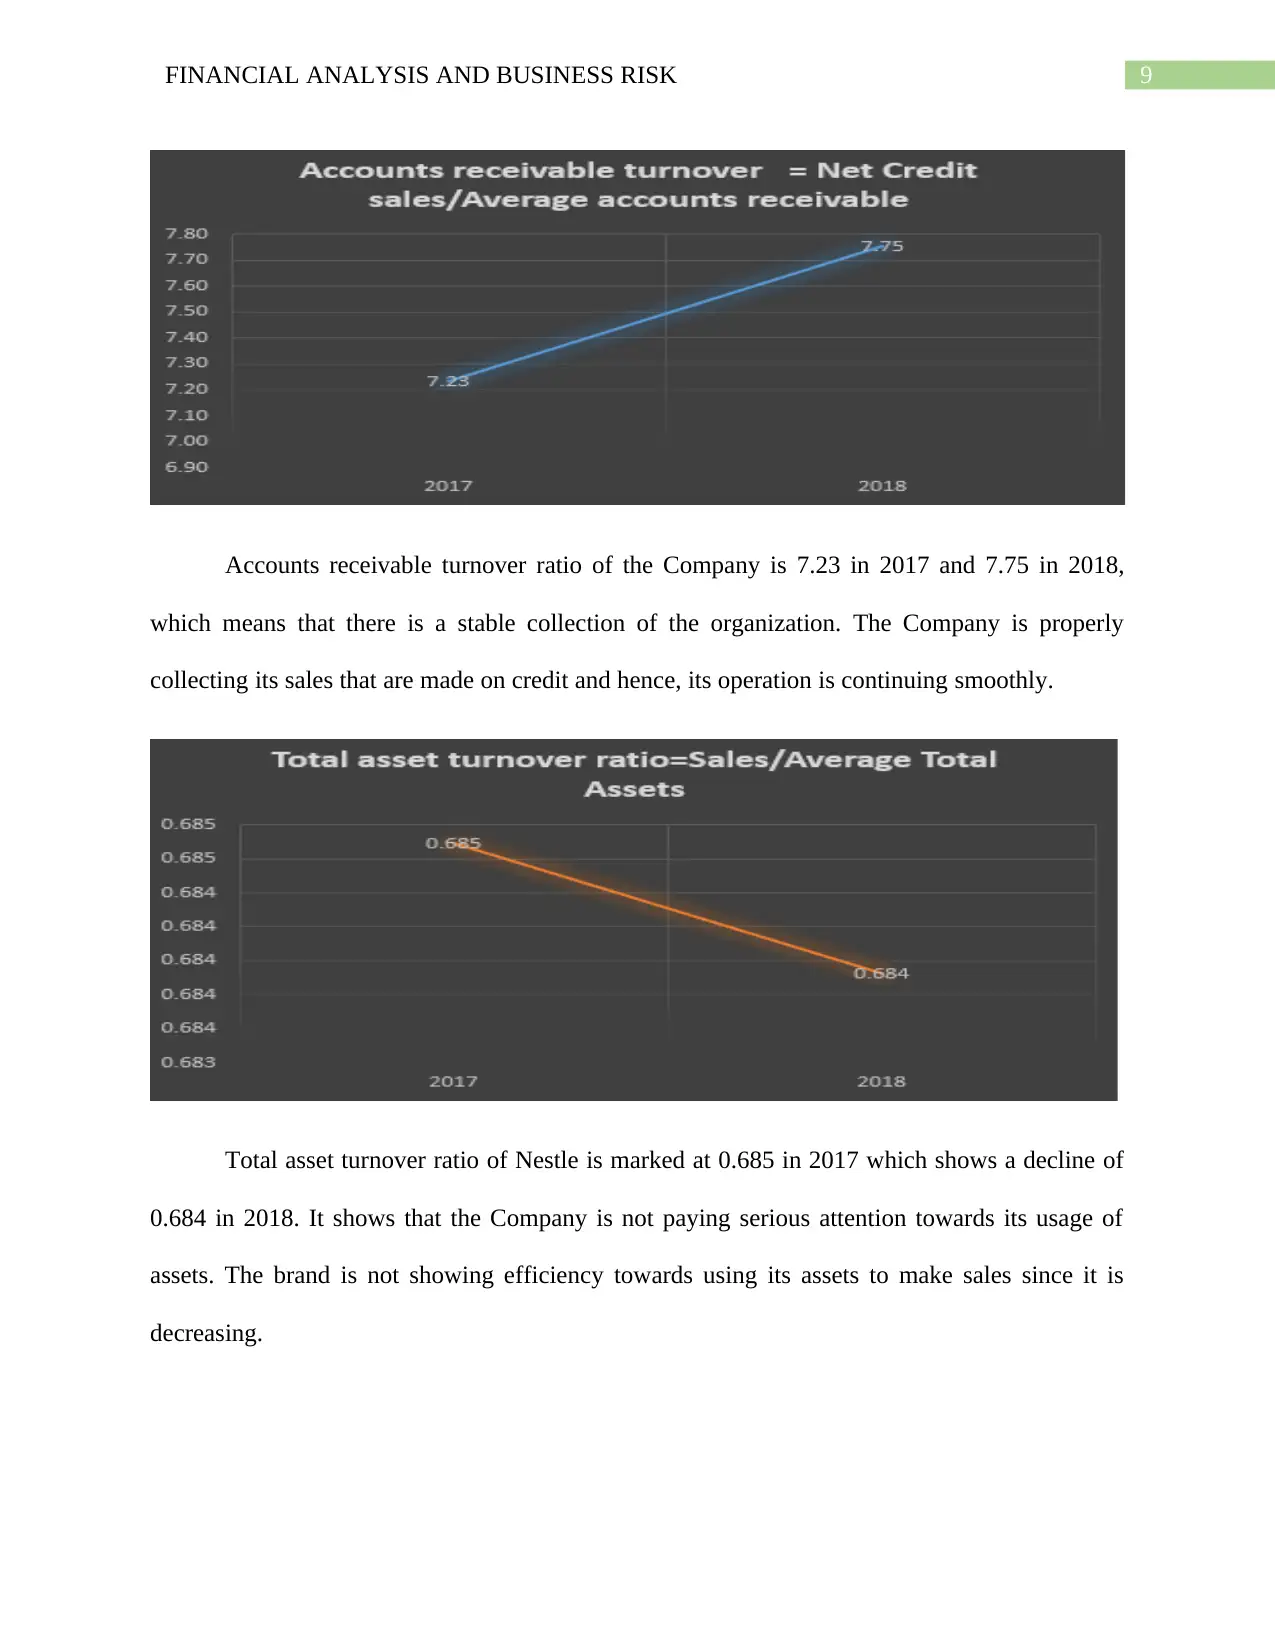
Accounts receivable turnover ratio of the Company is 7.23 in 2017 and 7.75 in 2018,
which means that there is a stable collection of the organization. The Company is properly
collecting its sales that are made on credit and hence, its operation is continuing smoothly.
Total asset turnover ratio of Nestle is marked at 0.685 in 2017 which shows a decline of
0.684 in 2018. It shows that the Company is not paying serious attention towards its usage of
assets. The brand is not showing efficiency towards using its assets to make sales since it is
decreasing.
Paraphrase This Document
Need a fresh take? Get an instant paraphrase of this document with our AI Paraphraser
10FINANCIAL ANALYSIS AND BUSINESS RISK
Coverage ratio
Coverage ratio is important to know the capacity of business to pay financial obligations.
It aims at measuring liquidity position of business by giving reliable cash picture to pay current
liabilities. Interest coverage ratio, cash coverage ratio, asset coverage ratio and debt-service
coverage ratio is part of this ratio. It estimates the capability of remaining strong, which
ultimately prevent from borrowing from others.
2017 2018
15.00
15.50
16.00
16.50
17.00
17.50
18.00
18.50
16.34
18.07
Interest coverage rati o=Operati ng Income/
Interest expense
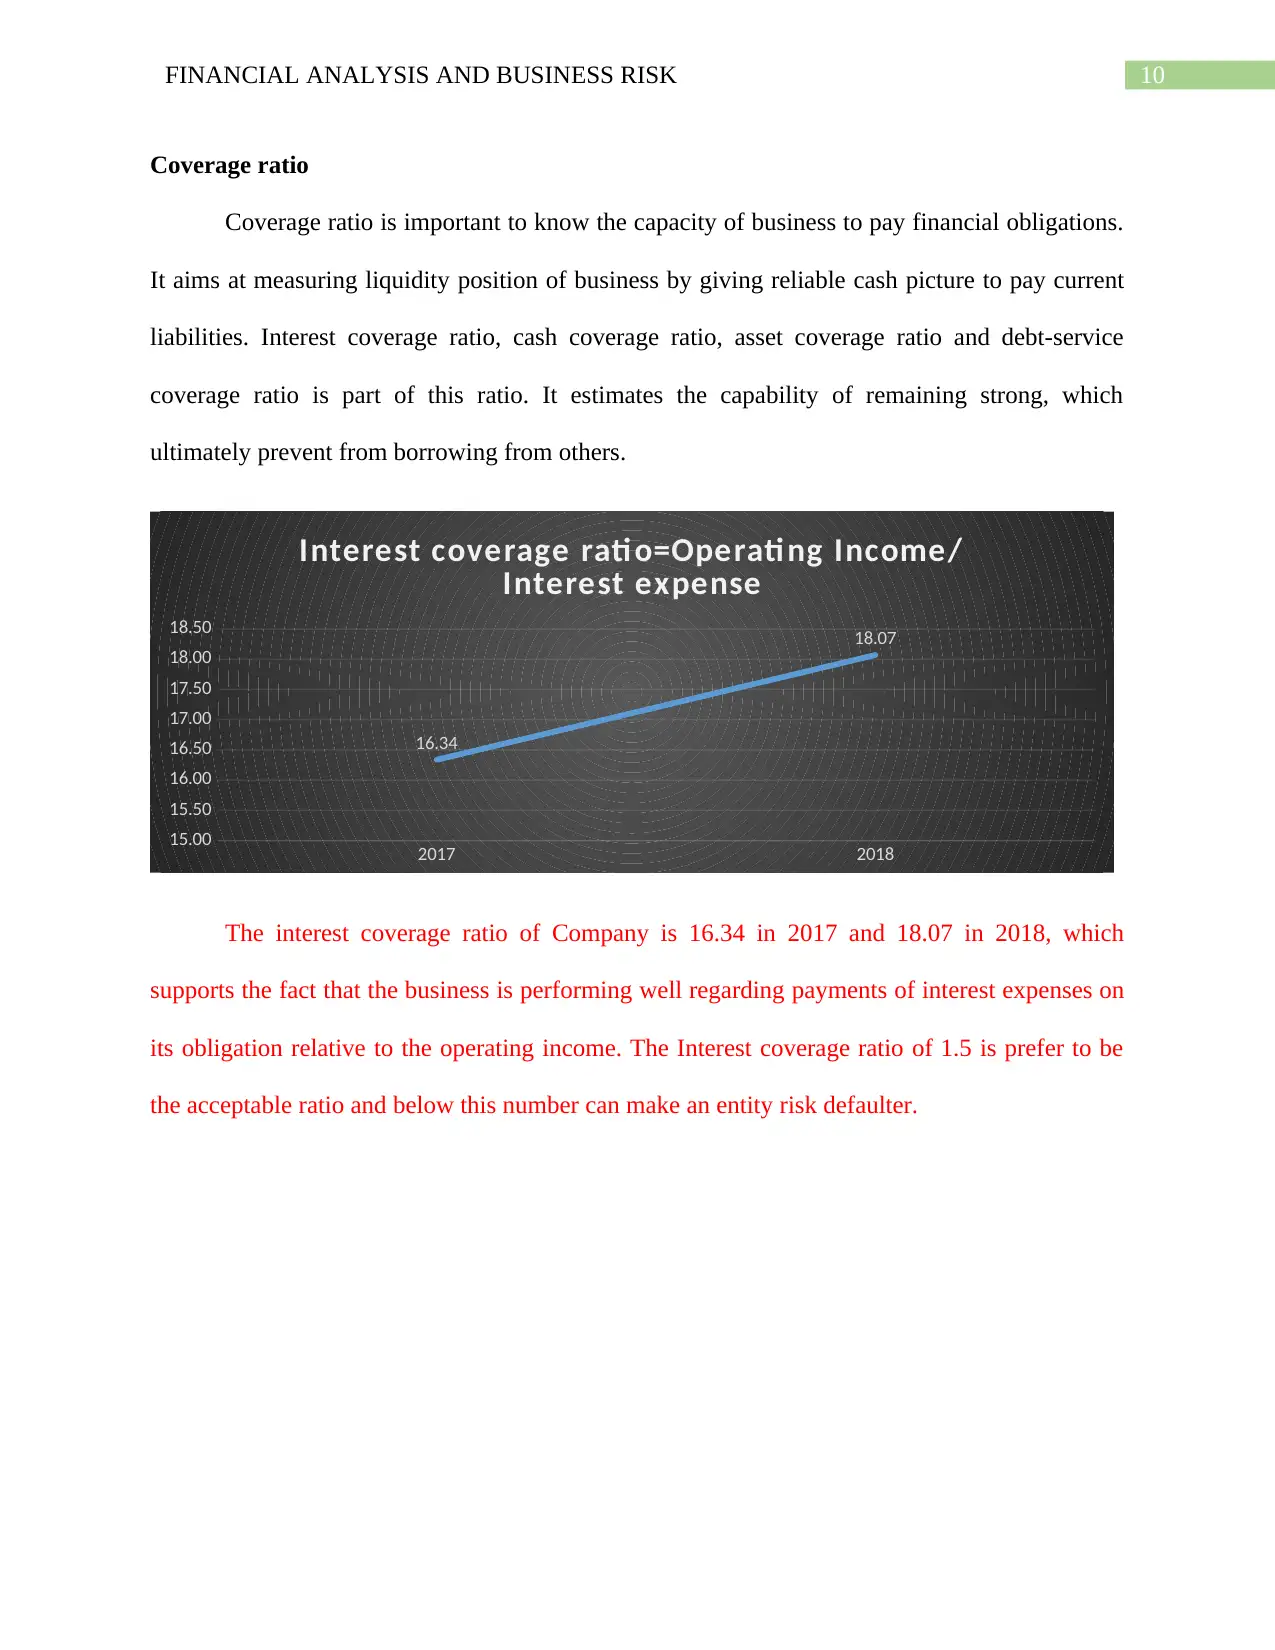
The interest coverage ratio of Company is 16.34 in 2017 and 18.07 in 2018, which
supports the fact that the business is performing well regarding payments of interest expenses on
its obligation relative to the operating income. The Interest coverage ratio of 1.5 is prefer to be
the acceptable ratio and below this number can make an entity risk defaulter.
Coverage ratio
Coverage ratio is important to know the capacity of business to pay financial obligations.
It aims at measuring liquidity position of business by giving reliable cash picture to pay current
liabilities. Interest coverage ratio, cash coverage ratio, asset coverage ratio and debt-service
coverage ratio is part of this ratio. It estimates the capability of remaining strong, which
ultimately prevent from borrowing from others.
2017 2018
15.00
15.50
16.00
16.50
17.00
17.50
18.00
18.50
16.34
18.07
Interest coverage rati o=Operati ng Income/
Interest expense
The interest coverage ratio of Company is 16.34 in 2017 and 18.07 in 2018, which
supports the fact that the business is performing well regarding payments of interest expenses on
its obligation relative to the operating income. The Interest coverage ratio of 1.5 is prefer to be
the acceptable ratio and below this number can make an entity risk defaulter.
11FINANCIAL ANALYSIS AND BUSINESS RISK
2017 2018
0.00
2.00
4.00
6.00
8.00
10.00
12.00
14.00 12.82
5.91
Cash coverage rati o=Total cash/Interest expense
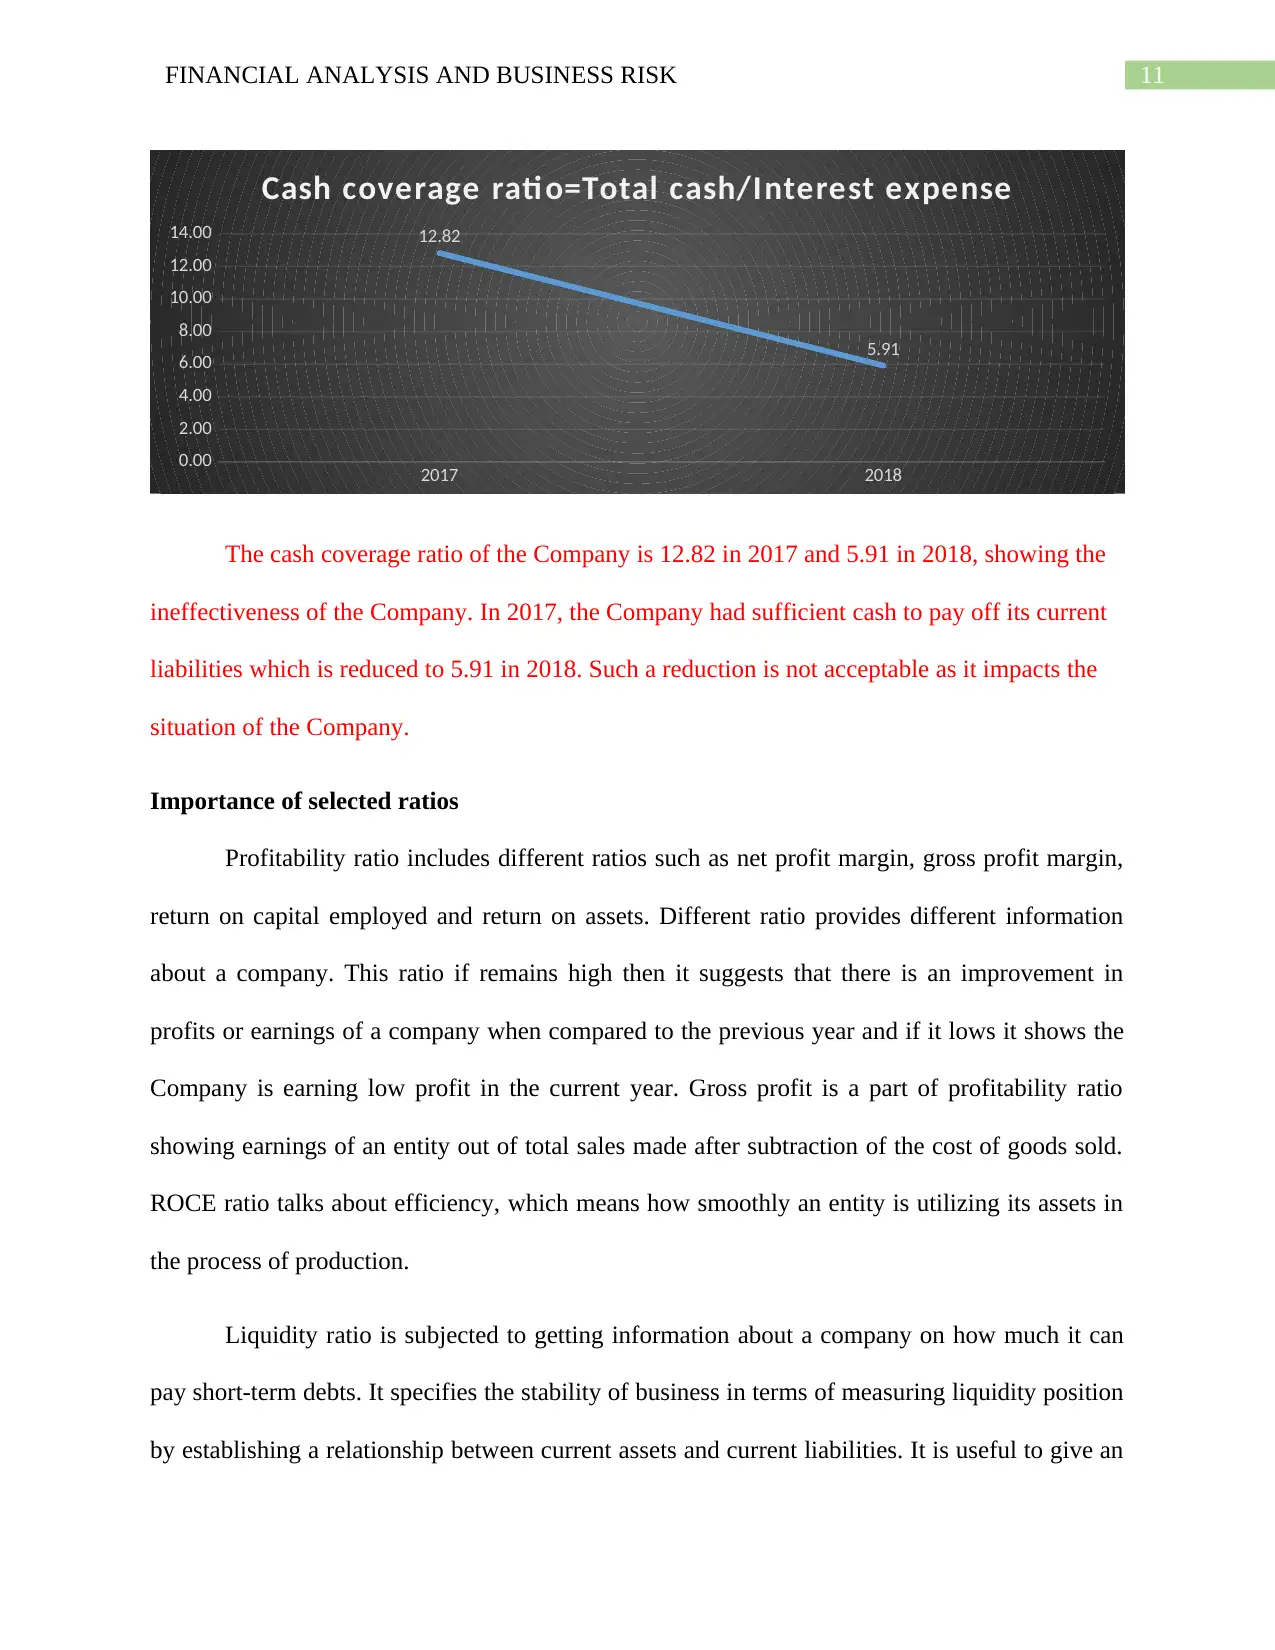
The cash coverage ratio of the Company is 12.82 in 2017 and 5.91 in 2018, showing the
ineffectiveness of the Company. In 2017, the Company had sufficient cash to pay off its current
liabilities which is reduced to 5.91 in 2018. Such a reduction is not acceptable as it impacts the
situation of the Company.
Importance of selected ratios
Profitability ratio includes different ratios such as net profit margin, gross profit margin,
return on capital employed and return on assets. Different ratio provides different information
about a company. This ratio if remains high then it suggests that there is an improvement in
profits or earnings of a company when compared to the previous year and if it lows it shows the
Company is earning low profit in the current year. Gross profit is a part of profitability ratio
showing earnings of an entity out of total sales made after subtraction of the cost of goods sold.
ROCE ratio talks about efficiency, which means how smoothly an entity is utilizing its assets in
the process of production.
Liquidity ratio is subjected to getting information about a company on how much it can
pay short-term debts. It specifies the stability of business in terms of measuring liquidity position
by establishing a relationship between current assets and current liabilities. It is useful to give an
2017 2018
0.00
2.00
4.00
6.00
8.00
10.00
12.00
14.00 12.82
5.91
Cash coverage rati o=Total cash/Interest expense
The cash coverage ratio of the Company is 12.82 in 2017 and 5.91 in 2018, showing the
ineffectiveness of the Company. In 2017, the Company had sufficient cash to pay off its current
liabilities which is reduced to 5.91 in 2018. Such a reduction is not acceptable as it impacts the
situation of the Company.
Importance of selected ratios
Profitability ratio includes different ratios such as net profit margin, gross profit margin,
return on capital employed and return on assets. Different ratio provides different information
about a company. This ratio if remains high then it suggests that there is an improvement in
profits or earnings of a company when compared to the previous year and if it lows it shows the
Company is earning low profit in the current year. Gross profit is a part of profitability ratio
showing earnings of an entity out of total sales made after subtraction of the cost of goods sold.
ROCE ratio talks about efficiency, which means how smoothly an entity is utilizing its assets in
the process of production.
Liquidity ratio is subjected to getting information about a company on how much it can
pay short-term debts. It specifies the stability of business in terms of measuring liquidity position
by establishing a relationship between current assets and current liabilities. It is useful to give an
⊘ This is a preview!⊘
Do you want full access?
Subscribe today to unlock all pages.
Trusted by 1+ million students worldwide
1 out of 28