Financial Analysis and Valuation Models for Barclays Plc. Report
VerifiedAdded on 2023/04/21
|19
|3796
|484
Report
AI Summary
This report presents a financial analysis of Barclays Plc., evaluating its performance through various valuation models to aid in investment decisions. The report begins with an executive summary and table of contents, followed by an introduction to Barclays, a multinational banking company. It delves into three stock evaluation methods: the Dividend Discount Model (DDM), Discounted Cash Flow (DCF), and Price to Earnings ratio (P/E). The report then applies these models to value Barclays shares, providing interpretations of each method's results. Furthermore, it includes a past performance analysis, examining share price, market capitalization, financial ratios, and comparative financial statements. The conclusion summarizes the findings, offering insights into investment strategies based on the financial analysis and valuation models employed.
Running head: FINANCIAL ANALYSIS AND VALUATION MODELS
Financial Analysis and Valuation Models
Name of the student:
Name of the university:
Author’s Note:
Financial Analysis and Valuation Models
Name of the student:
Name of the university:
Author’s Note:
Paraphrase This Document
Need a fresh take? Get an instant paraphrase of this document with our AI Paraphraser
1
Executive Summary:
This report is prepared to show the effect of different valuation models on the investment
decision of the investor. In this report, financial performance of the Barclays Plc. has been
analyzed in such a way that investment decision can be made considered for different factors
affecting investment. This report covers the ratio analysis for four previous financial year of
the Barclays Plc., from the information obtained from the financial statement of the company.
This report also indicates the choice of the strategy an investor can made from Buy, Hold and
Sell strategy based on three valuation models and financial performance of the company.
2
Table of Contents
1. Introduction:...........................................................................................................................3
2. Stock Evaluation Method:......................................................................................................3
2.1 Dividend Discount Model:...............................................................................................3
2.2 Discounted Cash Flow:....................................................................................................4
2.3 Price to Earnings ratio:.....................................................................................................5
3. Valuation of Share Using Different Models of Valuation:....................................................7
3.1 Valuation Based on Dividend Discount Method (DDM):...............................................7
3.2 Valuation Based on Cash Flow Method:.........................................................................8
3.3 Valuation Based on P/E Ratio:.........................................................................................9
4. Past performance Analysis:....................................................................................................9
4.1 Using Price And Market Capitalization of The Company:..............................................9
4.2 Using Financial Ratios:..................................................................................................12
4.3 Using Comparative Statement of Balance sheet and Income Statement:......................14
5. Conclusion:..........................................................................................................................15
6. References:...........................................................................................................................17
⊘ This is a preview!⊘
Do you want full access?
Subscribe today to unlock all pages.
Trusted by 1+ million students worldwide
3
1. Introduction:
Barclays is a multinational banking company engaged in investing as well as financial
services in London. It provides various financial services in different European countries. it
provides personal as well as business banking services in which facilities like credit and debit
cards, investment planning, locker services, wealth management are offered to the different
types of clients based on their net worth. It was established by john freame as Goldsmith
Bankers but in the end of 1736, it become Barclays bank when the son-in-law of James
Freame has taken over the business of Goldsmith. Through acquisitions and mergers with
different banking companies like the Colonial Bank, National Bank of South Africa and the
Anglo-Egyptian Bank and Non-Banking companies like Mercantile Credit Company,
American Credit Corporation etc , it expended its business to different regions of the world.
2. Stock Evaluation Method:
2.1 Dividend Discount Model:
Dividend Discount Model is a process of valuation of stock price of accompany where the
dividend payment is discounted to the present value of stock price. The stocks are valued on
the basis of net present value for the dividends of the future. Gordon’s growth model is a
renowned growth used in this model. If the DDM of a particular stock is higher then it can be
said that the current value of the stock is undervalued and in case DDM of a particular stock
is lower then it can be said that the value of the stock is overvalued currently (Mohammadian
and Rezaee 2018).
The valuation of the stock can be done in following way:
P = D/ (r – g)
Paraphrase This Document
Need a fresh take? Get an instant paraphrase of this document with our AI Paraphraser
4
Where,
P = Price per share, D = estimated value of dividend of next year, g = constant growth rate of
dividend, r = company’s cost of capital equity
The Gordon’s growth model has an assumption, which is that the dividend has a stable
growth rate. The growth rate of this model is stable as the dividend year after year is also
remains stable in that case. It is a process of finding the value of stock with the process of
discounting all the expected future dividends.
The flaws of the dividend discount model are that, with the constant increase in the rate of
dividend. In that case, if the dividend increases then it does not increase at a constant rate. In
order to buy a stock an investor must not only consider that particular stock even if it is cheap
or expensive based on DDM. The particular investor must also consider the following
parameters in case of buying a particular stock, which are return on equity, revenue and
earnings growth, price earnings ratio and the company’s dividend payout ratio, are certain
parameters needed to be considered while purchasing a stock.
2.2 Discounted Cash Flow:
Discounted Cash Flow (DCF) is a method of evaluating the value of investment, which is
based on cash flow related to the future. The expected cash flow of the future converted into
the present value of cash flow by using discount rate. The calculated value of the DCF if it is
higher than the cost of current investment, then such opportunity cost must be considered.
The formula is that DCF = CF1/ (1 + r)1 + CF2/ (1 + r)2 + … CFn/ (1 + r)n
Where,
CF = Cash Flow, r = discount rate
Where,
P = Price per share, D = estimated value of dividend of next year, g = constant growth rate of
dividend, r = company’s cost of capital equity
The Gordon’s growth model has an assumption, which is that the dividend has a stable
growth rate. The growth rate of this model is stable as the dividend year after year is also
remains stable in that case. It is a process of finding the value of stock with the process of
discounting all the expected future dividends.
The flaws of the dividend discount model are that, with the constant increase in the rate of
dividend. In that case, if the dividend increases then it does not increase at a constant rate. In
order to buy a stock an investor must not only consider that particular stock even if it is cheap
or expensive based on DDM. The particular investor must also consider the following
parameters in case of buying a particular stock, which are return on equity, revenue and
earnings growth, price earnings ratio and the company’s dividend payout ratio, are certain
parameters needed to be considered while purchasing a stock.
2.2 Discounted Cash Flow:
Discounted Cash Flow (DCF) is a method of evaluating the value of investment, which is
based on cash flow related to the future. The expected cash flow of the future converted into
the present value of cash flow by using discount rate. The calculated value of the DCF if it is
higher than the cost of current investment, then such opportunity cost must be considered.
The formula is that DCF = CF1/ (1 + r)1 + CF2/ (1 + r)2 + … CFn/ (1 + r)n
Where,
CF = Cash Flow, r = discount rate
5
The main purpose of this model is that the discounting of cash flow is done in such a
situation when the investment is high or rather complicated when the investors is not able to
access the cash flow of the future. DCF analysis is based on the discount rate and there are
various ways to correct the rate of discount, which is depended on the purpose of the
investment. During the time of investment, an investor also could set the DCF rate of
discount, which is equal to the expected return from an alternative investment of the same
kind of risk. This kind of analysis is used in the following cases, which are investment
finance, financial management and valuation of patent. DCF analysis is used in order to
evaluate the Net Present Value, which is considered as input cash flows, and a discount rate,
which further gives output as a present value. The discount rate considered in this method is
the weighted average cost of capital (WACC) which shows the risk in the flow of cash. The
discount rate shows the two things, which are the time value of money and risk premium.
The assumptions that can be made in this case is that the cash flow occurs at the end of the
year. DCF is mostly associated with the big investment projects where there is uncertainty in
the business and the adjustments are made accordingly. All cash flows are invested in various
projects in order to generate return of the company.
2.3 Price to Earnings ratio:
Price to Earnings ratio is a ratio, which is used for the purpose of valuation of a company,
which further measures the current price of the share related to its EPS (Earning Per Share). It
is also termed as the earnings multiples because the current price of share of the company is
related to EPS of the company.
The formula of the P/E Ratio = Market Value per Share / Earning per Share
The P/E ratio is a tool, which is used for determining the value of the stock by the investor for
the purpose of investing. The P/E ratio of a company shows that the market is based on future
⊘ This is a preview!⊘
Do you want full access?
Subscribe today to unlock all pages.
Trusted by 1+ million students worldwide
6
earnings the market pays according to that. According to the P/E, if the P/E of the company is
high then the investors will go for that company and if the P/E of the company is low then the
investors does not prefer those companies. The P/E ratio consists of two types, which are the
Absolute P/E and Relative P/E. Thus, P/E is an important tool considered by the investors in
terms of taking the investment decisions of the company. High P/E of the company will
automatically drag the potential investors in the market. This will help the company to
increase the efficiency of the business smoothly and efficiently. If the return of a company
increases then the stock price of that company decreases. If the risk of investment is higher
then the price of the stock becomes low in that case.
The flaws of the P/E ratio is that in case of taking the investment decision, the investor may
take into their mind that if there is one single metric then it will provide the complete view
into the investment decision taken by the investor which may not be the case most of the
time. When the P/E ratio is compared with different companies then it becomes one of the
flaws in P/E ratio. The valuations along with the rate of growth of the companies between the
various sectors of the companies earn money in various timelines. In case of the same sectors
the P/E is used as an analysis tool and comparisons in this case will give productive return for
the investors. If the growth of the expected dividend increases then the P/E of the particular
company also increases in that case.
If the P/E ratio of different companies within the same sector is high then it will be of less
cause when the entire other sectors has high P/E ratios. In case of debt of the company, the
company having higher debt will have low P/E ratio then the company having low debt. The
business having high debt will considerably have high P/E ratio as that particular company
has taken leverage in that case.
Paraphrase This Document
Need a fresh take? Get an instant paraphrase of this document with our AI Paraphraser
7
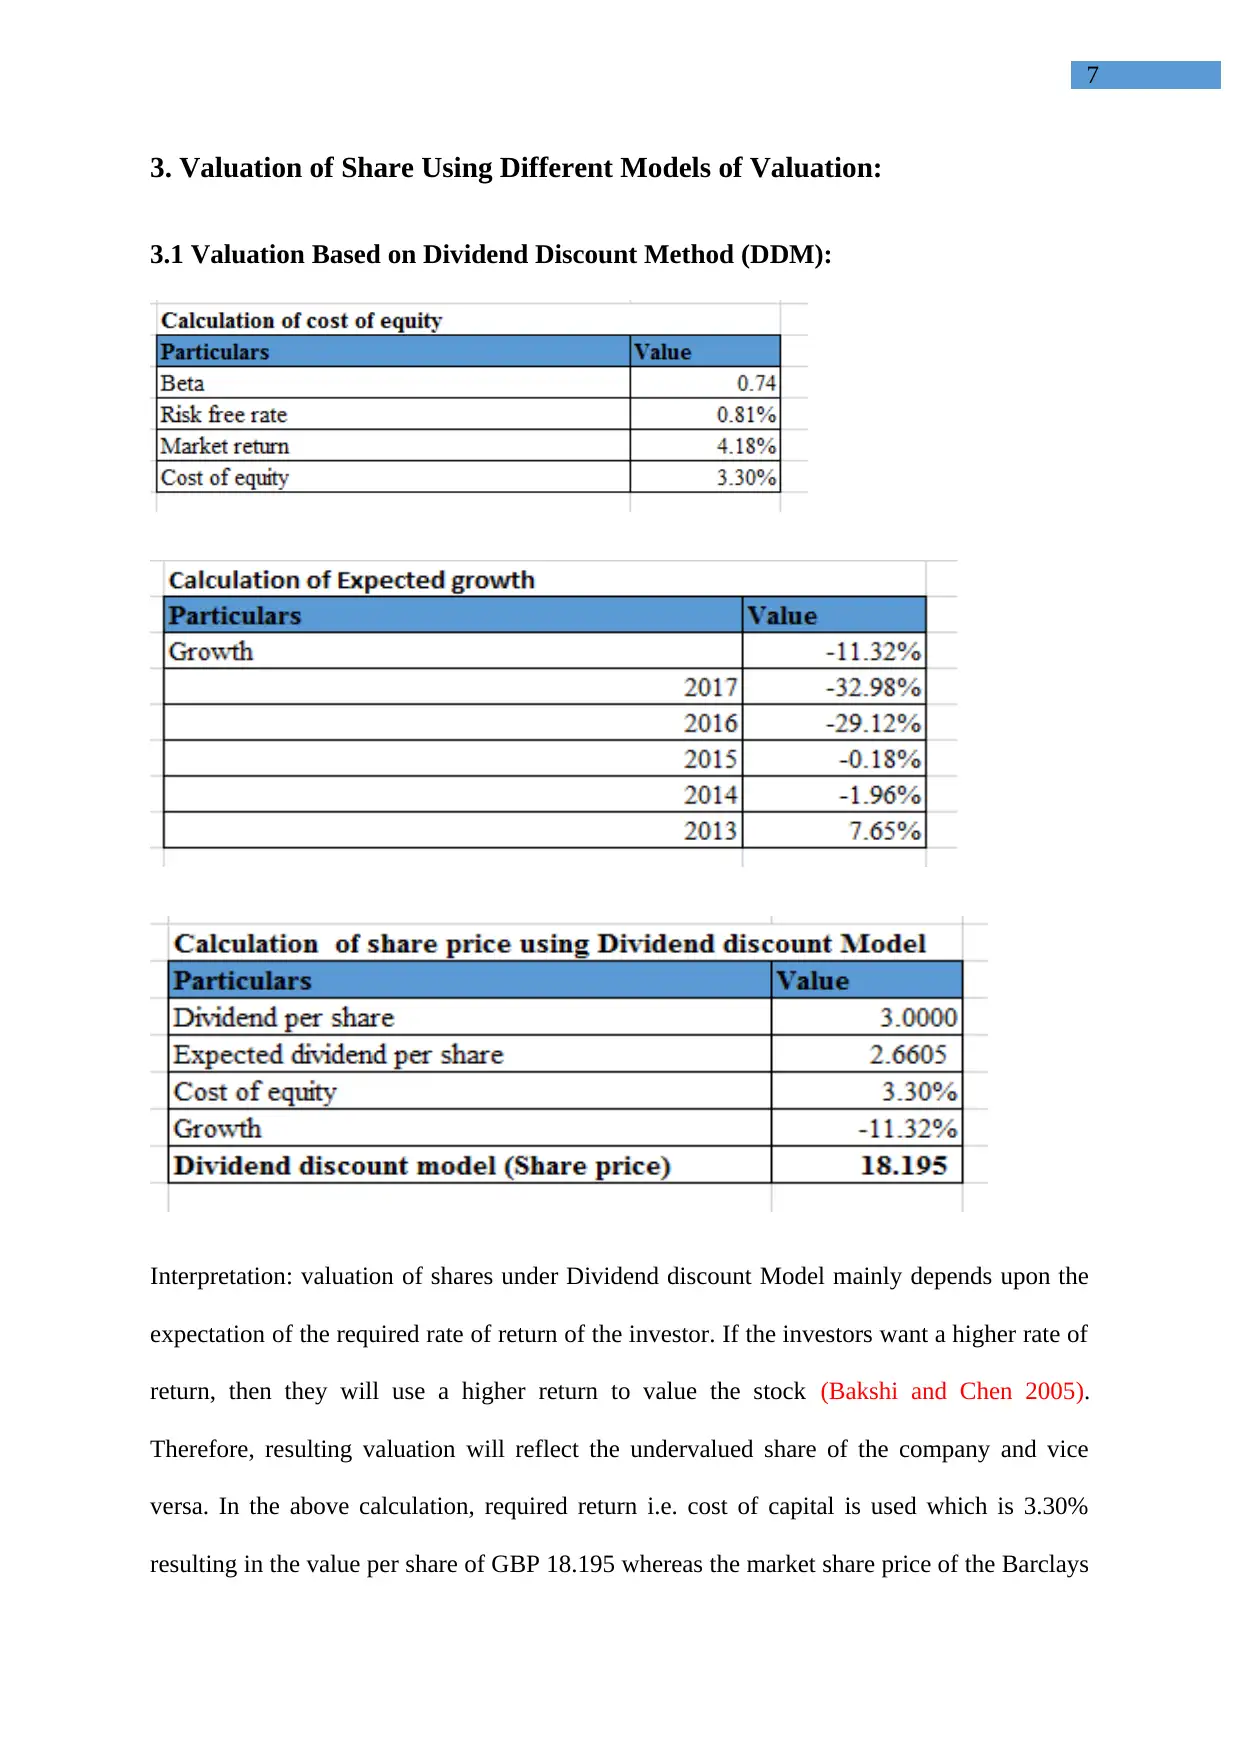
3. Valuation of Share Using Different Models of Valuation:
3.1 Valuation Based on Dividend Discount Method (DDM):
Interpretation: valuation of shares under Dividend discount Model mainly depends upon the
expectation of the required rate of return of the investor. If the investors want a higher rate of
return, then they will use a higher return to value the stock (Bakshi and Chen 2005).
Therefore, resulting valuation will reflect the undervalued share of the company and vice
versa. In the above calculation, required return i.e. cost of capital is used which is 3.30%
resulting in the value per share of GBP 18.195 whereas the market share price of the Barclays
8
plc at valuation date was GBP 198.59. Therefore, the stock is overvalued based on DDM
analysis. The investor should sell the stock and to wait till the stock price below the price as
determined by DDM to get expected return on the stock (Bakshi and Chen 2005).
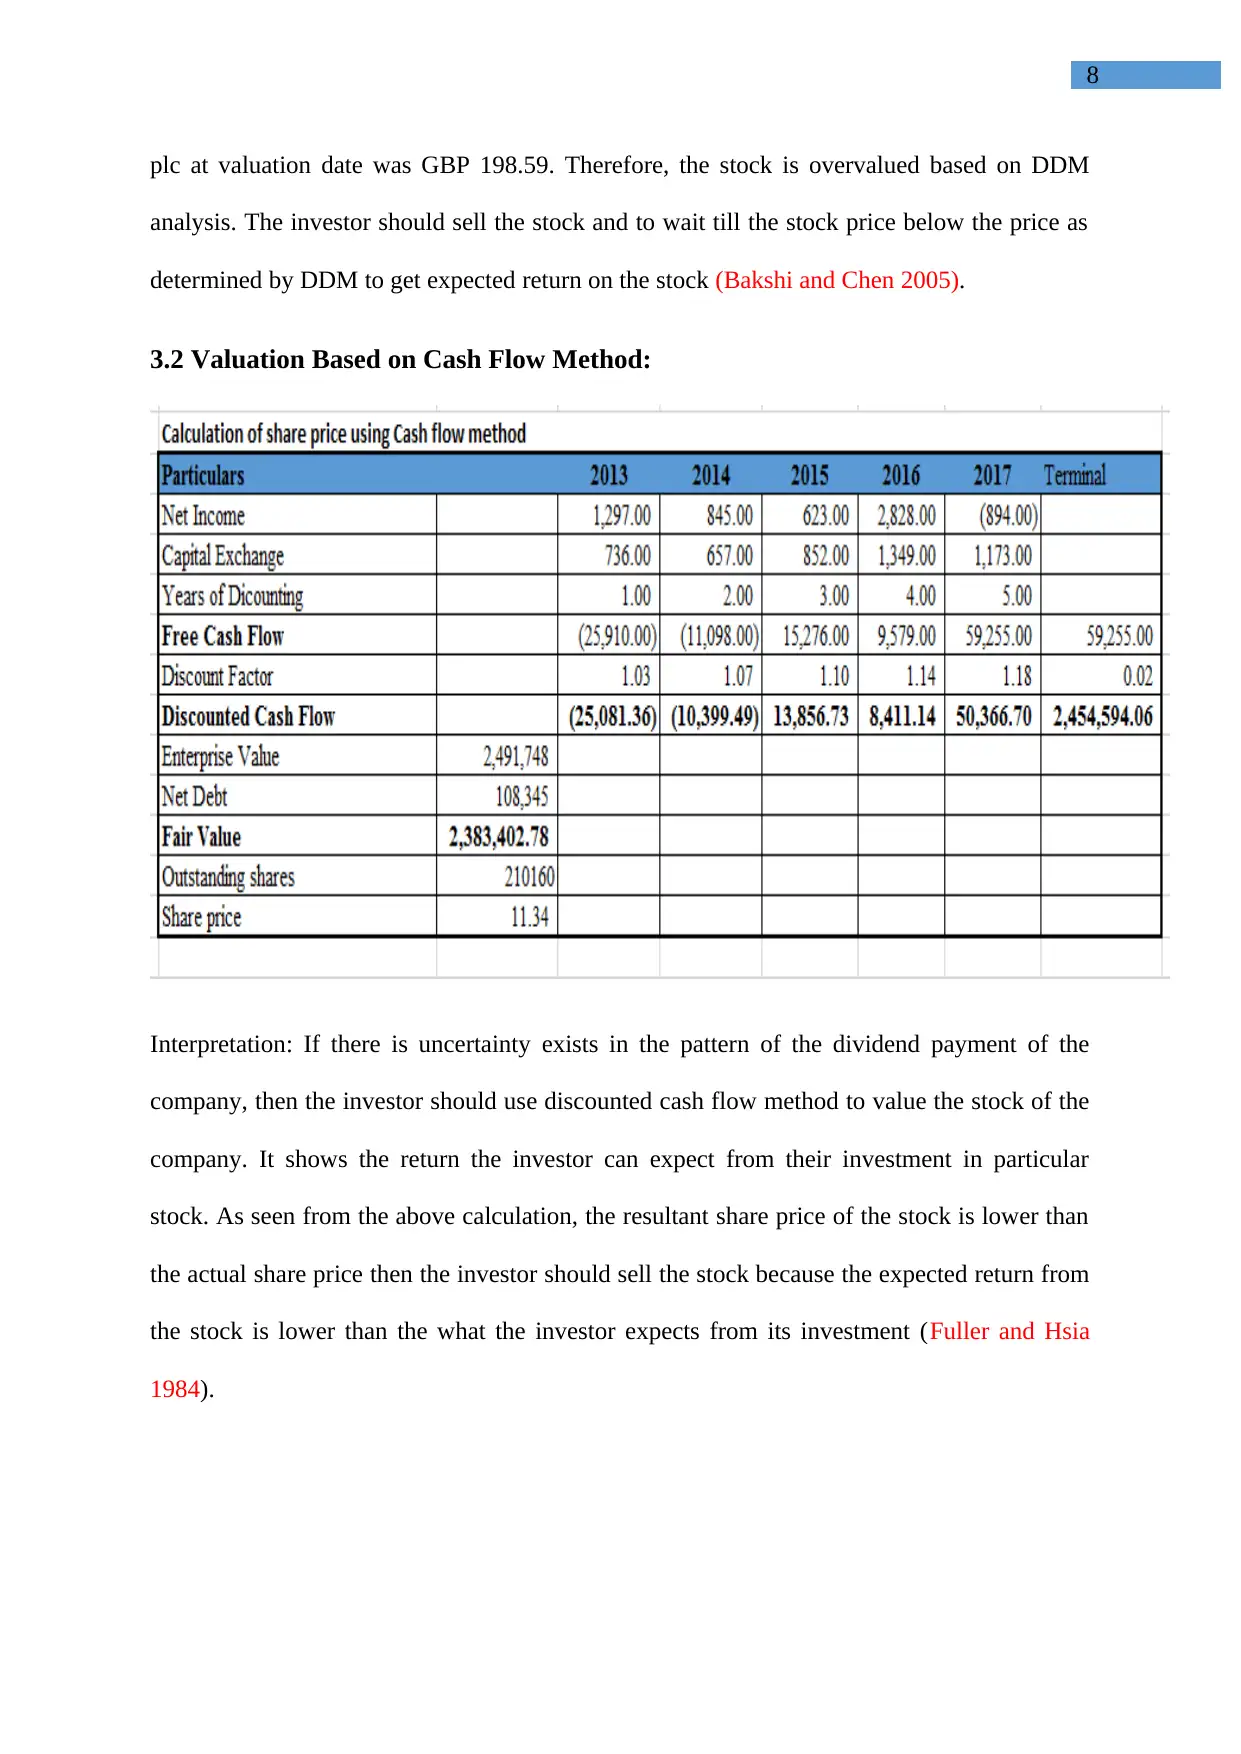
3.2 Valuation Based on Cash Flow Method:
Interpretation: If there is uncertainty exists in the pattern of the dividend payment of the
company, then the investor should use discounted cash flow method to value the stock of the
company. It shows the return the investor can expect from their investment in particular
stock. As seen from the above calculation, the resultant share price of the stock is lower than
the actual share price then the investor should sell the stock because the expected return from
the stock is lower than the what the investor expects from its investment (Fuller and Hsia
1984).
plc at valuation date was GBP 198.59. Therefore, the stock is overvalued based on DDM
analysis. The investor should sell the stock and to wait till the stock price below the price as
determined by DDM to get expected return on the stock (Bakshi and Chen 2005).
3.2 Valuation Based on Cash Flow Method:
Interpretation: If there is uncertainty exists in the pattern of the dividend payment of the
company, then the investor should use discounted cash flow method to value the stock of the
company. It shows the return the investor can expect from their investment in particular
stock. As seen from the above calculation, the resultant share price of the stock is lower than
the actual share price then the investor should sell the stock because the expected return from
the stock is lower than the what the investor expects from its investment (Fuller and Hsia
1984).
⊘ This is a preview!⊘
Do you want full access?
Subscribe today to unlock all pages.
Trusted by 1+ million students worldwide
9
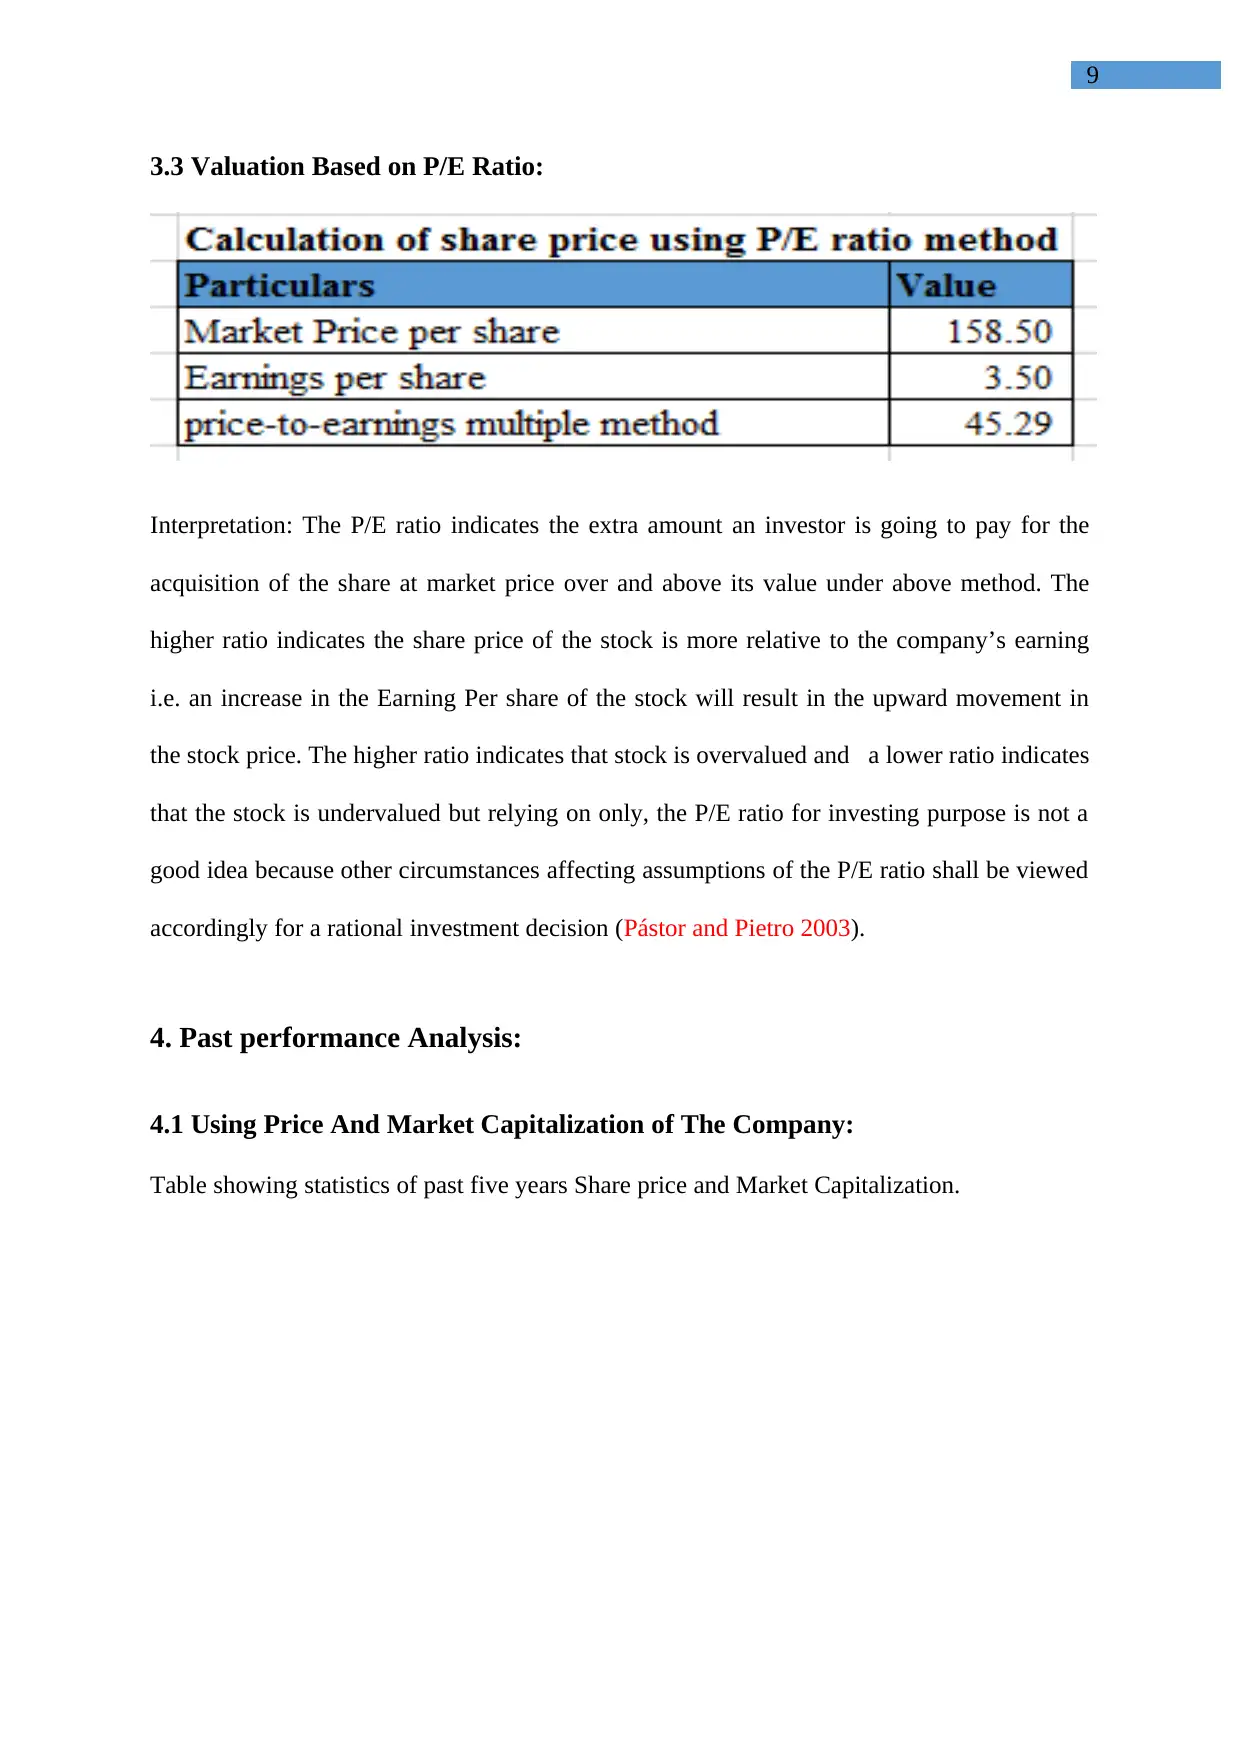
3.3 Valuation Based on P/E Ratio:
Interpretation: The P/E ratio indicates the extra amount an investor is going to pay for the
acquisition of the share at market price over and above its value under above method. The
higher ratio indicates the share price of the stock is more relative to the company’s earning
i.e. an increase in the Earning Per share of the stock will result in the upward movement in
the stock price. The higher ratio indicates that stock is overvalued and a lower ratio indicates
that the stock is undervalued but relying on only, the P/E ratio for investing purpose is not a
good idea because other circumstances affecting assumptions of the P/E ratio shall be viewed
accordingly for a rational investment decision (Pástor and Pietro 2003).
4. Past performance Analysis:
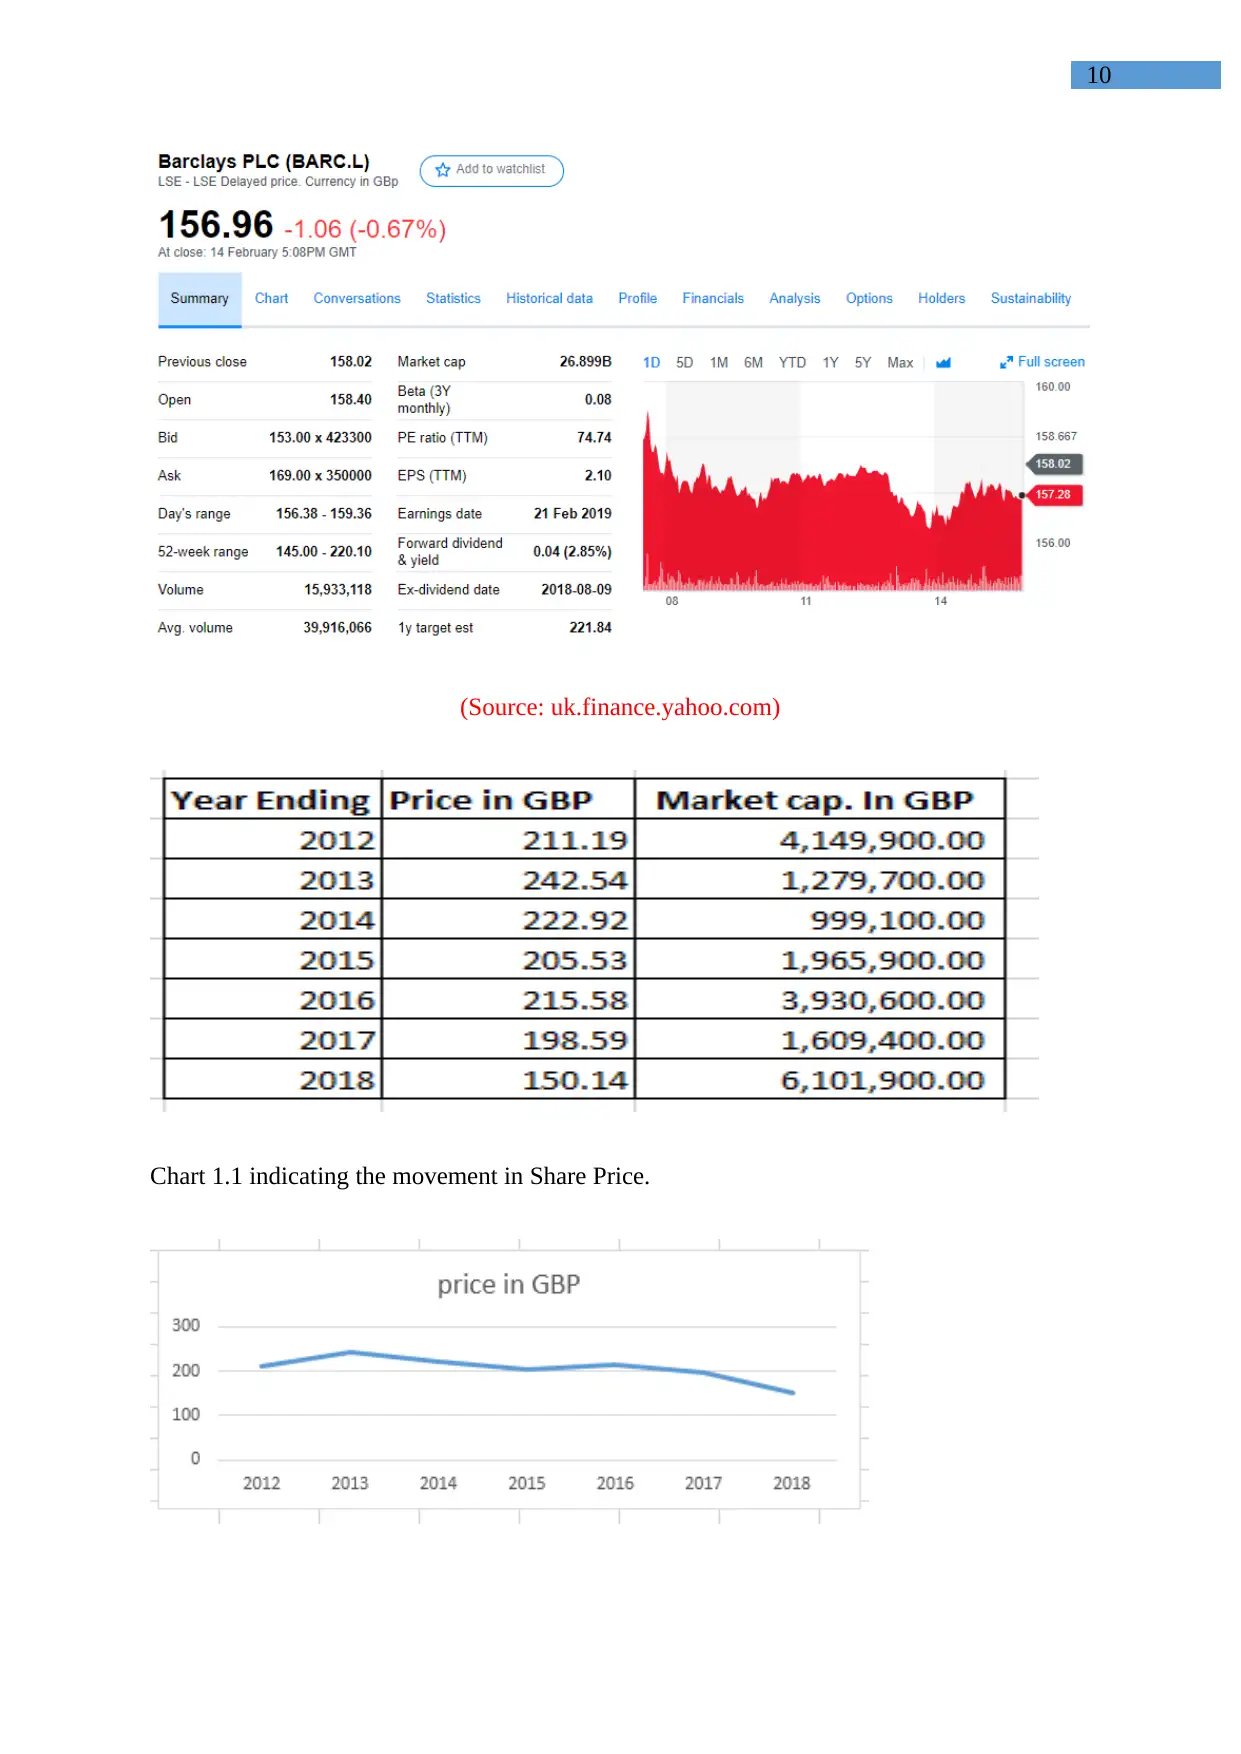
4.1 Using Price And Market Capitalization of The Company:
Table showing statistics of past five years Share price and Market Capitalization.
3.3 Valuation Based on P/E Ratio:
Interpretation: The P/E ratio indicates the extra amount an investor is going to pay for the
acquisition of the share at market price over and above its value under above method. The
higher ratio indicates the share price of the stock is more relative to the company’s earning
i.e. an increase in the Earning Per share of the stock will result in the upward movement in
the stock price. The higher ratio indicates that stock is overvalued and a lower ratio indicates
that the stock is undervalued but relying on only, the P/E ratio for investing purpose is not a
good idea because other circumstances affecting assumptions of the P/E ratio shall be viewed
accordingly for a rational investment decision (Pástor and Pietro 2003).
4. Past performance Analysis:
4.1 Using Price And Market Capitalization of The Company:
Table showing statistics of past five years Share price and Market Capitalization.
Paraphrase This Document
Need a fresh take? Get an instant paraphrase of this document with our AI Paraphraser
10
(Source: uk.finance.yahoo.com)
Chart 1.1 indicating the movement in Share Price.
(Source: uk.finance.yahoo.com)
Chart 1.1 indicating the movement in Share Price.
11
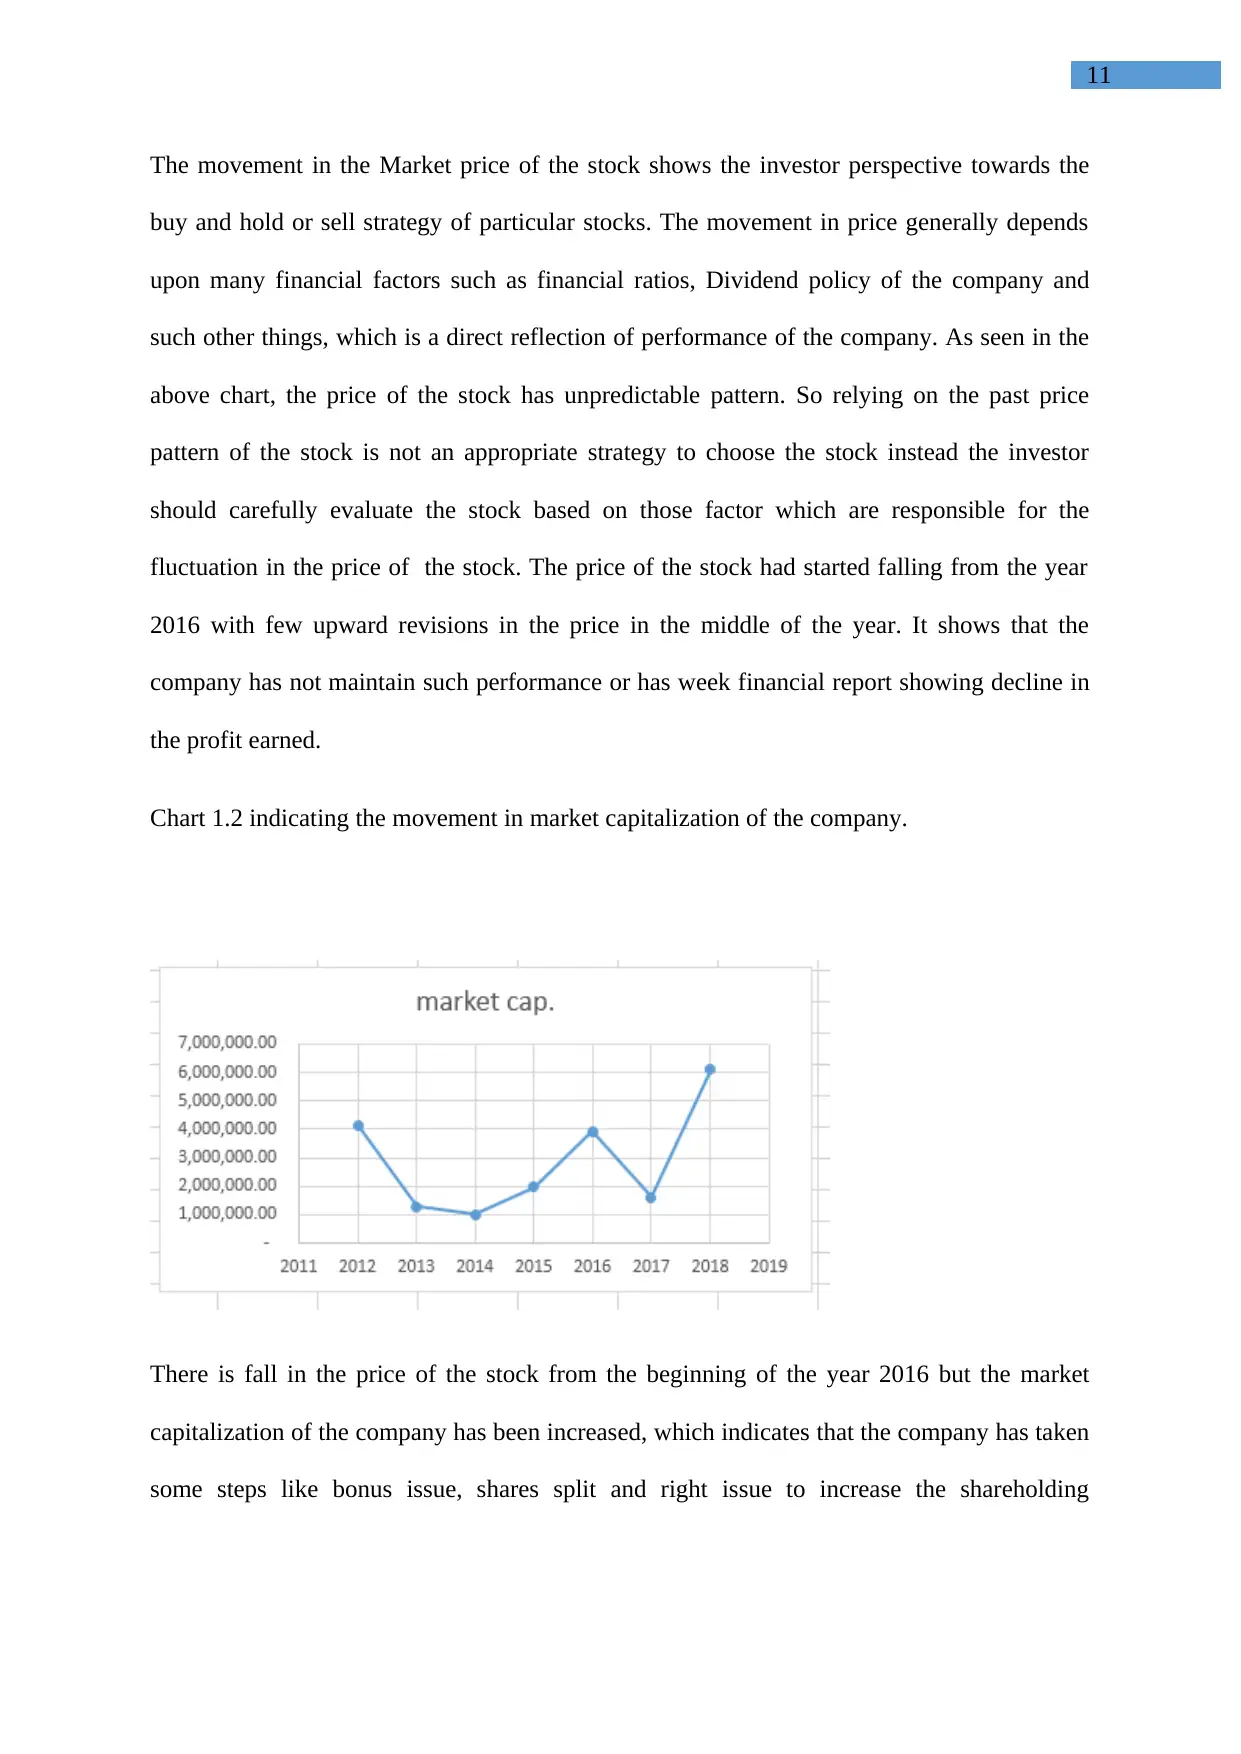
The movement in the Market price of the stock shows the investor perspective towards the
buy and hold or sell strategy of particular stocks. The movement in price generally depends
upon many financial factors such as financial ratios, Dividend policy of the company and
such other things, which is a direct reflection of performance of the company. As seen in the
above chart, the price of the stock has unpredictable pattern. So relying on the past price
pattern of the stock is not an appropriate strategy to choose the stock instead the investor
should carefully evaluate the stock based on those factor which are responsible for the
fluctuation in the price of the stock. The price of the stock had started falling from the year
2016 with few upward revisions in the price in the middle of the year. It shows that the
company has not maintain such performance or has week financial report showing decline in
the profit earned.
Chart 1.2 indicating the movement in market capitalization of the company.
There is fall in the price of the stock from the beginning of the year 2016 but the market
capitalization of the company has been increased, which indicates that the company has taken
some steps like bonus issue, shares split and right issue to increase the shareholding
⊘ This is a preview!⊘
Do you want full access?
Subscribe today to unlock all pages.
Trusted by 1+ million students worldwide
1 out of 19
Related Documents


Your All-in-One AI-Powered Toolkit for Academic Success.
+13062052269
info@desklib.com
Available 24*7 on WhatsApp / Email
![[object Object]](/_next/static/media/star-bottom.7253800d.svg)
Unlock your academic potential
Copyright © 2020–2025 A2Z Services. All Rights Reserved. Developed and managed by ZUCOL.