Vertical Analysis of Financial Statements MANAGEMENT AND ENTREPRENEURSHIP TABLE OF CONTENTS
24 Pages7209 Words325 Views
Added on 2020-06-05
About This Document
FINANCIAL ANALYSIS MANAGEMENT & ENTREPRENEURSHIP TABLE OF CONTENTS TASK 11 Vertical analysis of financial statements 1 Horizontal analysis of financial statements 3 Ratio analysis of financial statements 4 TASK 28 Analysing working capital of Walmart and Tesco 8 TASK 39 Critical analysis of annual cash flow of Walmart and Tesco for two financial periods9 Findings and Recommendations 10 REFERENCES 12 APPENDIX 14 Appendix 1: Vertical Balance sheet of Walmart company 141% Appendix 2: Vertical balance sheet of Tesco company15
Vertical Analysis of Financial Statements MANAGEMENT AND ENTREPRENEURSHIP TABLE OF CONTENTS
Added on 2020-06-05
ShareRelated Documents
FINANCIAL ANALYSIS
MANAGEMENT &
ENTREPRENEURSHIP
MANAGEMENT &
ENTREPRENEURSHIP
TABLE OF CONTENTS
TASK 1............................................................................................................................................1
Vertical analysis of financial statements................................................................................1
Horizontal analysis of financial statements............................................................................3
Ratio analysis of financial statements....................................................................................4
TASK 2............................................................................................................................................8
Analysing working capital of Walmart and Tesco.................................................................8
TASK 3............................................................................................................................................9
Critical analysis of annual cash flow of Walmart and Tesco for two financial periods.........9
Findings and Recommendations....................................................................................................10
REFERENCES..............................................................................................................................12
APPENDIX....................................................................................................................................14
Appendix 1: Vertical Balance sheet of Walmart company..................................................14
Appendix 2: Vertical balance sheet of Tesco company.......................................................15
Appendix 3: Horizontal Income statement of Walmart.......................................................17
Appendix 4: Horizontal Balance sheet of Walmart..............................................................18
Appendix 5: Horizontal Income statement of Tesco............................................................20
Appendix 6: Horizontal Balance sheet of Tesco..................................................................20
To,
Board of Directors
Asian Food Manufacturer
Date: 8th November 2017
Subject: Financial performance of Walmart and Tesco Plc
TASK 1
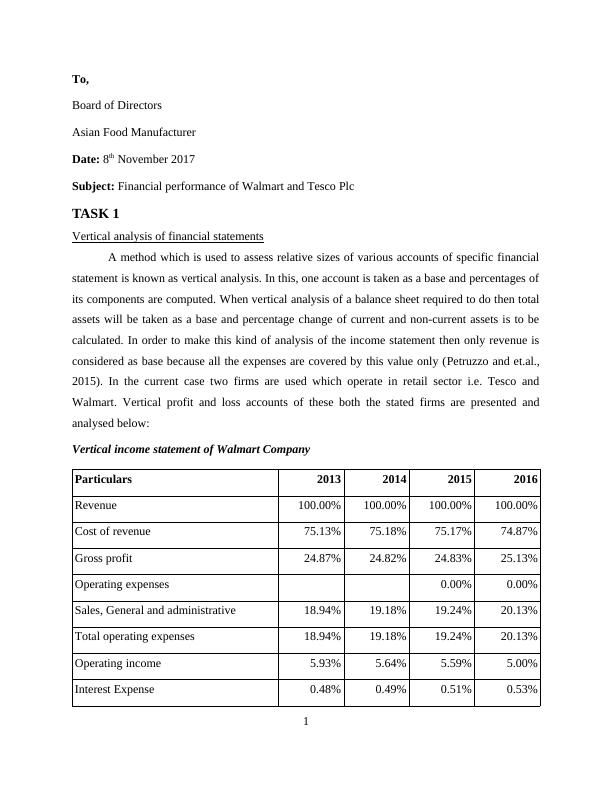
Vertical analysis of financial statements
A method which is used to assess relative sizes of various accounts of specific financial
statement is known as vertical analysis. In this, one account is taken as a base and percentages of
its components are computed. When vertical analysis of a balance sheet required to do then total
assets will be taken as a base and percentage change of current and non-current assets is to be
calculated. In order to make this kind of analysis of the income statement then only revenue is
considered as base because all the expenses are covered by this value only (Petruzzo and et.al.,
2015). In the current case two firms are used which operate in retail sector i.e. Tesco and
Walmart. Vertical profit and loss accounts of these both the stated firms are presented and
analysed below:
Vertical income statement of Walmart Company
Particulars 2013 2014 2015 2016
Revenue 100.00% 100.00% 100.00% 100.00%
Cost of revenue 75.13% 75.18% 75.17% 74.87%
Gross profit 24.87% 24.82% 24.83% 25.13%
Operating expenses 0.00% 0.00%
Sales, General and administrative 18.94% 19.18% 19.24% 20.13%
Total operating expenses 18.94% 19.18% 19.24% 20.13%
Operating income 5.93% 5.64% 5.59% 5.00%
Interest Expense 0.48% 0.49% 0.51% 0.53%
1
Board of Directors
Asian Food Manufacturer
Date: 8th November 2017
Subject: Financial performance of Walmart and Tesco Plc
TASK 1
Vertical analysis of financial statements
A method which is used to assess relative sizes of various accounts of specific financial
statement is known as vertical analysis. In this, one account is taken as a base and percentages of
its components are computed. When vertical analysis of a balance sheet required to do then total
assets will be taken as a base and percentage change of current and non-current assets is to be
calculated. In order to make this kind of analysis of the income statement then only revenue is
considered as base because all the expenses are covered by this value only (Petruzzo and et.al.,
2015). In the current case two firms are used which operate in retail sector i.e. Tesco and
Walmart. Vertical profit and loss accounts of these both the stated firms are presented and
analysed below:
Vertical income statement of Walmart Company
Particulars 2013 2014 2015 2016
Revenue 100.00% 100.00% 100.00% 100.00%
Cost of revenue 75.13% 75.18% 75.17% 74.87%
Gross profit 24.87% 24.82% 24.83% 25.13%
Operating expenses 0.00% 0.00%
Sales, General and administrative 18.94% 19.18% 19.24% 20.13%
Total operating expenses 18.94% 19.18% 19.24% 20.13%
Operating income 5.93% 5.64% 5.59% 5.00%
Interest Expense 0.48% 0.49% 0.51% 0.53%
1
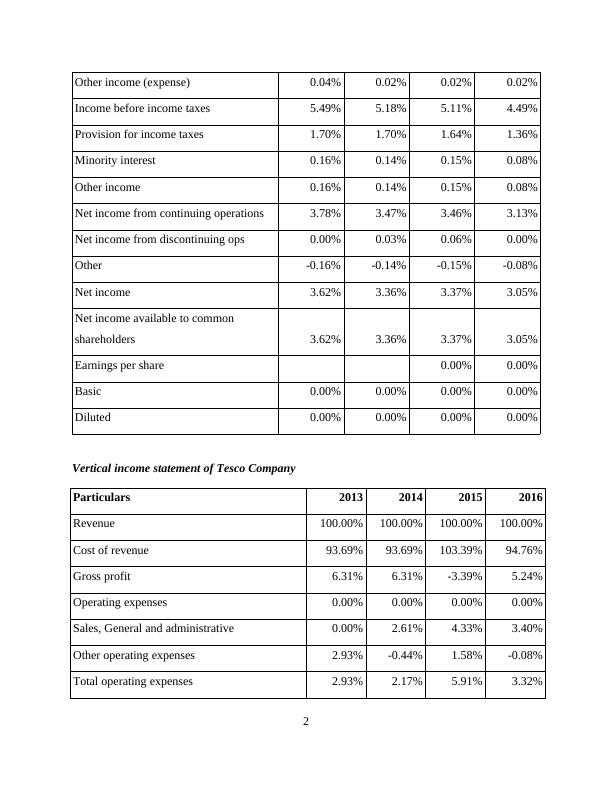
Other income (expense) 0.04% 0.02% 0.02% 0.02%
Income before income taxes 5.49% 5.18% 5.11% 4.49%
Provision for income taxes 1.70% 1.70% 1.64% 1.36%
Minority interest 0.16% 0.14% 0.15% 0.08%
Other income 0.16% 0.14% 0.15% 0.08%
Net income from continuing operations 3.78% 3.47% 3.46% 3.13%
Net income from discontinuing ops 0.00% 0.03% 0.06% 0.00%
Other -0.16% -0.14% -0.15% -0.08%
Net income 3.62% 3.36% 3.37% 3.05%
Net income available to common
shareholders 3.62% 3.36% 3.37% 3.05%
Earnings per share 0.00% 0.00%
Basic 0.00% 0.00% 0.00% 0.00%
Diluted 0.00% 0.00% 0.00% 0.00%
Vertical income statement of Tesco Company
Particulars 2013 2014 2015 2016
Revenue 100.00% 100.00% 100.00% 100.00%
Cost of revenue 93.69% 93.69% 103.39% 94.76%
Gross profit 6.31% 6.31% -3.39% 5.24%
Operating expenses 0.00% 0.00% 0.00% 0.00%
Sales, General and administrative 0.00% 2.61% 4.33% 3.40%
Other operating expenses 2.93% -0.44% 1.58% -0.08%
Total operating expenses 2.93% 2.17% 5.91% 3.32%
2
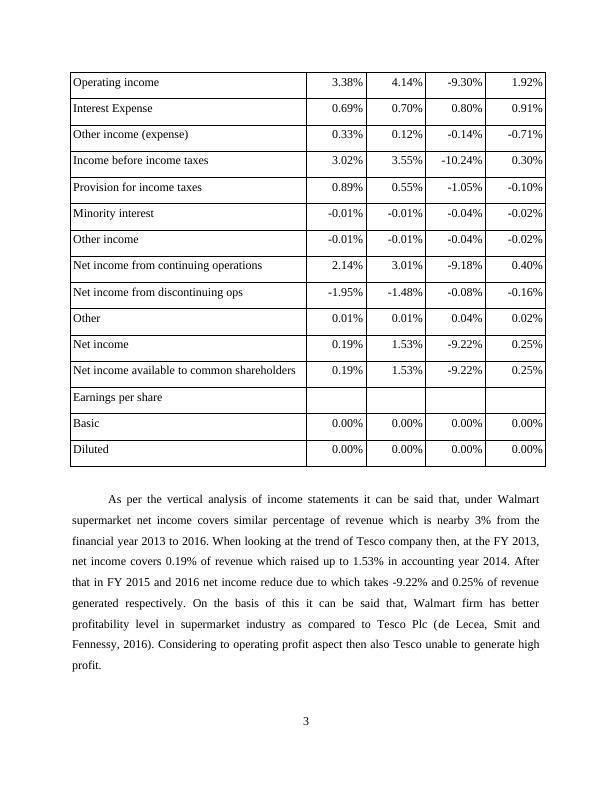
Operating income 3.38% 4.14% -9.30% 1.92%
Interest Expense 0.69% 0.70% 0.80% 0.91%
Other income (expense) 0.33% 0.12% -0.14% -0.71%
Income before income taxes 3.02% 3.55% -10.24% 0.30%
Provision for income taxes 0.89% 0.55% -1.05% -0.10%
Minority interest -0.01% -0.01% -0.04% -0.02%
Other income -0.01% -0.01% -0.04% -0.02%
Net income from continuing operations 2.14% 3.01% -9.18% 0.40%
Net income from discontinuing ops -1.95% -1.48% -0.08% -0.16%
Other 0.01% 0.01% 0.04% 0.02%
Net income 0.19% 1.53% -9.22% 0.25%
Net income available to common shareholders 0.19% 1.53% -9.22% 0.25%
Earnings per share
Basic 0.00% 0.00% 0.00% 0.00%
Diluted 0.00% 0.00% 0.00% 0.00%
As per the vertical analysis of income statements it can be said that, under Walmart
supermarket net income covers similar percentage of revenue which is nearby 3% from the
financial year 2013 to 2016. When looking at the trend of Tesco company then, at the FY 2013,
net income covers 0.19% of revenue which raised up to 1.53% in accounting year 2014. After
that in FY 2015 and 2016 net income reduce due to which takes -9.22% and 0.25% of revenue
generated respectively. On the basis of this it can be said that, Walmart firm has better
profitability level in supermarket industry as compared to Tesco Plc (de Lecea, Smit and
Fennessy, 2016). Considering to operating profit aspect then also Tesco unable to generate high
profit.
3
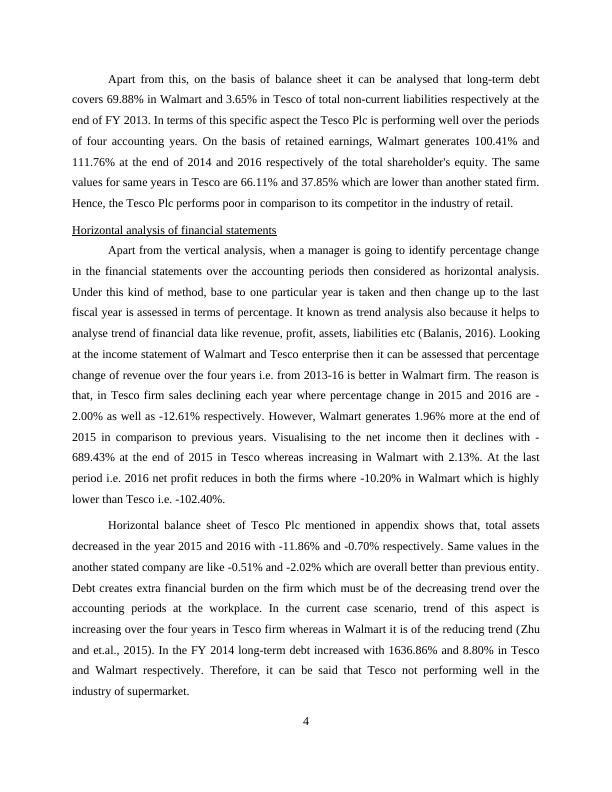
Apart from this, on the basis of balance sheet it can be analysed that long-term debt
covers 69.88% in Walmart and 3.65% in Tesco of total non-current liabilities respectively at the
end of FY 2013. In terms of this specific aspect the Tesco Plc is performing well over the periods
of four accounting years. On the basis of retained earnings, Walmart generates 100.41% and
111.76% at the end of 2014 and 2016 respectively of the total shareholder's equity. The same
values for same years in Tesco are 66.11% and 37.85% which are lower than another stated firm.
Hence, the Tesco Plc performs poor in comparison to its competitor in the industry of retail.
Horizontal analysis of financial statements
Apart from the vertical analysis, when a manager is going to identify percentage change
in the financial statements over the accounting periods then considered as horizontal analysis.
Under this kind of method, base to one particular year is taken and then change up to the last
fiscal year is assessed in terms of percentage. It known as trend analysis also because it helps to
analyse trend of financial data like revenue, profit, assets, liabilities etc (Balanis, 2016). Looking
at the income statement of Walmart and Tesco enterprise then it can be assessed that percentage
change of revenue over the four years i.e. from 2013-16 is better in Walmart firm. The reason is
that, in Tesco firm sales declining each year where percentage change in 2015 and 2016 are -
2.00% as well as -12.61% respectively. However, Walmart generates 1.96% more at the end of
2015 in comparison to previous years. Visualising to the net income then it declines with -
689.43% at the end of 2015 in Tesco whereas increasing in Walmart with 2.13%. At the last
period i.e. 2016 net profit reduces in both the firms where -10.20% in Walmart which is highly
lower than Tesco i.e. -102.40%.
Horizontal balance sheet of Tesco Plc mentioned in appendix shows that, total assets
decreased in the year 2015 and 2016 with -11.86% and -0.70% respectively. Same values in the
another stated company are like -0.51% and -2.02% which are overall better than previous entity.
Debt creates extra financial burden on the firm which must be of the decreasing trend over the
accounting periods at the workplace. In the current case scenario, trend of this aspect is
increasing over the four years in Tesco firm whereas in Walmart it is of the reducing trend (Zhu
and et.al., 2015). In the FY 2014 long-term debt increased with 1636.86% and 8.80% in Tesco
and Walmart respectively. Therefore, it can be said that Tesco not performing well in the
industry of supermarket.
4
End of preview
Want to access all the pages? Upload your documents or become a member.