In-Depth Financial Analysis of Better Homes Ltd: A Detailed Report
VerifiedAdded on 2023/06/13
|8
|1478
|295
Report
AI Summary
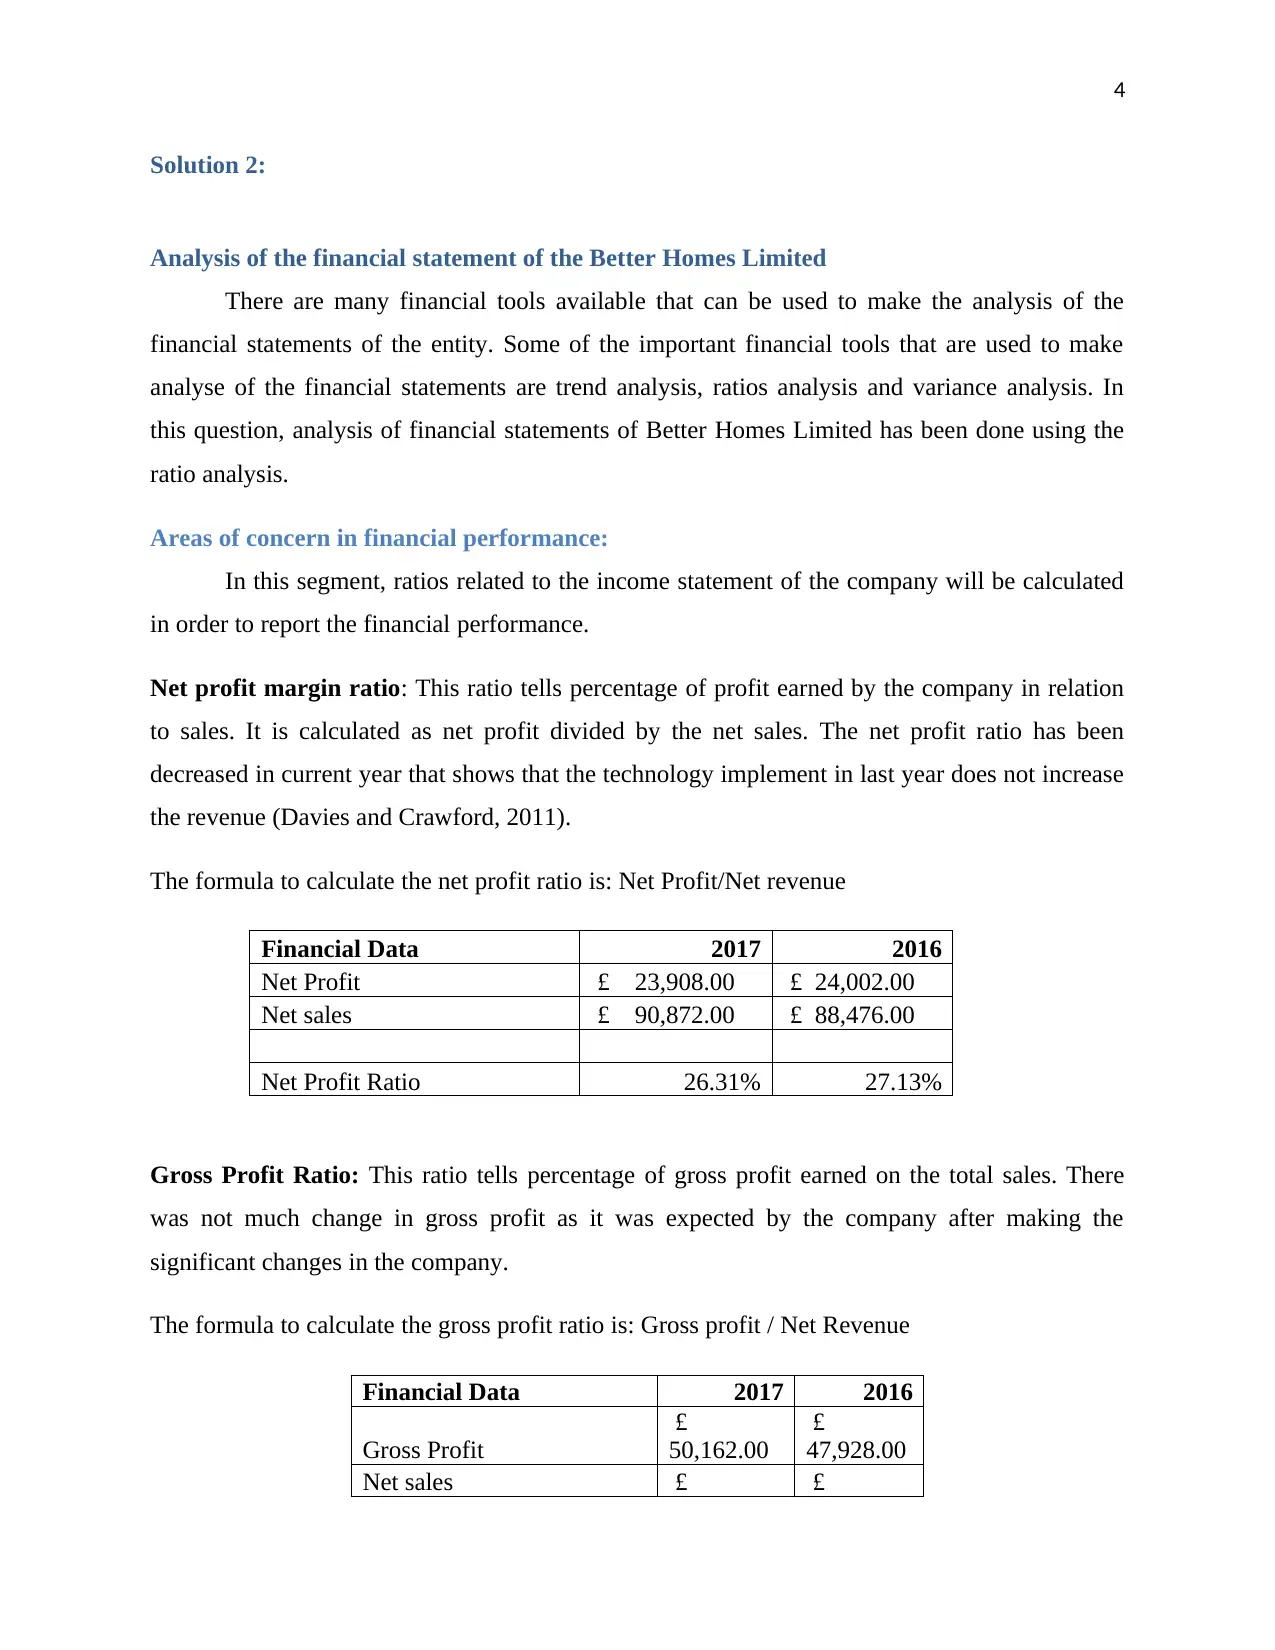
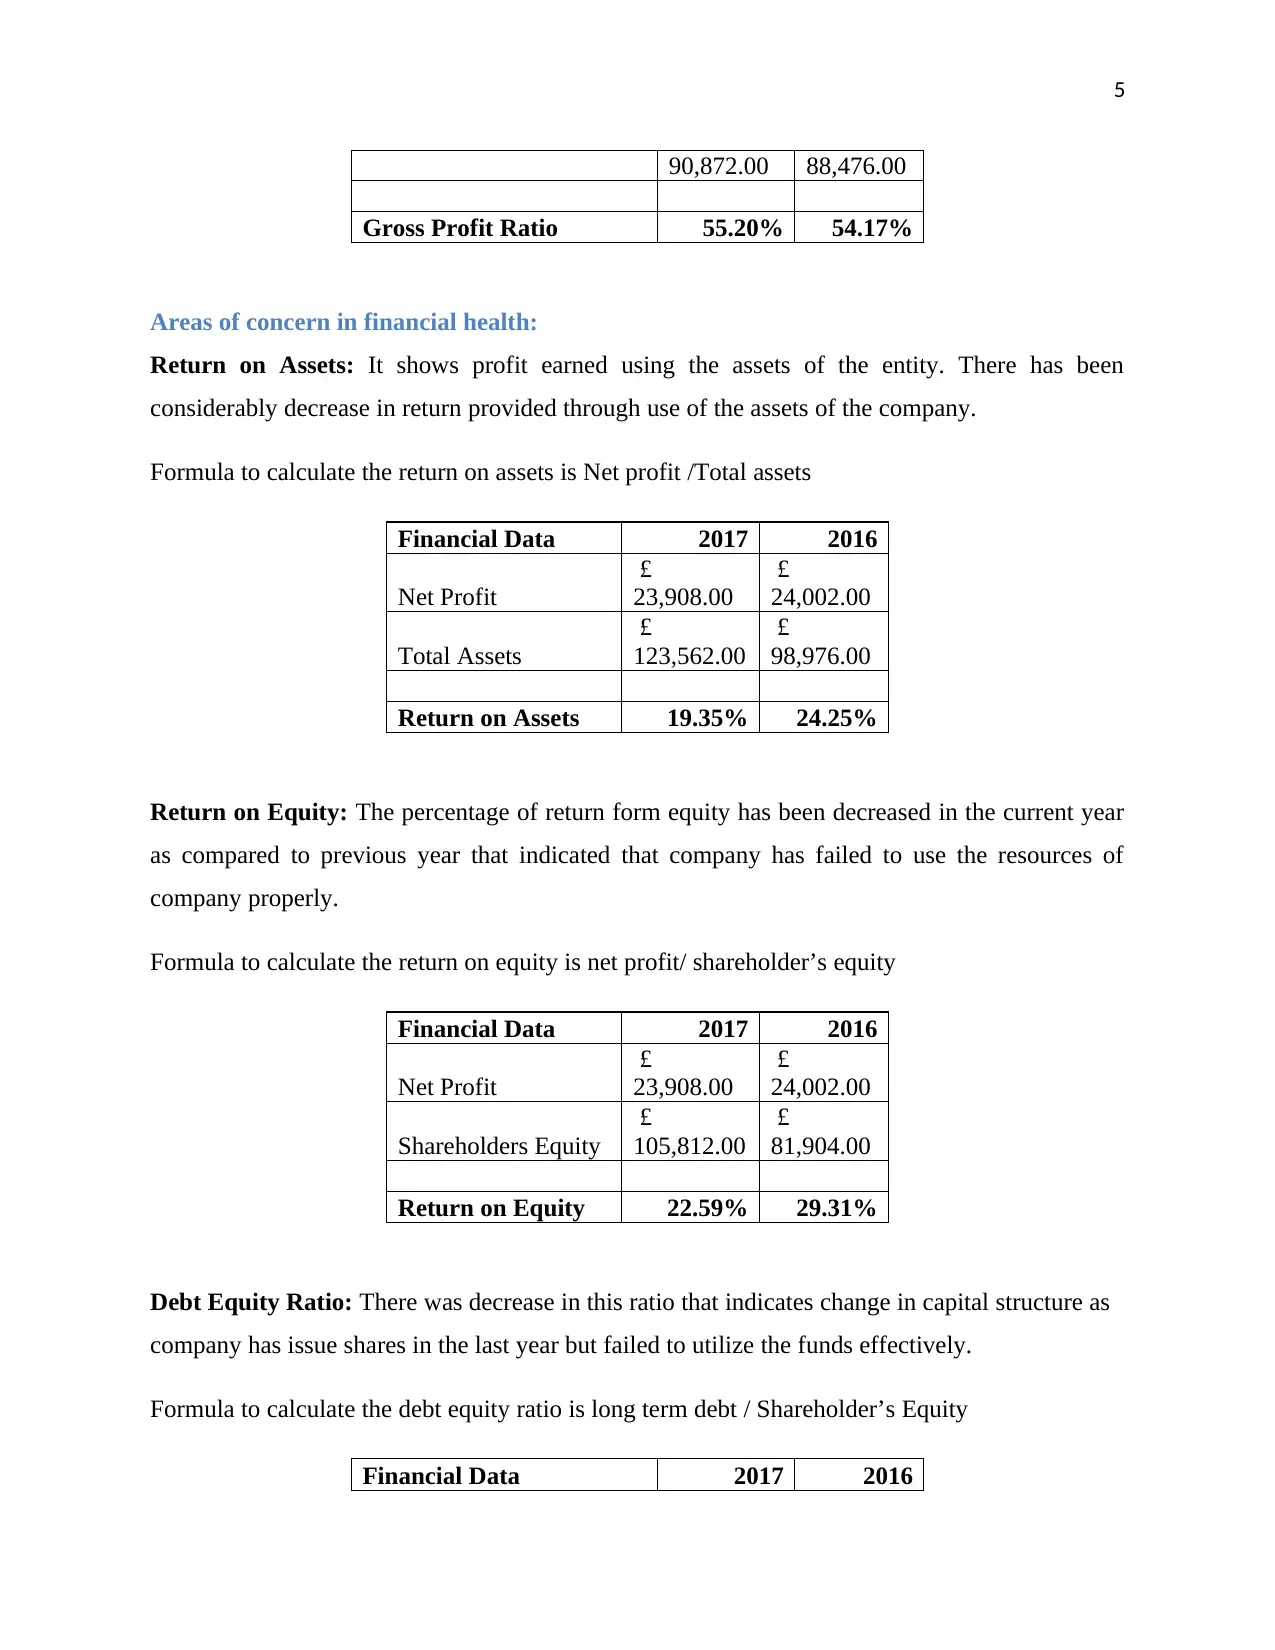
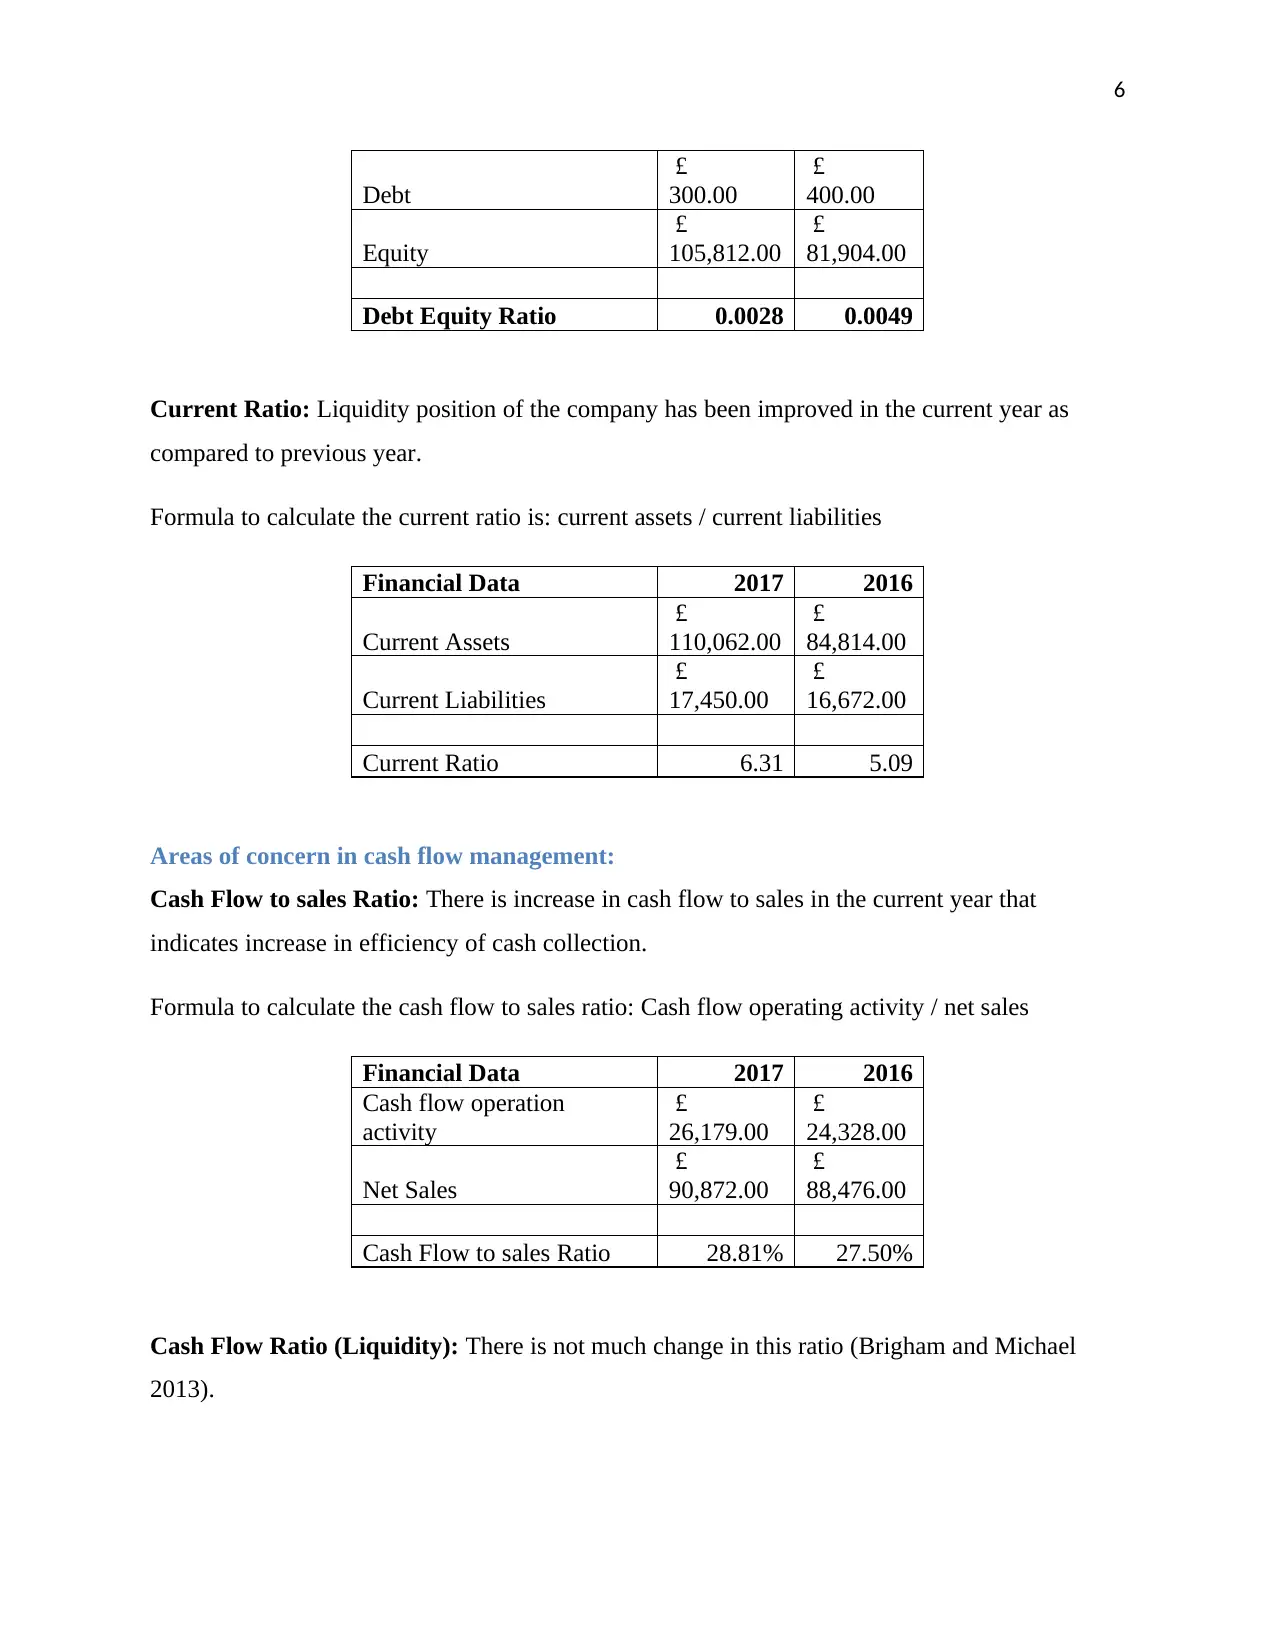
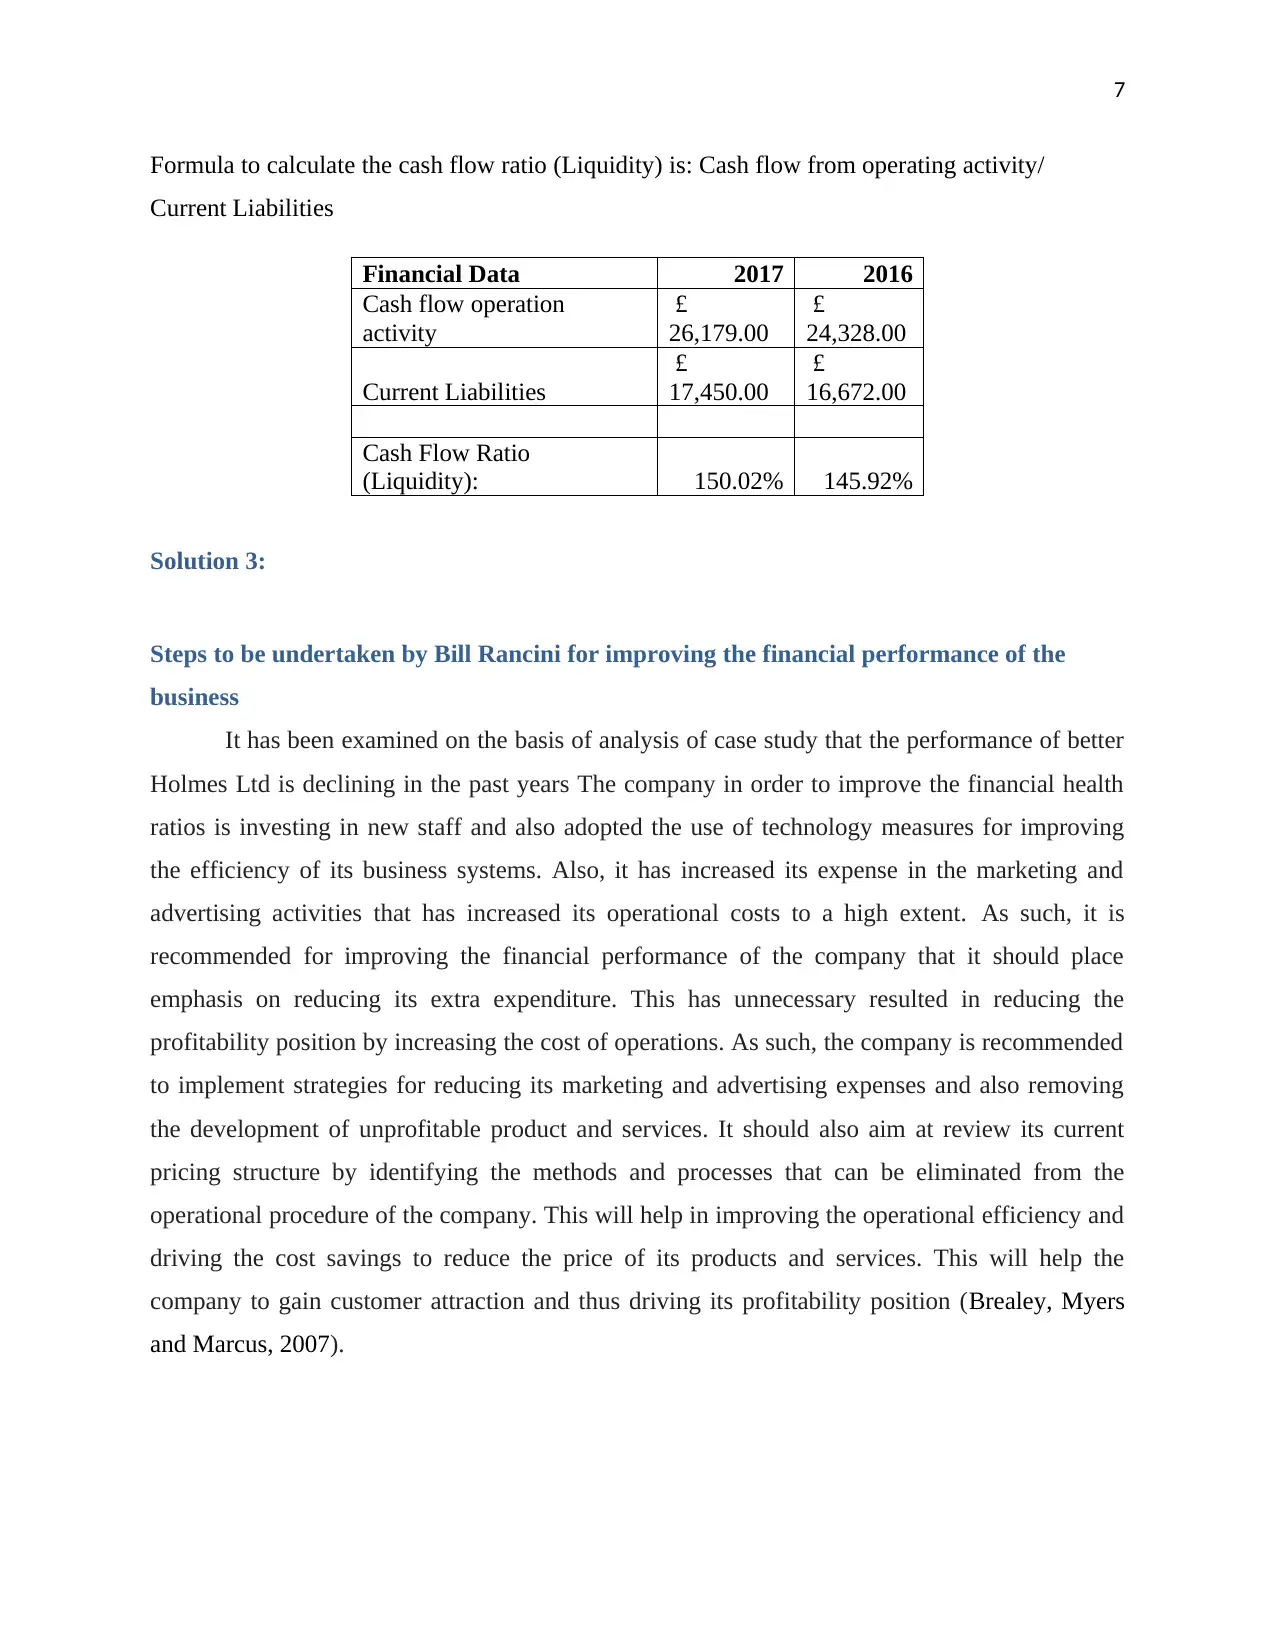
This report provides a detailed financial analysis of Better Homes Ltd, examining the usefulness of the income statement, balance sheet, and cash flow statement for the company. It analyzes the company's financial performance, health, and cash flow management using ratio analysis, identifying areas of concern such as declining net profit margin, return on assets, and return on equity. The report also assesses the concerns of Bill Rancini’s parents regarding the company's performance in the past year and suggests practical steps for improving the financial performance of the business, including reducing extra expenditure, reviewing the pricing structure, and focusing on cost savings to enhance profitability. This document is available on Desklib, where students can find a wide range of study resources, including past papers and solved assignments.
1 out of 8
Related Documents


Your All-in-One AI-Powered Toolkit for Academic Success.
+13062052269
info@desklib.com
Available 24*7 on WhatsApp / Email
![[object Object]](/_next/static/media/star-bottom.7253800d.svg)
Copyright © 2020–2026 A2Z Services. All Rights Reserved. Developed and managed by ZUCOL.