FNCE 2013: Analyzing Canadian Tire and Hudson's Bay Financials
VerifiedAdded on 2023/06/15
|12
|1593
|431
Report
AI Summary
This report provides a comparative financial analysis of Canadian Tire and Hudson's Bay, based on their financial statements. It includes a two-year horizontal analysis of total revenues, sales per common share, and gross profit margin percentage. The analysis also covers key financial ratios for the most recent year, including earnings per share, price to earnings, dividend yield, dividend coverage, return on assets, return on common equity, and debt to equity. The report concludes that Canadian Tire is a better investment option than Hudson's Bay due to its positive income, better returns on equity and assets, and lower leverage.

Running head: FINANCE
Finance
Name of the student
Name of the university
Student ID
Author note
Finance
Name of the student
Name of the university
Student ID
Author note
Paraphrase This Document
Need a fresh take? Get an instant paraphrase of this document with our AI Paraphraser

1FINANCE
Table of Contents
Introduction................................................................................................................................2
2 year horizontal analysis...........................................................................................................2
Ratio analysis.............................................................................................................................4
Conclusion and recommendation...............................................................................................5
Reference....................................................................................................................................7
Appendix....................................................................................................................................8

2FINANCE
Introduction
Canadian Tire is the retail organization that offers wide range of services and products
through the retail banners portfolio in Canada. The retail segment of the company operates
the retail tire stores foe general merchandise with the availability of units in playing, fixing,
automotive, living, and automotive and the seasonal divisions (Canadiantire.ca 2018). On the
other hand, Hudson’s Bay is the fur trading retail business in Canada that operates and owns
retail stores in United States, Canada and few parts of Europe that includes Belgium. The
company is committed to education, promotion and preservation of the maintenance of the
company’s history and the Corporate Art, Image, reference collection and Artifact
(Thebay.com/webapp/wcs/stores/servlet/en/thebay 2018).
2 year horizontal analysis
Particular
Canadian Tire Hudson's Bay
2015 2016
Changes
(%) 2015 2016
Changes
(%)
Total revenue $12,279.60 $ 12,681.00 3.27% $ 11,162.00 $14,455.00 29.50%
Cost of goods sold $ 8,144.30 $ 8,288.50 1.77% $ 6,638.00 $ 8,481.00 27.76%
Gross profit margin $ 4,135.30 $ 4,392.50 6.22% $ 4,524.00 $ 5,974.00 32.05%
Gross profit margin
percentage 33.68% 34.64% 2.86% 40.53% 41.33% 1.97%
Number of shares
outstanding 76151321 72360303 -4.98% 182100001 182251145 0.08%
Sales per common
share $ 161.25 $ 175.25 8.68% $ 61.30 $ 79.31 29.39%
⊘ This is a preview!⊘
Do you want full access?
Subscribe today to unlock all pages.
Trusted by 1+ million students worldwide

3FINANCE
Total
revenue
Gross profit
margin
Sales per
common
share
0.00%
5.00%
10.00%
15.00%
20.00%
25.00%
30.00%
35.00%
Canadian Tire
Hudson's Bay
Total revenues – from the above table and chart it can be recognised that the revenue of
Canadian Tire has been increased by 3.27% over the year from 2015 to 2016. On the other
hand the revenue of Hudson’s Bay has been increased by 29.50% over the year from 2015 to
2016. Therefore, the increase percentage of revenue for Hudson’s Bay is better as compared
to Canadian Tire.
Sales per common share – the sales per common share for Canadian Tire were C$ 161.25 in
2015 and it increased to $ 175.25 in 2016. Therefore, it increased by 8.68% over the year. On
the other hand, the sales per common share for Hudson’s Bay were C$ 61.30 in 2015 and it
increased to $ 79.31 in 2016. Therefore, it increased by 29.39% over the year. Therefore, the
growth rate of the sales per common share for Hudson’s Bay is better as compared to
Canadian Tire (Hofmann and Lampe 2013).
Gross profit margin percentage – the gross profit margin for Canadian Tire were 33.68% in
2015 and it increased to $ 34.64% in 2016. Therefore, it increased by 2.86% over the year.
On the other hand, the gross profit margin for Hudson’s Bay was 40.53% in 2015 and it
increased to 41.33% in 2016. Therefore, it increased by 1.97% over the year. Therefore, the
Paraphrase This Document
Need a fresh take? Get an instant paraphrase of this document with our AI Paraphraser
4FINANCE
growth rate of the gross profit margin for Canadian Tire is better as compared to Hudson’s
Bay.
Ratio analysis
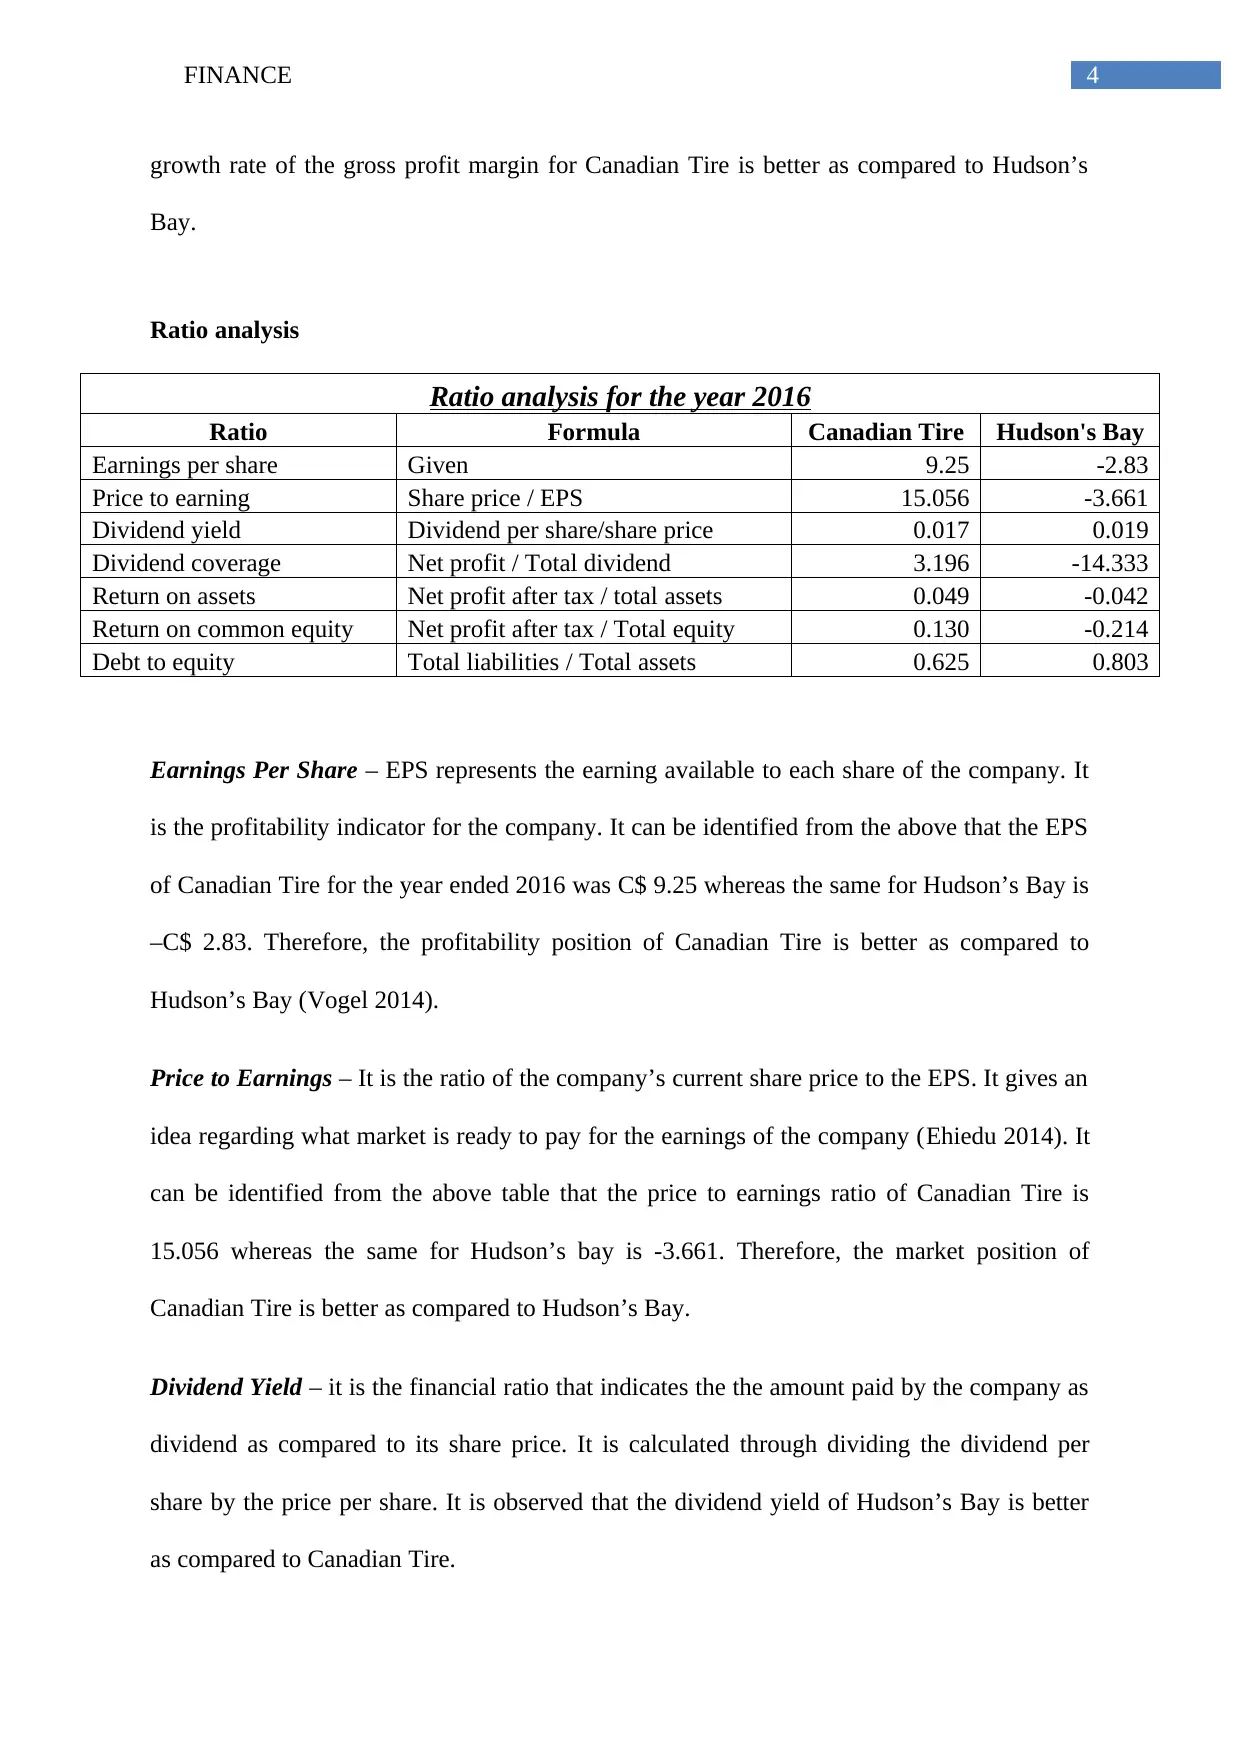
Ratio analysis for the year 2016
Ratio Formula Canadian Tire Hudson's Bay
Earnings per share Given 9.25 -2.83
Price to earning Share price / EPS 15.056 -3.661
Dividend yield Dividend per share/share price 0.017 0.019
Dividend coverage Net profit / Total dividend 3.196 -14.333
Return on assets Net profit after tax / total assets 0.049 -0.042
Return on common equity Net profit after tax / Total equity 0.130 -0.214
Debt to equity Total liabilities / Total assets 0.625 0.803
Earnings Per Share – EPS represents the earning available to each share of the company. It
is the profitability indicator for the company. It can be identified from the above that the EPS
of Canadian Tire for the year ended 2016 was C$ 9.25 whereas the same for Hudson’s Bay is
–C$ 2.83. Therefore, the profitability position of Canadian Tire is better as compared to
Hudson’s Bay (Vogel 2014).
Price to Earnings – It is the ratio of the company’s current share price to the EPS. It gives an
idea regarding what market is ready to pay for the earnings of the company (Ehiedu 2014). It
can be identified from the above table that the price to earnings ratio of Canadian Tire is
15.056 whereas the same for Hudson’s bay is -3.661. Therefore, the market position of
Canadian Tire is better as compared to Hudson’s Bay.
Dividend Yield – it is the financial ratio that indicates the the amount paid by the company as
dividend as compared to its share price. It is calculated through dividing the dividend per
share by the price per share. It is observed that the dividend yield of Hudson’s Bay is better
as compared to Canadian Tire.
growth rate of the gross profit margin for Canadian Tire is better as compared to Hudson’s
Bay.
Ratio analysis
Ratio analysis for the year 2016
Ratio Formula Canadian Tire Hudson's Bay
Earnings per share Given 9.25 -2.83
Price to earning Share price / EPS 15.056 -3.661
Dividend yield Dividend per share/share price 0.017 0.019
Dividend coverage Net profit / Total dividend 3.196 -14.333
Return on assets Net profit after tax / total assets 0.049 -0.042
Return on common equity Net profit after tax / Total equity 0.130 -0.214
Debt to equity Total liabilities / Total assets 0.625 0.803
Earnings Per Share – EPS represents the earning available to each share of the company. It
is the profitability indicator for the company. It can be identified from the above that the EPS
of Canadian Tire for the year ended 2016 was C$ 9.25 whereas the same for Hudson’s Bay is
–C$ 2.83. Therefore, the profitability position of Canadian Tire is better as compared to
Hudson’s Bay (Vogel 2014).
Price to Earnings – It is the ratio of the company’s current share price to the EPS. It gives an
idea regarding what market is ready to pay for the earnings of the company (Ehiedu 2014). It
can be identified from the above table that the price to earnings ratio of Canadian Tire is
15.056 whereas the same for Hudson’s bay is -3.661. Therefore, the market position of
Canadian Tire is better as compared to Hudson’s Bay.
Dividend Yield – it is the financial ratio that indicates the the amount paid by the company as
dividend as compared to its share price. It is calculated through dividing the dividend per
share by the price per share. It is observed that the dividend yield of Hudson’s Bay is better
as compared to Canadian Tire.

5FINANCE
Dividend Coverage (Payout Ratio) – it is the ratio for measuring the earning of company
over the dividend paid to the shareholders (Brigham and Ehrhardt 2013). It is calculated
through dividing the net profit attributable to the shareholders by total dividend paid. It can
be observed that the dividend coverage of Canadian Tire is significantly better as compared
to Hudson’s Bay as the net profit of Hudson’s Bay is in negative.
Return on Assets – it indicates the profitability of the company as compared to the total
assets. It states the efficiency of management with regard to usage of the assets for generating
earning (Lundholm and Sloan 2013). It can be observed that the return on assets of Canadian
Tire is significantly better as compared to Hudson’s Bay as the net profit of Hudson’s Bay is
in negative.
Return on Common Equity – it is the net income returned as the percentage of common
equity of the shareholders. It can be observed that the return on equity of Canadian Tire is
significantly better as compared to Hudson’s Bay as the net profit of Hudson’s Bay is in
negative (Vogel 2014).
Debt to Equity – this financial ratio indicates shareholder’s relative proportion of debt and
equity used by the company to finance its assets (Delen, Kuzey and Uyar 2013). The debt
portion of Hudson’s Bay is comparatively high as compared to Canadian Tire. Therefore,
Hudson’s Bay is more leveraged.
Conclusion and recommendation
It can be concluded from the above discussion that if both the companies are
compared then Canadian Tire shall be chosen for investment against Hudson’s Bay. The
reason behind this is that Hudson’s Bay was not able to earn any positive income and
therefore could not generate any earning on shareholders equity and assets of the company.
⊘ This is a preview!⊘
Do you want full access?
Subscribe today to unlock all pages.
Trusted by 1+ million students worldwide

6FINANCE
Further, as the debt equity ratio of Hudson’s Bay is higher than Canadian Tire, Hudson’s Bay
is more leveraged. Therefore, Canadian Tier is better option to invest as compared to
Hudson’s Bay
Further, as the debt equity ratio of Hudson’s Bay is higher than Canadian Tire, Hudson’s Bay
is more leveraged. Therefore, Canadian Tier is better option to invest as compared to
Hudson’s Bay
Paraphrase This Document
Need a fresh take? Get an instant paraphrase of this document with our AI Paraphraser

7FINANCE
Reference
Brigham, E.F. and Ehrhardt, M.C., 2013. Financial management: Theory & practice.
Cengage Learning.
Canadiantire.ca. 2018. Shop Canada’s Top Department Store Online & at 500+ Locations.
[online] Available at: http://www.canadiantire.ca/en.html [Accessed 14 Mar. 2018].
Delen, D., Kuzey, C. and Uyar, A., 2013. Measuring firm performance using financial ratios:
A decision tree approach. Expert Systems with Applications, 40(10), pp.3970-3983.
Ehiedu, V.C., 2014. The impact of liquidity on profitability of some selected companies: The
financial statement analysis (FSA) approach. Research Journal of Finance and
Accounting, 5(5), pp.81-90.
Hofmann, E. and Lampe, K., 2013. Financial statement analysis of logistics service
providers: ways of enhancing performance. International Journal of Physical Distribution &
Logistics Management, 43(4), pp.321-342.
Lundholm, R.J. and Sloan, R.G., 2013. Equity valuation and analysis with eVal. McGraw-
Hill Irwin.
Thebay.com/webapp/wcs/stores/servlet/en/thebay. 2018. Hudson's Bay. [online] Available at:
http://www.thebay.com/webapp/wcs/stores/servlet/en/thebay [Accessed 14 Mar. 2018].
Vogel, H.L., 2014. Entertainment industry economics: A guide for financial analysis.
Cambridge University Press.

8FINANCE
Appendix
Income statement of Canadian Tire
Balance sheet of Canadian Tire
Appendix
Income statement of Canadian Tire
Balance sheet of Canadian Tire
⊘ This is a preview!⊘
Do you want full access?
Subscribe today to unlock all pages.
Trusted by 1+ million students worldwide

9FINANCE
Paraphrase This Document
Need a fresh take? Get an instant paraphrase of this document with our AI Paraphraser

10FINANCE
Income statement of Hudson’s Bay
Balance sheet of Hudson’s Bay
Income statement of Hudson’s Bay
Balance sheet of Hudson’s Bay

11FINANCE
⊘ This is a preview!⊘
Do you want full access?
Subscribe today to unlock all pages.
Trusted by 1+ million students worldwide
1 out of 12
Your All-in-One AI-Powered Toolkit for Academic Success.
+13062052269
info@desklib.com
Available 24*7 on WhatsApp / Email
![[object Object]](/_next/static/media/star-bottom.7253800d.svg)
Unlock your academic potential
Copyright © 2020–2026 A2Z Services. All Rights Reserved. Developed and managed by ZUCOL.