Analyzing Stock Market Data for Financial Insights
VerifiedAdded on 2020/04/07
|13
|2173
|62
AI Summary
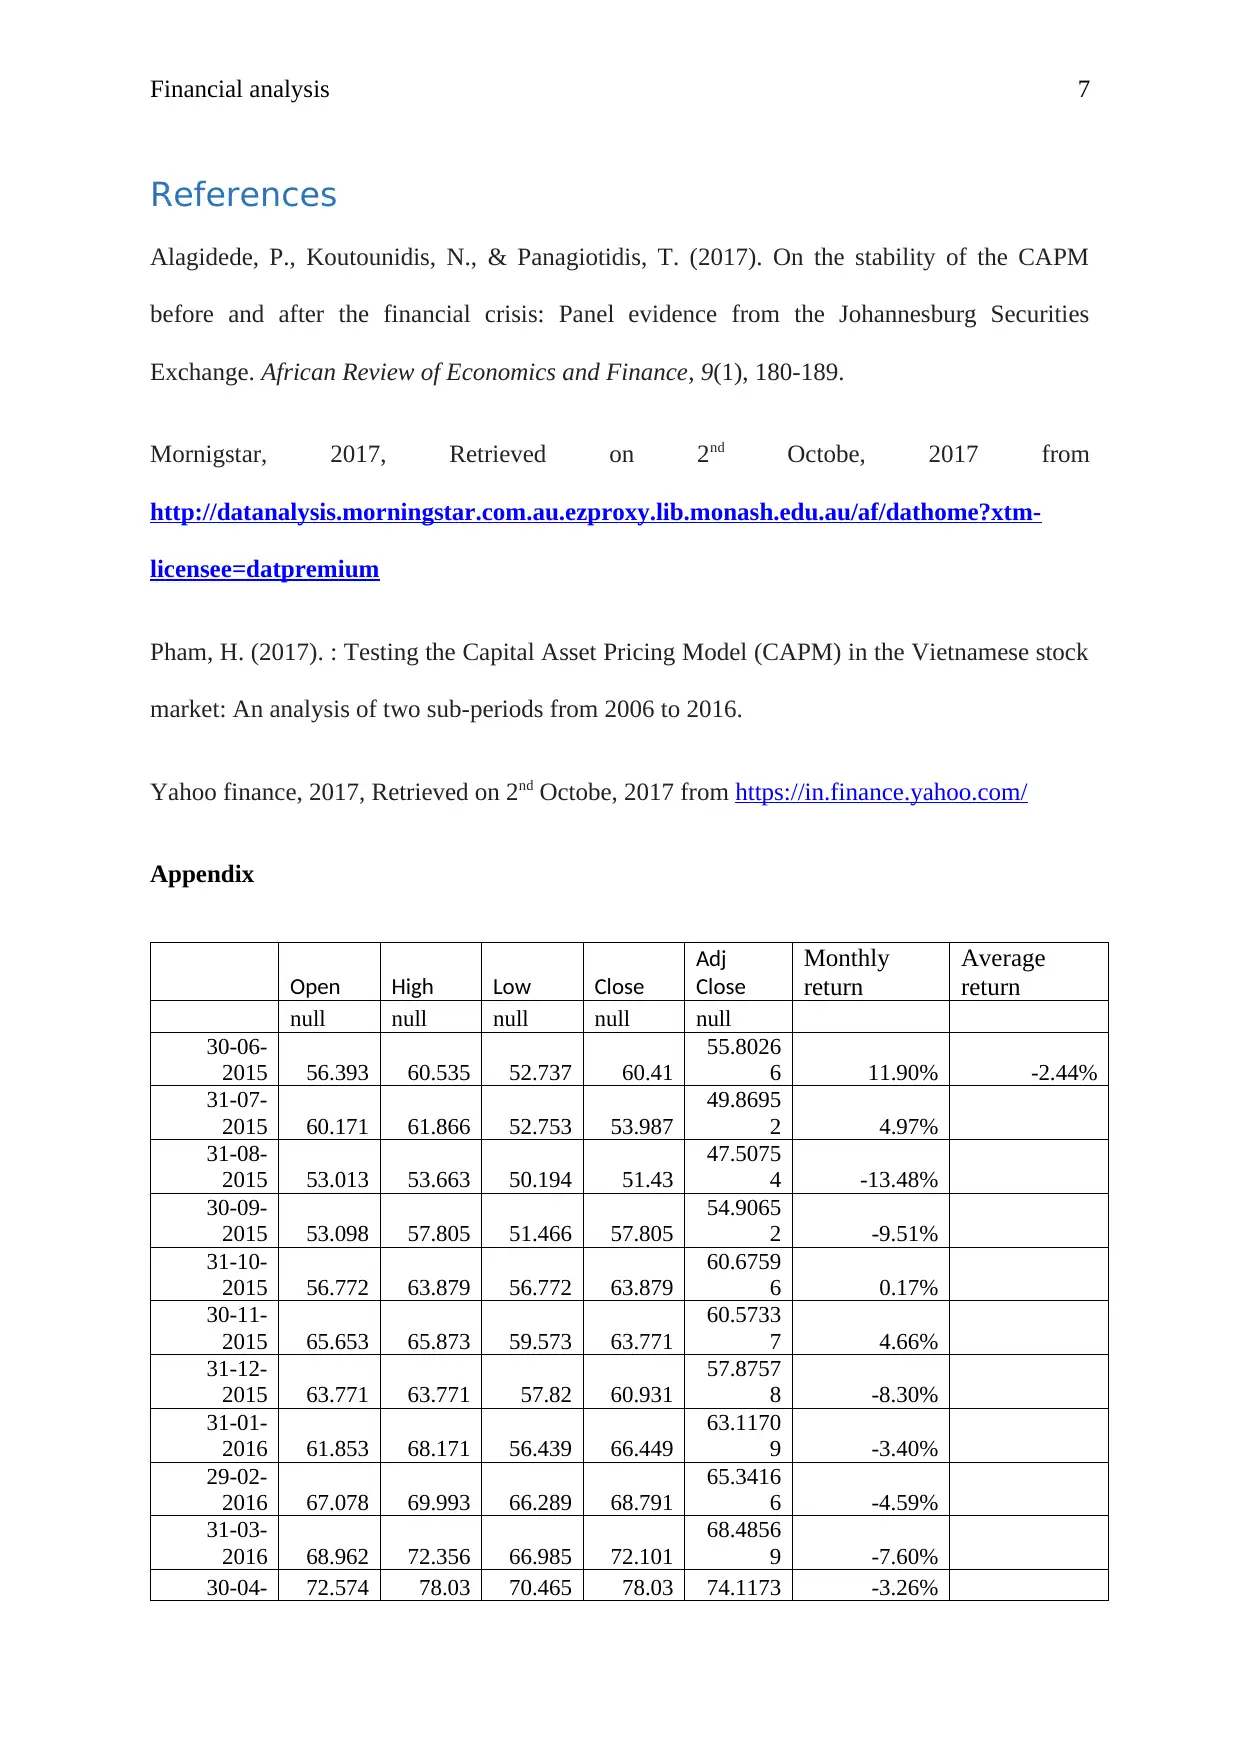
The task at hand is a comprehensive analysis of historical stock prices presented in two datasets. The first dataset displays individual daily stock metrics such as open, high, low, close, volume, adjusted close, and average prices over different dates from May 2015 to May 2017. This provides an opportunity to study market behavior on a granular level. Each date corresponds to specific financial values that can be used to calculate important financial indicators like daily returns or volatility.
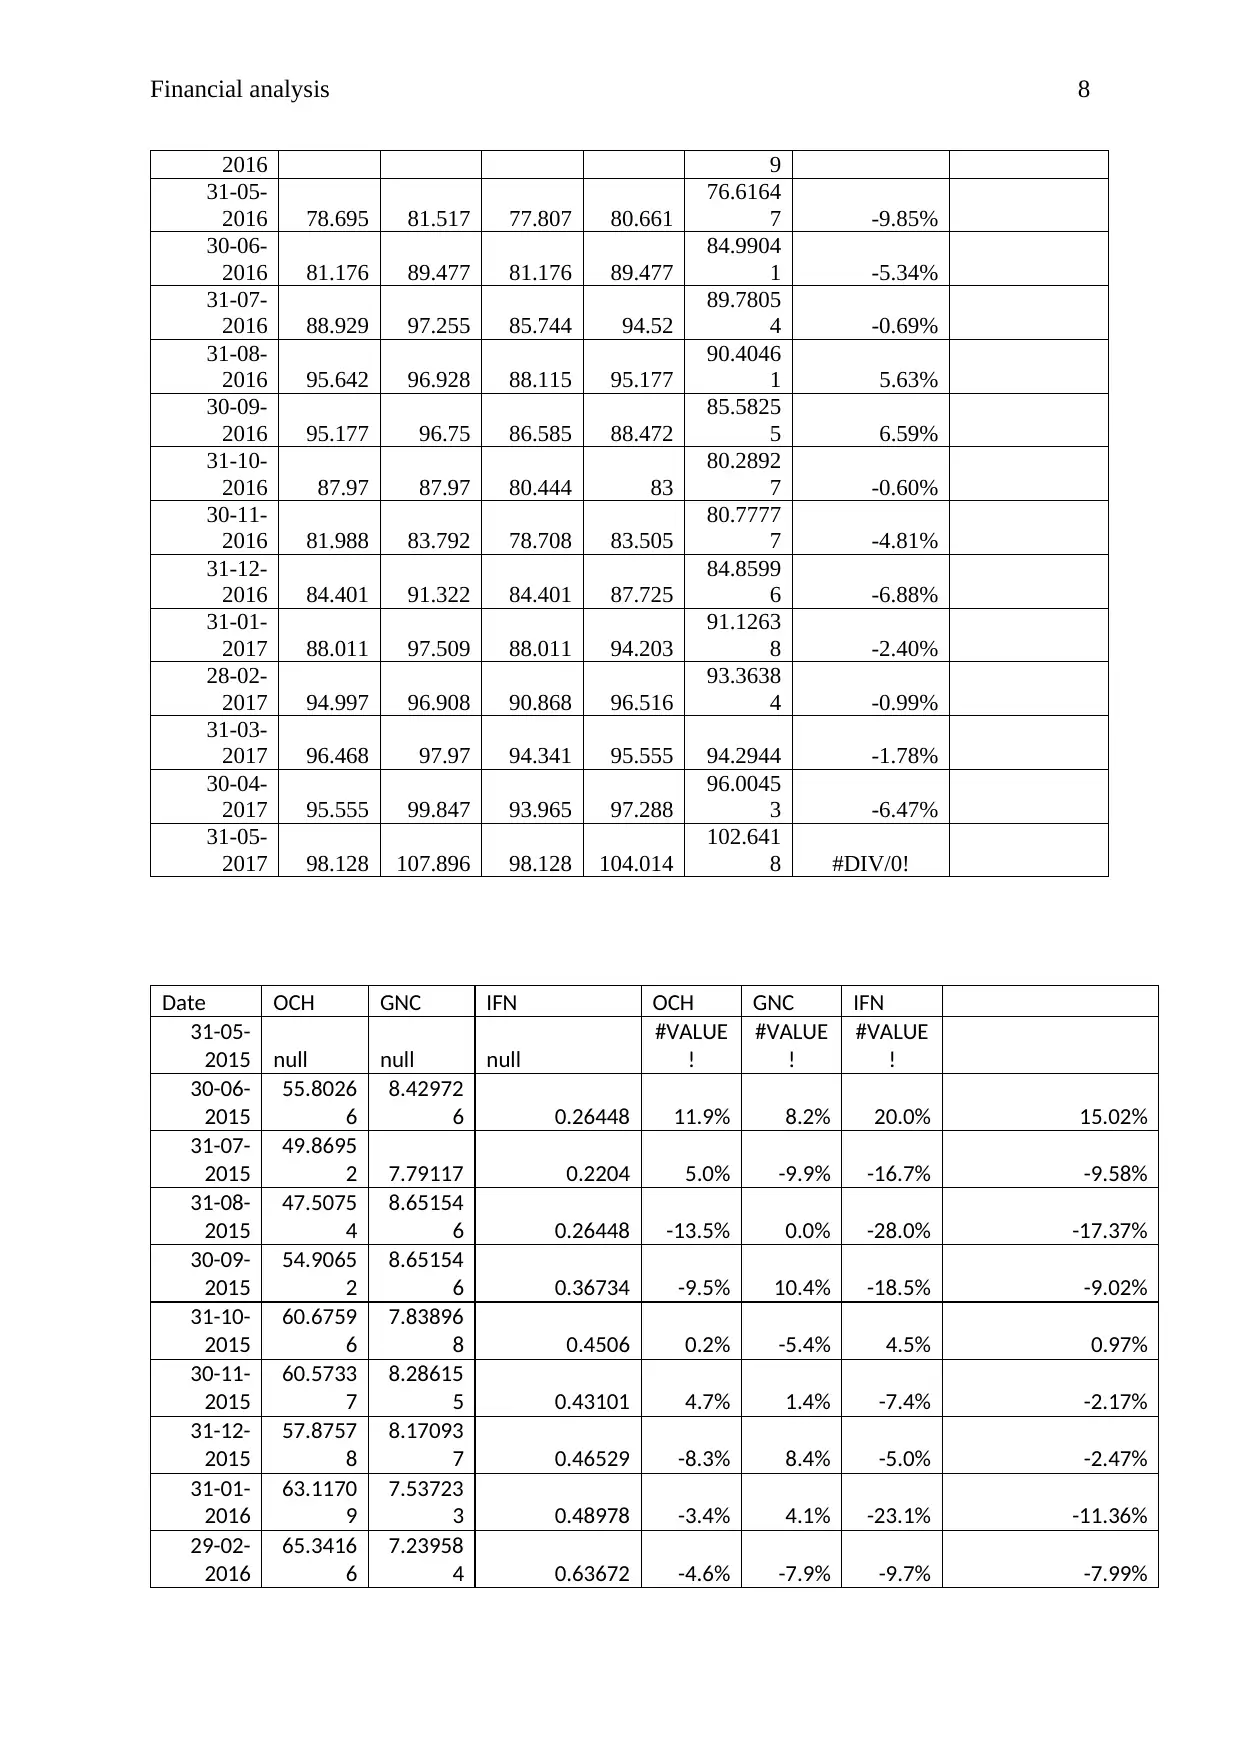
The second dataset offers monthly stock metrics for the same period, which simplifies long-term trend analysis and average return computation. It includes open, close, high, low prices, adjusted close, volume, dividend amounts, splits, and an additional 'Ex-Dividend' metric. The inclusion of dividends and split adjustments enables a more accurate reflection of shareholder value over time.
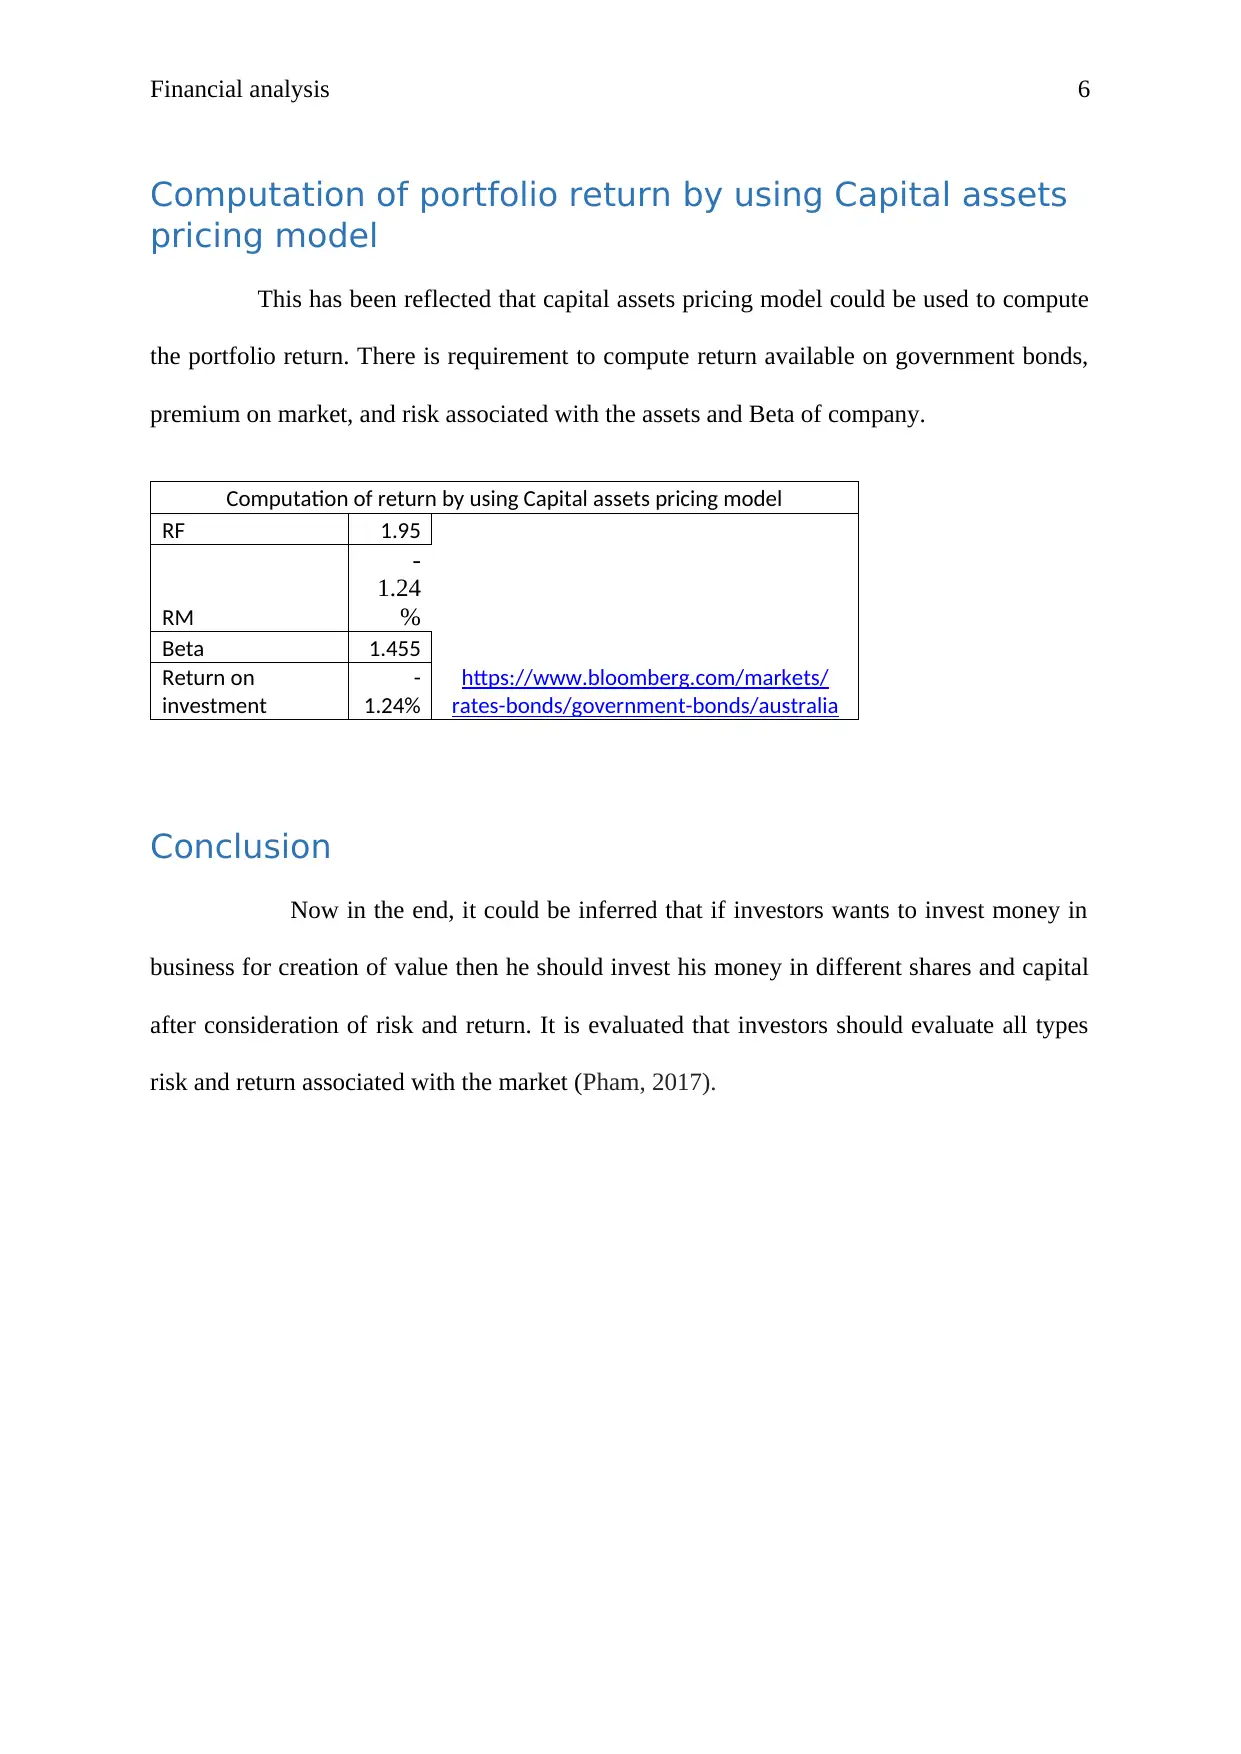
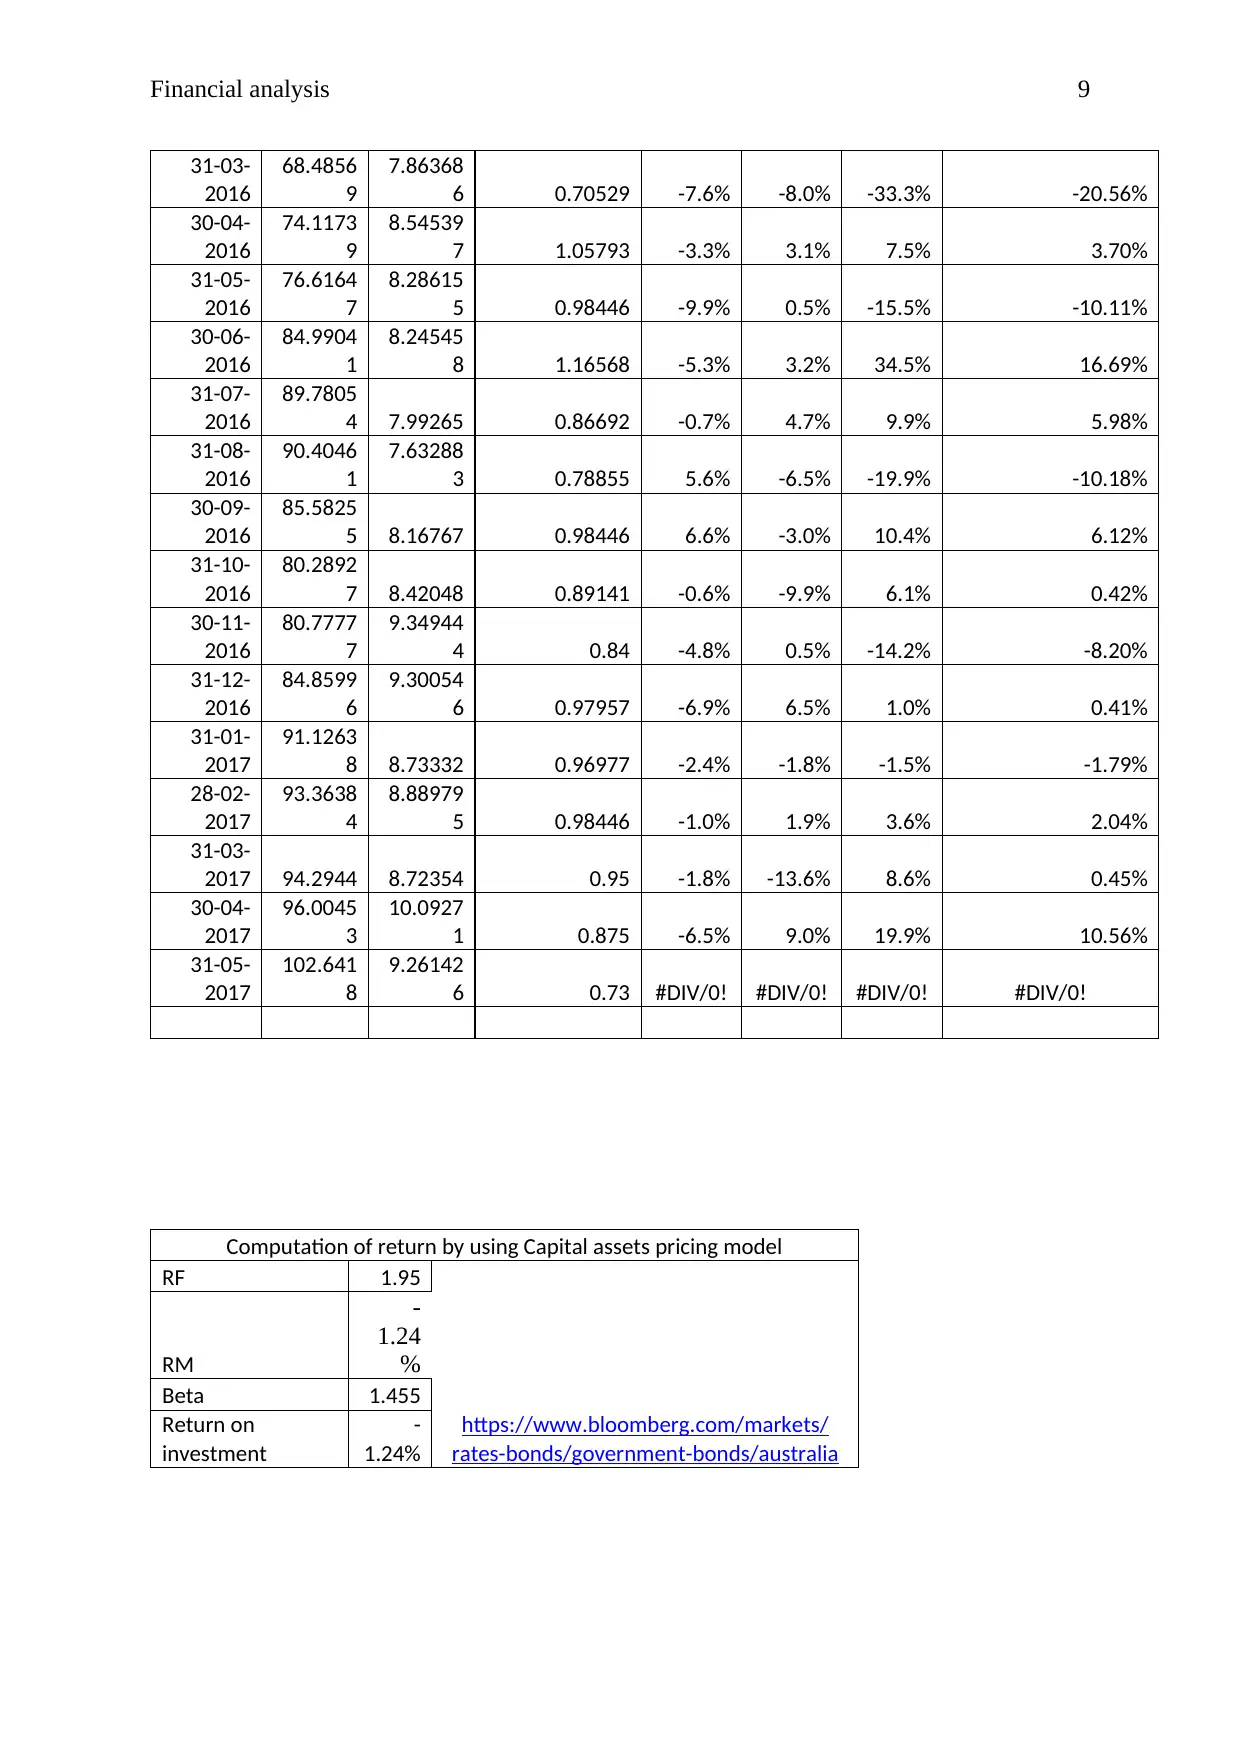
The task requires calculating the average monthly return for each month where data is available and interpreting these returns in the context of broader market trends during 2015 to 2017. Additional objectives include identifying any notable anomalies or patterns such as spikes in volume, significant price swings, or consistent growth periods. These analyses are crucial for understanding how external events like economic shifts or company-specific news impact stock performance.
Students should employ statistical methods and financial theories learned in class to derive insights from the data. The outcome of this analysis should provide a clearer picture of market dynamics over the specified period and equip students with practical analytical skills applicable in real-world finance scenarios.

Running Head: Financial analysis 1
Name of the student-
Topic- Financial analysis
University name
Name of the student-
Topic- Financial analysis
University name
Paraphrase This Document
Need a fresh take? Get an instant paraphrase of this document with our AI Paraphraser

Financial analysis 2
Introduction
In this report, study has been conducted on the risk and return offered by three
companies. With the increasing ramified economic changes and changing business
performance, share price of company changes with the changing in internal and external
market factors of companies. This report reflects the risk and return associated with the
companies’ shares and return available for the investors
Present description of company
Cochlear Limited Health care sector
Cochlear Limited Health care sector is medical device company which has been providing
health care service around the globe and supply the nuclear Nucleus cochlear implant, the
Hybrid electro-acoustic implant and the Baha bone conduction implant to its clients.
The total revenue of company is AUD $925.6 million (2016) which shows 15% increment as
compared to last three years data. Company is having around 2800 employees in 20 countries
for operating its business.
Grain Crop Company
It is public company listed on Australian stock exchange and accustomed to act as per the
directions and instructions of Mark L Palmquist. This company is engaged in providing
receive and storage of grain and related commodities (Mornigstar, 2017).
Infigen Energy Company
Infigen Energy Company is formally known as Babcock & brown partners. This company is
operating business of renewable generation energy throughout the time since last 15 years.

Financial analysis 3
Company has total revenue of AUD $ 173 million which has increased by average 20% since
last five years (Alagidede, Koutounidis, & Panagiotidis, 2017).
Risk and return of these three companies
After evaluating the adjusted share price of these three companies, it is evaluated
that these three companies has shown negative downfall since 1st July 2015 to 30th June 2017.
In addition to this, Australian stock price index market capitalization has also shown negative
down fall of its return and average downfall of -.0124 return for this period of time. However,
Company GNC AX has been shown less level of downfall in its return. If investors wants to
invest his money then he should invest his money in GNC AX in long run.
Company
name Return Risk
OCH -0.0244 0.06095
GNC AX -0.0018 0.06825
IFN IX -0.0394 0.16503
ASX index -0.0124 0.04906
Computation of equally weighted portfolio
It is evaluated that if investors could would invest in these three companies on equal
basis then it will surely average the return available on the stock return of these three
companies. It is observed investors would have average return of -0.02185134 in his
investment. All the shares has been used to invest in capital of the company and used to draw
return from the investment.
Computation
of equally
weighted
portfolio
Company
name Weight Return
Average
return
OCH 33.33 -0.0244 -0.00811782
GNC AX 33.33 -0.0018 -0.00060514
⊘ This is a preview!⊘
Do you want full access?
Subscribe today to unlock all pages.

Trusted by 1+ million students worldwide

Financial analysis 4
IFN IX 33.34 -0.0394 -0.01312838
Overall return -0.02185134
Construction of less risky investment portfolio
If investors wants to invest his money in these three companies then he should
invest 50% of his capital in IFN IX Company. This company has less risk or variable in the
business. Investors could invest his money 50 % in IFN and rest of money could be invested
in these two companies (Yahoo finance, 2017).
Construct less
risky portfolio
Company
name Weight Risk
Portfolio
risk
OCH 25.00% 0.61 0.1525
GNC AX 25.00% 0.68 0.17
IFN IX 50.00% 0.165 0.0825
Overall Risk
= 1.455 0.405
Paraphrase This Document
Need a fresh take? Get an instant paraphrase of this document with our AI Paraphraser

Financial analysis 5
Construction of efficient frontier of company
This efficient frontier of these companies shows the risk and return associated with the shares sold
in the market.
2 0% 2 5% 3 0% 3 5% 4 0% 4 5% 5 0% 5 5%
-20.00%
-15.00%
-10.00%
-5.00%
0.00%
5.00%
10.00%
15.00%
20.00%
OCH GNC IFN
This efficient frontier of company is used to identify the point at which investors
would have maximum profit and at minimum risk. The below efficient frontier shows the
best level of risk and return equilibrium for the investors.

Financial analysis 6
Computation of portfolio return by using Capital assets
pricing model
This has been reflected that capital assets pricing model could be used to compute
the portfolio return. There is requirement to compute return available on government bonds,
premium on market, and risk associated with the assets and Beta of company.
Computation of return by using Capital assets pricing model
RF 1.95
https://www.bloomberg.com/markets/
rates-bonds/government-bonds/australia
RM
-
1.24
%
Beta 1.455
Return on
investment
-
1.24%
Conclusion
Now in the end, it could be inferred that if investors wants to invest money in
business for creation of value then he should invest his money in different shares and capital
after consideration of risk and return. It is evaluated that investors should evaluate all types
risk and return associated with the market (Pham, 2017).
⊘ This is a preview!⊘
Do you want full access?
Subscribe today to unlock all pages.

Trusted by 1+ million students worldwide

Financial analysis 7
References
Alagidede, P., Koutounidis, N., & Panagiotidis, T. (2017). On the stability of the CAPM
before and after the financial crisis: Panel evidence from the Johannesburg Securities
Exchange. African Review of Economics and Finance, 9(1), 180-189.
Mornigstar, 2017, Retrieved on 2nd Octobe, 2017 from
http://datanalysis.morningstar.com.au.ezproxy.lib.monash.edu.au/af/dathome?xtm-
licensee=datpremium
Pham, H. (2017). : Testing the Capital Asset Pricing Model (CAPM) in the Vietnamese stock
market: An analysis of two sub-periods from 2006 to 2016.
Yahoo finance, 2017, Retrieved on 2nd Octobe, 2017 from https://in.finance.yahoo.com/
Appendix
Open High Low Close
Adj
Close
Monthly
return
Average
return
null null null null null
30-06-
2015 56.393 60.535 52.737 60.41
55.8026
6 11.90% -2.44%
31-07-
2015 60.171 61.866 52.753 53.987
49.8695
2 4.97%
31-08-
2015 53.013 53.663 50.194 51.43
47.5075
4 -13.48%
30-09-
2015 53.098 57.805 51.466 57.805
54.9065
2 -9.51%
31-10-
2015 56.772 63.879 56.772 63.879
60.6759
6 0.17%
30-11-
2015 65.653 65.873 59.573 63.771
60.5733
7 4.66%
31-12-
2015 63.771 63.771 57.82 60.931
57.8757
8 -8.30%
31-01-
2016 61.853 68.171 56.439 66.449
63.1170
9 -3.40%
29-02-
2016 67.078 69.993 66.289 68.791
65.3416
6 -4.59%
31-03-
2016 68.962 72.356 66.985 72.101
68.4856
9 -7.60%
30-04- 72.574 78.03 70.465 78.03 74.1173 -3.26%
Paraphrase This Document
Need a fresh take? Get an instant paraphrase of this document with our AI Paraphraser

Financial analysis 8
2016 9
31-05-
2016 78.695 81.517 77.807 80.661
76.6164
7 -9.85%
30-06-
2016 81.176 89.477 81.176 89.477
84.9904
1 -5.34%
31-07-
2016 88.929 97.255 85.744 94.52
89.7805
4 -0.69%
31-08-
2016 95.642 96.928 88.115 95.177
90.4046
1 5.63%
30-09-
2016 95.177 96.75 86.585 88.472
85.5825
5 6.59%
31-10-
2016 87.97 87.97 80.444 83
80.2892
7 -0.60%
30-11-
2016 81.988 83.792 78.708 83.505
80.7777
7 -4.81%
31-12-
2016 84.401 91.322 84.401 87.725
84.8599
6 -6.88%
31-01-
2017 88.011 97.509 88.011 94.203
91.1263
8 -2.40%
28-02-
2017 94.997 96.908 90.868 96.516
93.3638
4 -0.99%
31-03-
2017 96.468 97.97 94.341 95.555 94.2944 -1.78%
30-04-
2017 95.555 99.847 93.965 97.288
96.0045
3 -6.47%
31-05-
2017 98.128 107.896 98.128 104.014
102.641
8 #DIV/0!
Date OCH GNC IFN OCH GNC IFN
31-05-
2015 null null null
#VALUE
!
#VALUE
!
#VALUE
!
30-06-
2015
55.8026
6
8.42972
6 0.26448 11.9% 8.2% 20.0% 15.02%
31-07-
2015
49.8695
2 7.79117 0.2204 5.0% -9.9% -16.7% -9.58%
31-08-
2015
47.5075
4
8.65154
6 0.26448 -13.5% 0.0% -28.0% -17.37%
30-09-
2015
54.9065
2
8.65154
6 0.36734 -9.5% 10.4% -18.5% -9.02%
31-10-
2015
60.6759
6
7.83896
8 0.4506 0.2% -5.4% 4.5% 0.97%
30-11-
2015
60.5733
7
8.28615
5 0.43101 4.7% 1.4% -7.4% -2.17%
31-12-
2015
57.8757
8
8.17093
7 0.46529 -8.3% 8.4% -5.0% -2.47%
31-01-
2016
63.1170
9
7.53723
3 0.48978 -3.4% 4.1% -23.1% -11.36%
29-02-
2016
65.3416
6
7.23958
4 0.63672 -4.6% -7.9% -9.7% -7.99%

Financial analysis 9
31-03-
2016
68.4856
9
7.86368
6 0.70529 -7.6% -8.0% -33.3% -20.56%
30-04-
2016
74.1173
9
8.54539
7 1.05793 -3.3% 3.1% 7.5% 3.70%
31-05-
2016
76.6164
7
8.28615
5 0.98446 -9.9% 0.5% -15.5% -10.11%
30-06-
2016
84.9904
1
8.24545
8 1.16568 -5.3% 3.2% 34.5% 16.69%
31-07-
2016
89.7805
4 7.99265 0.86692 -0.7% 4.7% 9.9% 5.98%
31-08-
2016
90.4046
1
7.63288
3 0.78855 5.6% -6.5% -19.9% -10.18%
30-09-
2016
85.5825
5 8.16767 0.98446 6.6% -3.0% 10.4% 6.12%
31-10-
2016
80.2892
7 8.42048 0.89141 -0.6% -9.9% 6.1% 0.42%
30-11-
2016
80.7777
7
9.34944
4 0.84 -4.8% 0.5% -14.2% -8.20%
31-12-
2016
84.8599
6
9.30054
6 0.97957 -6.9% 6.5% 1.0% 0.41%
31-01-
2017
91.1263
8 8.73332 0.96977 -2.4% -1.8% -1.5% -1.79%
28-02-
2017
93.3638
4
8.88979
5 0.98446 -1.0% 1.9% 3.6% 2.04%
31-03-
2017 94.2944 8.72354 0.95 -1.8% -13.6% 8.6% 0.45%
30-04-
2017
96.0045
3
10.0927
1 0.875 -6.5% 9.0% 19.9% 10.56%
31-05-
2017
102.641
8
9.26142
6 0.73 #DIV/0! #DIV/0! #DIV/0! #DIV/0!
Computation of return by using Capital assets pricing model
RF 1.95
https://www.bloomberg.com/markets/
rates-bonds/government-bonds/australia
RM
-
1.24
%
Beta 1.455
Return on
investment
-
1.24%
31-03-
2016
68.4856
9
7.86368
6 0.70529 -7.6% -8.0% -33.3% -20.56%
30-04-
2016
74.1173
9
8.54539
7 1.05793 -3.3% 3.1% 7.5% 3.70%
31-05-
2016
76.6164
7
8.28615
5 0.98446 -9.9% 0.5% -15.5% -10.11%
30-06-
2016
84.9904
1
8.24545
8 1.16568 -5.3% 3.2% 34.5% 16.69%
31-07-
2016
89.7805
4 7.99265 0.86692 -0.7% 4.7% 9.9% 5.98%
31-08-
2016
90.4046
1
7.63288
3 0.78855 5.6% -6.5% -19.9% -10.18%
30-09-
2016
85.5825
5 8.16767 0.98446 6.6% -3.0% 10.4% 6.12%
31-10-
2016
80.2892
7 8.42048 0.89141 -0.6% -9.9% 6.1% 0.42%
30-11-
2016
80.7777
7
9.34944
4 0.84 -4.8% 0.5% -14.2% -8.20%
31-12-
2016
84.8599
6
9.30054
6 0.97957 -6.9% 6.5% 1.0% 0.41%
31-01-
2017
91.1263
8 8.73332 0.96977 -2.4% -1.8% -1.5% -1.79%
28-02-
2017
93.3638
4
8.88979
5 0.98446 -1.0% 1.9% 3.6% 2.04%
31-03-
2017 94.2944 8.72354 0.95 -1.8% -13.6% 8.6% 0.45%
30-04-
2017
96.0045
3
10.0927
1 0.875 -6.5% 9.0% 19.9% 10.56%
31-05-
2017
102.641
8
9.26142
6 0.73 #DIV/0! #DIV/0! #DIV/0! #DIV/0!
Computation of return by using Capital assets pricing model
RF 1.95
https://www.bloomberg.com/markets/
rates-bonds/government-bonds/australia
RM
-
1.24
%
Beta 1.455
Return on
investment
-
1.24%
⊘ This is a preview!⊘
Do you want full access?
Subscribe today to unlock all pages.

Trusted by 1+ million students worldwide

Financial analysis 10
Computatin of equally
weighted portfolio
Company name Weight Return
Average
retunr
OCH
33.33
%
-
0.024355909 -0.00811782
GNC AX
33.33
%
-
0.001815591 -0.00060514
IFN IX
33.33
%
-
0.039389088 -0.01312838
Overall return -0.02185134
Construct less risky
portfolio
Company name Weight Risk Portfolio risk
OCH
25.00
% 0.61 0.1525
GNC AX
25.00
% 0.68 0.17
IFN IX
50.00
% 0.165 0.0825
Overall Risk = 1.455 0.405
Date Open High Low Close Adj Close
Monthly
return
31-05-
2015 null null null null null
30-06-
2015 8.42 8.995 8.36 8.93
8.42972
6 8.20%
31-07-
2015 8.9 8.97 7.8 8.15 7.79117 -9.94%
31-08-
2015 8.11 9.05 7.67 9.05
8.65154
6 0.00%
30-09-
2015 9.09 9.42 8.69 9.05
8.65154
6 10.37%
31-10-
2015 8.94 9 7.93 8.2
7.83896
8 -5.40%
30-11-
2015 8.1 8.71 7.84 8.63
8.28615
5 1.41%
31-12-
2015 8.63 8.67 7.53 8.51
8.17093
7 8.41%
Paraphrase This Document
Need a fresh take? Get an instant paraphrase of this document with our AI Paraphraser

Financial analysis 11
31-01-
2016 8.61 8.82 7.645 7.85
7.53723
3 4.11%
29-02-
2016 7.8 7.86 7.21 7.54
7.23958
4 -7.94%
31-03-
2016 7.47 8.39 7.195 8.19
7.86368
6 -7.98%
30-04-
2016 8.16 8.97 7.63 8.9
8.54539
7 3.13%
31-05-
2016 8.8 9.23 8.43 8.63
8.28615
5 0.49%
30-06-
2016 8.59 8.83 7.8 8.48
8.24545
8 3.16%
31-07-
2016 8.5 8.51 8.13 8.22 7.99265 4.71%
31-08-
2016 8.22 8.33 7.75 7.85
7.63288
3 -6.55%
30-09-
2016 7.85 8.58 7.78 8.4 8.16767 -3.00%
31-10-
2016 8.39 8.79 8.11 8.66 8.42048 -9.94%
30-11-
2016 8.75 9.62 8.67 9.56
9.34944
4 0.53%
31-12-
2016 9.56 9.82 9.05 9.51
9.30054
6 6.49%
31-01-
2017 9.65 9.65 8.88 8.93 8.73332 -1.76%
28-02-
2017 8.88 9.2 8.62 9.09
8.88979
5 1.91%
31-03-
2017 9.05 9.08 8.73 8.92 8.72354 -13.57%
30-04-
2017 8.92 10.48 8.66 10.32
10.0927
1 8.98%
31-05-
2017 10.37 10.55 9.39 9.47
9.26142
6 #DIV/0!
Date Open High Low Close
Adj
Close
Monthly
return
31-05-
2015 null null null null null #VALUE!
30-06-
2015 0.31346 0.32326 0.26448 0.26448 0.26448 20.00%
31-07-
2015 0.26448 0.26938 0.20571 0.2204 0.2204 -16.67%
31-08-
2015 0.2204 0.26448 0.2204 0.26448 0.26448 -28.00%
30-09-
2015 0.26448 0.37419 0.25665 0.36734 0.36734 -18.48%
31-10- 0.37713 0.4555 0.37224 0.4506 0.4506 4.55%
31-01-
2016 8.61 8.82 7.645 7.85
7.53723
3 4.11%
29-02-
2016 7.8 7.86 7.21 7.54
7.23958
4 -7.94%
31-03-
2016 7.47 8.39 7.195 8.19
7.86368
6 -7.98%
30-04-
2016 8.16 8.97 7.63 8.9
8.54539
7 3.13%
31-05-
2016 8.8 9.23 8.43 8.63
8.28615
5 0.49%
30-06-
2016 8.59 8.83 7.8 8.48
8.24545
8 3.16%
31-07-
2016 8.5 8.51 8.13 8.22 7.99265 4.71%
31-08-
2016 8.22 8.33 7.75 7.85
7.63288
3 -6.55%
30-09-
2016 7.85 8.58 7.78 8.4 8.16767 -3.00%
31-10-
2016 8.39 8.79 8.11 8.66 8.42048 -9.94%
30-11-
2016 8.75 9.62 8.67 9.56
9.34944
4 0.53%
31-12-
2016 9.56 9.82 9.05 9.51
9.30054
6 6.49%
31-01-
2017 9.65 9.65 8.88 8.93 8.73332 -1.76%
28-02-
2017 8.88 9.2 8.62 9.09
8.88979
5 1.91%
31-03-
2017 9.05 9.08 8.73 8.92 8.72354 -13.57%
30-04-
2017 8.92 10.48 8.66 10.32
10.0927
1 8.98%
31-05-
2017 10.37 10.55 9.39 9.47
9.26142
6 #DIV/0!
Date Open High Low Close
Adj
Close
Monthly
return
31-05-
2015 null null null null null #VALUE!
30-06-
2015 0.31346 0.32326 0.26448 0.26448 0.26448 20.00%
31-07-
2015 0.26448 0.26938 0.20571 0.2204 0.2204 -16.67%
31-08-
2015 0.2204 0.26448 0.2204 0.26448 0.26448 -28.00%
30-09-
2015 0.26448 0.37419 0.25665 0.36734 0.36734 -18.48%
31-10- 0.37713 0.4555 0.37224 0.4506 0.4506 4.55%

Financial analysis 12
2015
30-11-
2015 0.4555 0.52897 0.39183 0.43101 0.43101 -7.37%
31-12-
2015 0.43101 0.46529 0.35754 0.46529 0.46529 -5.00%
31-01-
2016 0.4604 0.49958 0.41338 0.48978 0.48978 -23.08%
29-02-
2016 0.48978 0.65141 0.47509 0.63672 0.63672 -9.72%
31-03-
2016 0.62692 0.73467 0.62692 0.70529 0.70529 -33.33%
30-04-
2016 0.70529 1.09711 0.67296 1.05793 1.05793 7.46%
31-05-
2016 1.05793 1.20487 0.97957 0.98446 0.98446 -15.55%
30-06-
2016 0.99426 1.20976 0.98936 1.16568 1.16568 34.46%
31-07-
2016 1.17058 1.20487 0.83263 0.86692 0.86692 9.94%
31-08-
2016 0.86202 0.97957 0.73957 0.78855 0.78855 -19.90%
30-09-
2016 0.79345 1.03834 0.6808 0.98446 0.98446 10.44%
31-10-
2016 0.97957 0.98202 0.78365 0.89141 0.89141 6.12%
30-11-
2016 0.8963 0.9012 0.80814 0.84 0.84 -14.25%
31-12-
2016 0.88161 1.01875 0.86202 0.97957 0.97957 1.01%
31-01-
2017 0.97957 1.04814 0.94528 0.96977 0.96977 -1.49%
28-02-
2017 0.97467 1.02365 0.9012 0.98446 0.98446 3.63%
31-03-
2017 0.98446 1.065 0.94 0.95 0.95 8.57%
30-04-
2017 0.95 0.97 0.83 0.875 0.875 19.86%
31-05-
2017 0.875 0.88 0.645 0.73 0.73
Date Open High Low Close
Adj
Close
Monthly
return
Average
return
31-05-
2015 null null null null null
30-06-
2015 39.94 44.58 39.94 44.45
38.095
3 12.70% -1.24%
31-07- 45 45 37.83 39.44 33.801 4.12%
⊘ This is a preview!⊘
Do you want full access?
Subscribe today to unlock all pages.

Trusted by 1+ million students worldwide
1 out of 13