Ask a question from expert
Financial Analysis Management And Enterpirse - Assignment
25 Pages3947 Words54 Views
Added on 2021-02-19
Financial Analysis Management And Enterpirse - Assignment
Added on 2021-02-19
BookmarkShareRelated Documents
Financial AnalysisManagement and Enterpirse
Table of ContentsINTRODUCTION...........................................................................................................................3Question 1 Presenting ratio analysis, vertical and horizontal analysis of the financial statementof Tesco and Sainsbury for past 4 years......................................................................................3Question 2 Explaining the importance of working capital analysis for both the companies inthe process of decision-making.................................................................................................12Question 3 Critical analysis of the cash flow statement of both the companies for last twoyears and its assistance in the decision making process...........................................................13CONCLUSION..............................................................................................................................14REFERENCES..............................................................................................................................16APPENDIXE:................................................................................................................................17
INTRODUCTIONFinancial Analysis management and Enterprise can be related for business organisationas investigating and evaluation of the performance of the business in terms of ratio analysis andbalance sheet evaluation thorough vertical and horizontal evaluation, This assist the comparisonof financial performance of two or more business pertaining to similar industry to determine theirover al performer and the competitive advantages they have on each other. In the present reportthe financial performance of Sainsbury and Tesco is compared in fiscal terms in this the ratioanalysis in done where liquidity, profitability, efficiency and investment ratios are calculatedthan both them are compared. Apart form this horizontal and vertical analysis is also done for thebalance sheet of both the organisation. In the next part of the report the working capital statusand cash flow of the both the organisation is depicted and their status in both the files isexplained.Question 1 Presenting ratio analysis, vertical and horizontal analysis of the financial statement ofTesco and Sainsbury for past 4 yearsRatio analysisRatio analysis is that tool which depicts the financial position of a company andfacilitates comparison among two of more organizations.PROFITABILITY RATIOGross profit ratioYear / companies2015201620172018Sainsbury5.08%6.19%6.23%6.61%Tesco-3.39%5.24%5.19%5.83%Net Profit ratioYear / companies2015201620172018Sainsbury-7.00%2.00%1.44%1.09%Tesco-9.22%0.25%-0.07%0.02%Interpretation:The gross profit ratio of companies defines the difference between the sales revenue andcost of good s sold of the organization. For GP ratio of Sainsbury have shown a consistent3
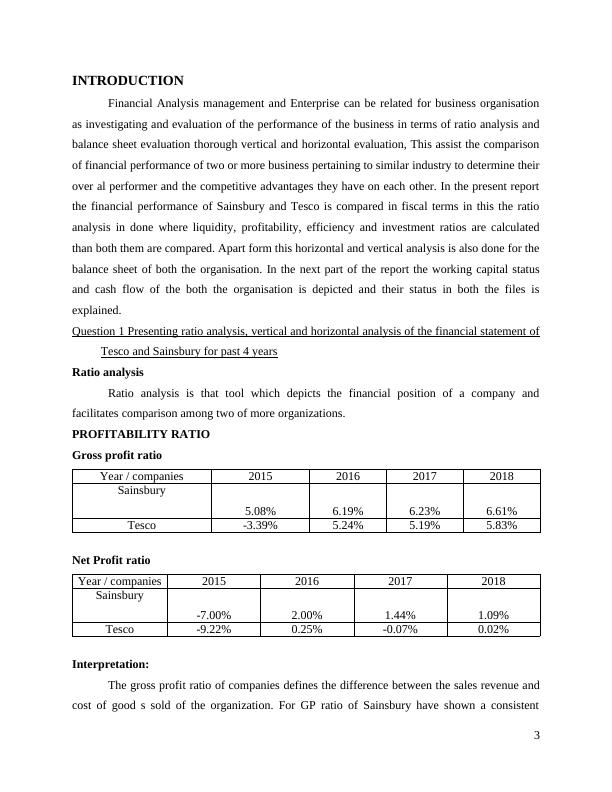
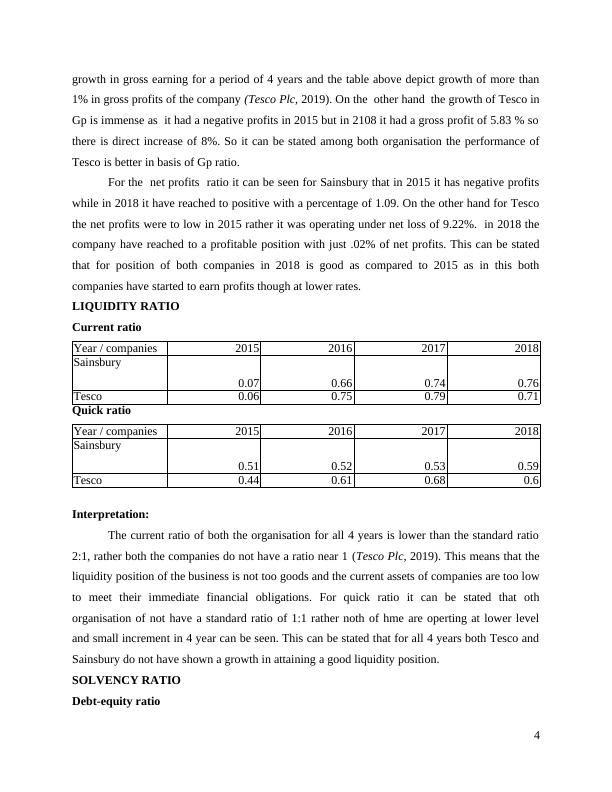
growth in gross earning for a period of 4 years and the table above depict growth of more than1% in gross profits of the company (Tesco Plc, 2019). On the other hand the growth of Tesco inGp is immense as it had a negative profits in 2015 but in 2108 it had a gross profit of 5.83 % sothere is direct increase of 8%. So it can be stated among both organisation the performance ofTesco is better in basis of Gp ratio.For the net profits ratio it can be seen for Sainsbury that in 2015 it has negative profitswhile in 2018 it have reached to positive with a percentage of 1.09. On the other hand for Tescothe net profits were to low in 2015 rather it was operating under net loss of 9.22%. in 2018 thecompany have reached to a profitable position with just .02% of net profits. This can be statedthat for position of both companies in 2018 is good as compared to 2015 as in this bothcompanies have started to earn profits though at lower rates.LIQUIDITY RATIO Current ratio Year / companies2015201620172018Sainsbury0.070.660.740.76Tesco0.060.750.790.71Quick ratio Year / companies2015201620172018Sainsbury0.510.520.530.59Tesco0.440.610.680.6Interpretation:The current ratio of both the organisation for all 4 years is lower than the standard ratio2:1, rather both the companies do not have a ratio near 1 (Tesco Plc, 2019). This means that theliquidity position of the business is not too goods and the current assets of companies are too lowto meet their immediate financial obligations. For quick ratio it can be stated that othorganisation of not have a standard ratio of 1:1 rather noth of hme are operting at lower leveland small increment in 4 year can be seen. This can be stated that for all 4 years both Tesco andSainsbury do not have shown a growth in attaining a good liquidity position.SOLVENCY RATIO Debt-equity ratio 4
Year / companies2015201620172018Sainsbury0.440.350.310.2Tesco1.491.231.450.67Interpretation: The debt equity ratio depict the position of the business in the proportionof debt regarding the equity. This can be stared that the position Sainsbury in past 4 years havenot shown a growth rather a fall can be seen from 0.4 to 0.2 this means company only have 20%of equity over 100 %. Same is the position of Tesco which depicts that debt equity ratio havefallen and the debt financing in capital structure have increased for Tesco.EFFICIENCY RATIOInventory turnover ratioYear / companies2015201620172018Sainsbury22.6322.4417.9314.83Tesco21.7819.1522.4123.73Total assets turnover ratioYear / companies2015201620172018Sainsbury1.441.41.431.36Tesco1.411.241.251.27Fixed assets turnover ratioYear / companies2015201620172018Sainsbury1.981.912.022.07Tesco1.931.781.881.87Interpretation: Efficiency ratio can be understood as assistance In determination of efficiencyof business by the use of its different resources and generating income. A Higher value of these5
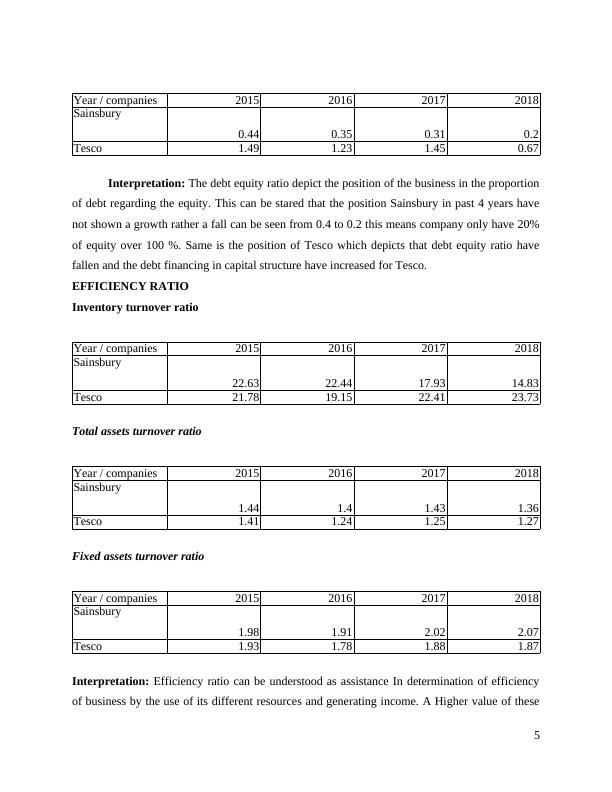
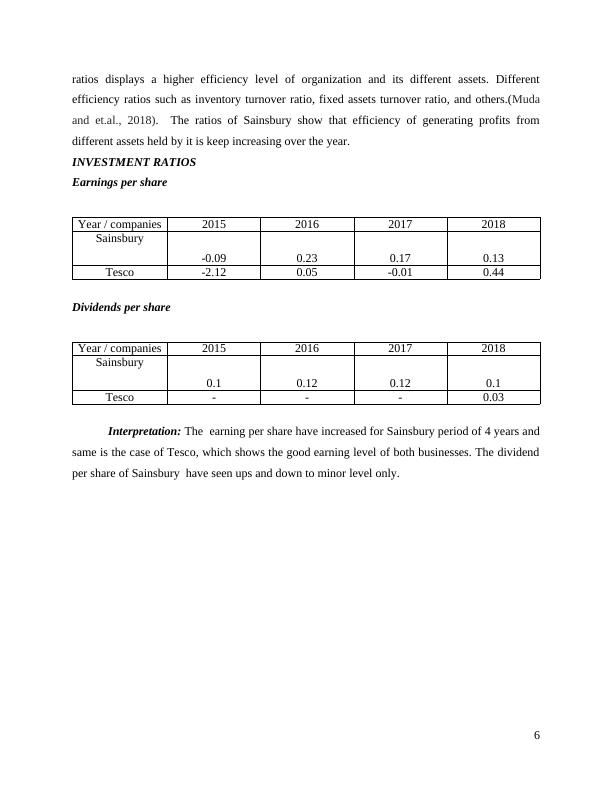
ratios displays a higher efficiency level of organization and its different assets. Differentefficiency ratios such as inventory turnover ratio, fixed assets turnover ratio, and others.(Mudaand et.al., 2018). The ratios of Sainsbury show that efficiency of generating profits fromdifferent assets held by it is keep increasing over the year.INVESTMENT RATIOSEarnings per shareYear / companies2015201620172018Sainsbury-0.090.230.170.13Tesco-2.120.05-0.010.44Dividends per share Year / companies2015201620172018Sainsbury0.10.120.120.1Tesco---0.03Interpretation: The earning per share have increased for Sainsbury period of 4 years andsame is the case of Tesco, which shows the good earning level of both businesses. The dividendper share of Sainsbury have seen ups and down to minor level only.6
End of preview
Want to access all the pages? Upload your documents or become a member.
Related Documents
Financial Analysis Management & Enterprise: Assignmentlg...
|31
|7584
|54
Financial Analysis Management & Enterprise - FAME TABLE OF CONTENTS INTRODUCTIONlg...
|25
|7371
|302
Financial Analysis and Management Assignment Samplelg...
|18
|4697
|44
Financial Analysis Management & Enterprise Assignment Solutionlg...
|24
|4214
|19
Financial Analysis and Management Enterprise Contentslg...
|31
|3707
|144
Financial analysis and management enterprise (Doc)lg...
|22
|5808
|21