Financial Analysis of Farsons and Heiniken Companies
36 Pages7567 Words69 Views
Added on 2023-01-18
About This Document
This article provides a detailed financial analysis of Farsons and Heiniken companies, including vertical, horizontal, and ratio analysis of their financial statements.
Financial Analysis of Farsons and Heiniken Companies
Added on 2023-01-18
ShareRelated Documents
Financial Analysis
Management
Enterprise
Management
Enterprise
Table of Contents
INTRODUCTION...........................................................................................................................3
MAIN BODY...................................................................................................................................3
TASK 1. Complete vertical, horizontal and ratio analysis of the financial statements of chosen
companies....................................................................................................................................3
Task 2.Evaluation of the Working Capital...............................................................................11
Task 3. Evaluation of the Cash Flow........................................................................................12
CONCLUSION..............................................................................................................................13
REFERENCES..............................................................................................................................14
APPENDIX....................................................................................................................................15
.......................................................................................................................................................26
INTRODUCTION
The term financial analysis can be defined as a way of analysing monetary aspect of
business entities for a particular time frame. In order to do an effective financial analysis, various
kinds of financial statements are interpreted such as income statement, balance sheet and many
more (Morden, 2016). Basically, there are different types of techniques of doing financial
analysis such as vertical analysis, horizontal analysis, ratio analysis and many more. The aim of
project report to do a detailed financial analysis of given enterprises. The project report is based
on two companies which are Farsons and Heiniken. Under the project report four years financial
statements are assessed in order to evaluate about efficiency of both of companies. The Farsons
company operates its business and activities in beverage sector. They produce a wide range of
beers and soft drinks. The company is headquartered in Malta and it was founded in year 1928.
The another company, Heiniken is also involved in process of beer manufacturing and located in
Netherlands.
MAIN BODY
TASK 1. Complete vertical, horizontal and ratio analysis of the financial statements of chosen
companies.
Vertical analysis: This can be defined as a type of financial statement analysis technique in
which every item is presented as a percentage of base amount in various statements (Yinping,
2015). It is also known by common size analysis. In order to convert elements of different
elements to do vertical analysis, there is a particular formula which is as follows :
Vertical analysis formula (Income statement) = Item of income statement / Total sales * 100.
Vertical analysis formula (Balance sheet) = Item of balance sheet / Total sales * 100.
In the context of above mentioned both of companies, there vertical analysis is done below in
such manner :
Heiniken:
Income Statement:
On the basis of produced income statement of Heiniken Plc, this can be find out that all
the elements of this statement are based on total value of sales. Their income statement presents
that the value of gross profit was increasing during year of 2015 to 2017. Though, in year 2018,
it decreased and became of 51.29%. In the aspect of net profit of company, it can be find out that
this is fluctuating in all four years. In year 2015, it was of 4.67% that reduced and became of
3.75% in 2016 (Annual Report of Heiniken, 2019). In next year 2017, it increased and became of
4.46% but in last year 2018, again it reduced till 4.28%.
Balance sheet:
As per the information included in balance sheet of above company, it can be find out
that their value of fixed assets is increasing and decreasing in all four years. Like in year 2015, it
was of 84.32% that decreased in next year till 79.31% but in year 2017, it raised by a little
margin and became of 79.90%. In year 2018, it decreased and became of 78.38%. Their current
assets are also increasing by huge gapes in all four years. Like in year 2015, it was of 15.68%
that raised between three years and became of 21.62% in last year 2018. As well as their cash
proportion which is based on total assets was higher in year 2018 of 6.92%. In rest of the years, it
was of 2.23% in year 2015, 7.72% in 2016 and 5.95% in year 2017.
Apart from it, above company's shareholder's funds are based on percentage of total
assets. The value of their shareholder's fund was higher in year 2015 that was of 17.90%. In rest
of years, it was of 16.78%, 16.16% and 17.06%. Along with the amount of current liabilities fell
down from 26.44% to 24.90% in the financial year 2016 to 2018. Their non current liabilities
also reduced by some gape during accounting year 2015 to 2018 from 59.52% to 58.03%.
Farsons:
Income Statement:
Similar as the above mentioned company, this companies' all items of income statement
are based on the percentage of total sales revenues. In the aspect of gross profit of this company,
it can be stated that it is increasing year by year. For four years 2015,2016,2017 and 2018 their
gross profits is as follows: 37.97%, 38.82%, 38.64% and 38.95% (Annual Report of Farsons,
2019). In addition, the value of net income is also increasing in a significant manner. Such as in
year 2015, it was of 10.13% which raised and became of 12.94% in 2016. As well as in next two
years it became of 13.64% and 14.74%.
Balance sheet:
All the items of balance sheet are based on the total value of assets. Such as their
shareholder's equity was of 67.11% in year 2015 which fluctuated in next three years. In year
2016, it reduced and became of 66.87% but in year 2017, it raised and became of 67.21. While in
last year 2018, it decreased by huge gape till 59.88%. In addition, the amount of total liabilities
increased year by year. Starting from 2015, it was of 20.37% that raised continuously and
became of 32.79% in 2016, 32.52% in year 2017 and ended with 32.89% in year 2018.
In addition, the value of non current assets are also fluctuating such as in year 2015, it
was of 78.52% that raised and became of 79.14% as well as in next year, it increased till 81.42%.
In last year 2018, it minimized and became of 77.16%. Their value of total assets are as: 21.48%,
20.25%, 18.58% and 22.22% for year 2015,2016,2017 and 2018 respectively.
Horizontal Analysis: It is also known as Trend analysis. This can be defined as a type of
financial-statements analysis technique in which variation in the value of different elements of
financial is presented for a particular time period. In this kinds of analyzing technique, financial
statements of two or more then two years are taken to make a proper comparison. In the aspect of
above mentioned both of companies, the horizontal analysis is done below in such manner:
Heiniken:
Income Statement:
On the basis of horizontal analysis of income statement of this company, it can be find
out that variation in total sales revenue is raised in year 2017 till 5.27% that decreased in next
year and became of 2.66% in 2018. In addition, the gross profit of this company also decreased
by 2.08% in year 2018 and in year 2017, there was higher increased in variation of 6.04%. In the
aspect of net profit of company, it can be find out that it decreased in year 2018 from 1.64% and
in year 2017, it raised from 25.42%.
Balance sheet:
On the basis of balance sheet of company, it can be find out that the value of
shareholder's funds is increased by 7.91% in year 2018. Though, during year 2016-17, it was of -
2.25% and 0.53%. In the context of non current liabilities of this company, it can be find out that
in year 2017 it increased by 7.24% and in year 2018, it raised by just 1.69%. Their current
liabilities were increased during year 2016-17 from 22.09% and 0.59%. While in year 2018, it
reduced by -0.08%.
In the context of cash funds of this company, it can be find out that in year 2018, it
increased by 18.88% but in year 2017, there was decreasing in its value by 19.54%. While in
year 2016, it was raised by huge margin of 268.33%. Their current assets were raised from
37.59%, 1.36% and 9.97% in year 2016, 2017 and 2018 respectively. On the other hand, value of
non current assets raised by just 0.31% in year 2018. As well as their non current assets were
decreased from 1.94% in financial year 2016.
Farsons:
Income Statement:
As per the analysis of income statement of this company, it can be find out that it is
raised from 7.95% in year 2016. While in year 2017-18, its increasing value was of 3.53% and
7.59%. Along with the value of gross-profit also increased from 8.82% in year 2018, though in
year 2016, 2017 its increasing was of 10% and 3.03%. The net profit of company raised as:
37.50%, 9.09% and 16.67% throughout year 2016, 2017 and 2018.
Balance sheet:
As per the balance sheet of above company, it can be find out that shareholder's funds
decreased from 9% in year 2016 and 12.84% in year 2017. While in year 2018, it fell down from
21.14%. In addition, their non current liabilities raised by 8.16%, 13.21% and 11.67% for year
2016, 2017 and 2018. In the aspect of current liabilities, it can be find out that it increased by
33.33% in year 2018 and it remain unchanged in year 2017. As well as their total assets
decreased by 11.48% in year 2018 and in year 2016 & 2017, it raised by 12.27% and 9.40%. In
addition, the fixed assets decreased by 16.11% in year 2018 while in last years, it raised from
15.50% and 10.26% in year 2016 and 2017. Their current assets also raised from 5.88%, 3.03%
and 3.13% for year 2018, 2017 and 2016.
Ratio analysis- It can be defined as a type financial analysis technique which is based on
completely calculation and analysis of ratios for a particular time period (Vogel, 2014). In this
technique, a wide range of ratios are included such as profitability ratio, efficiency ratio and
many more. The main objective of this analysis technique is to assessing companies strength and
weakness of different kinds of aspects. In the aspect of above mentioned Farsons and Heiniken
companies, ratio analysis is done below that is as follows:
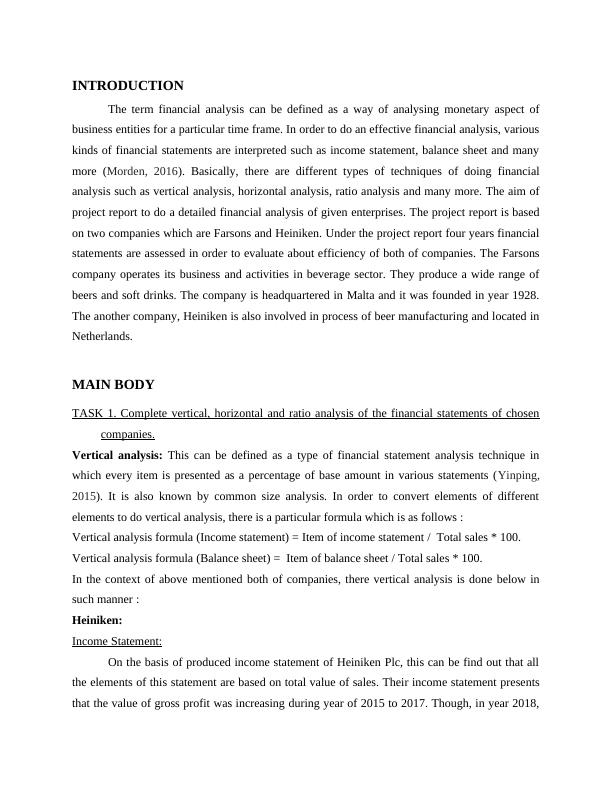
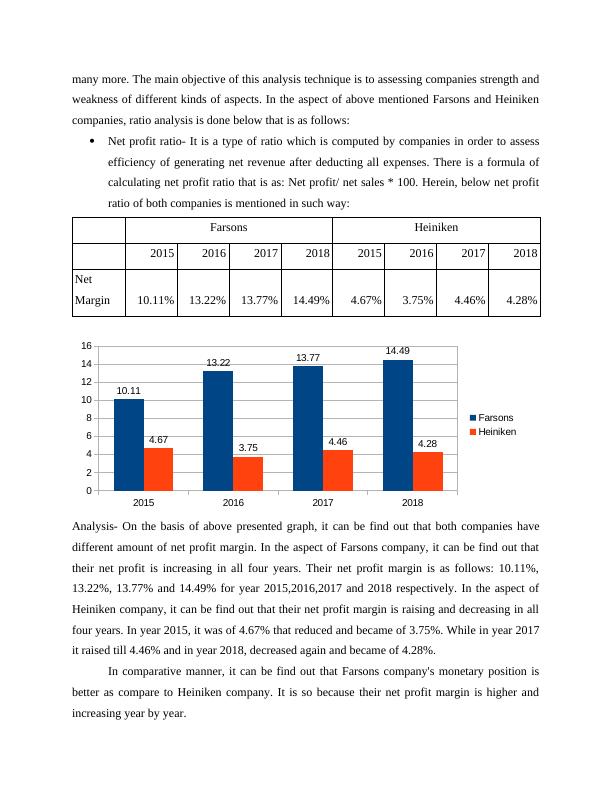
Net profit ratio- It is a type of ratio which is computed by companies in order to assess
efficiency of generating net revenue after deducting all expenses. There is a formula of
calculating net profit ratio that is as: Net profit/ net sales * 100. Herein, below net profit
ratio of both companies is mentioned in such way:
Farsons Heiniken
2015 2016 2017 2018 2015 2016 2017 2018
Net
Margin 10.11% 13.22% 13.77% 14.49% 4.67% 3.75% 4.46% 4.28%
2015 2016 2017 2018
0
2
4
6
8
10
12
14
16
10.11
13.22 13.77 14.49
4.67 3.75 4.46 4.28
Farsons
Heiniken
Analysis- On the basis of above presented graph, it can be find out that both companies have
different amount of net profit margin. In the aspect of Farsons company, it can be find out that
their net profit is increasing in all four years. Their net profit margin is as follows: 10.11%,
13.22%, 13.77% and 14.49% for year 2015,2016,2017 and 2018 respectively. In the aspect of
Heiniken company, it can be find out that their net profit margin is raising and decreasing in all
four years. In year 2015, it was of 4.67% that reduced and became of 3.75%. While in year 2017
it raised till 4.46% and in year 2018, decreased again and became of 4.28%.
In comparative manner, it can be find out that Farsons company's monetary position is
better as compare to Heiniken company. It is so because their net profit margin is higher and
increasing year by year.
weakness of different kinds of aspects. In the aspect of above mentioned Farsons and Heiniken
companies, ratio analysis is done below that is as follows:
Net profit ratio- It is a type of ratio which is computed by companies in order to assess
efficiency of generating net revenue after deducting all expenses. There is a formula of
calculating net profit ratio that is as: Net profit/ net sales * 100. Herein, below net profit
ratio of both companies is mentioned in such way:
Farsons Heiniken
2015 2016 2017 2018 2015 2016 2017 2018
Net
Margin 10.11% 13.22% 13.77% 14.49% 4.67% 3.75% 4.46% 4.28%
2015 2016 2017 2018
0
2
4
6
8
10
12
14
16
10.11
13.22 13.77 14.49
4.67 3.75 4.46 4.28
Farsons
Heiniken
Analysis- On the basis of above presented graph, it can be find out that both companies have
different amount of net profit margin. In the aspect of Farsons company, it can be find out that
their net profit is increasing in all four years. Their net profit margin is as follows: 10.11%,
13.22%, 13.77% and 14.49% for year 2015,2016,2017 and 2018 respectively. In the aspect of
Heiniken company, it can be find out that their net profit margin is raising and decreasing in all
four years. In year 2015, it was of 4.67% that reduced and became of 3.75%. While in year 2017
it raised till 4.46% and in year 2018, decreased again and became of 4.28%.
In comparative manner, it can be find out that Farsons company's monetary position is
better as compare to Heiniken company. It is so because their net profit margin is higher and
increasing year by year.
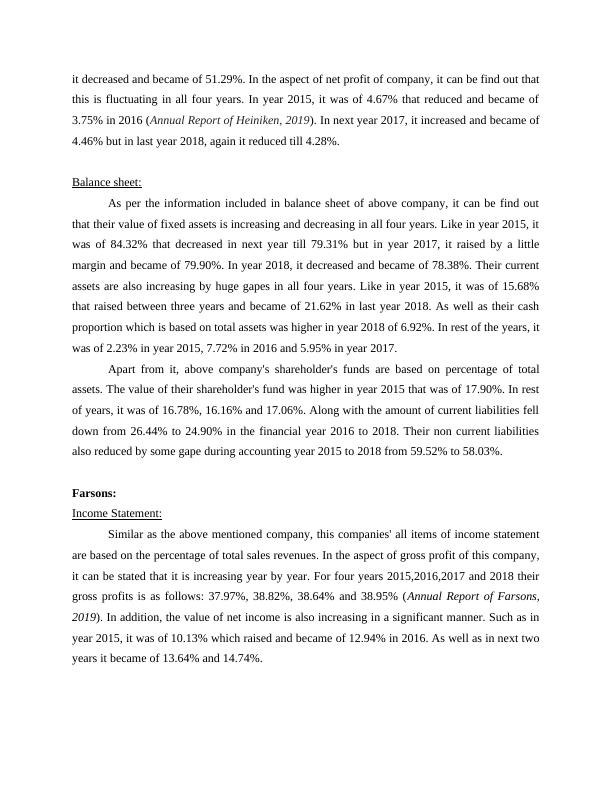
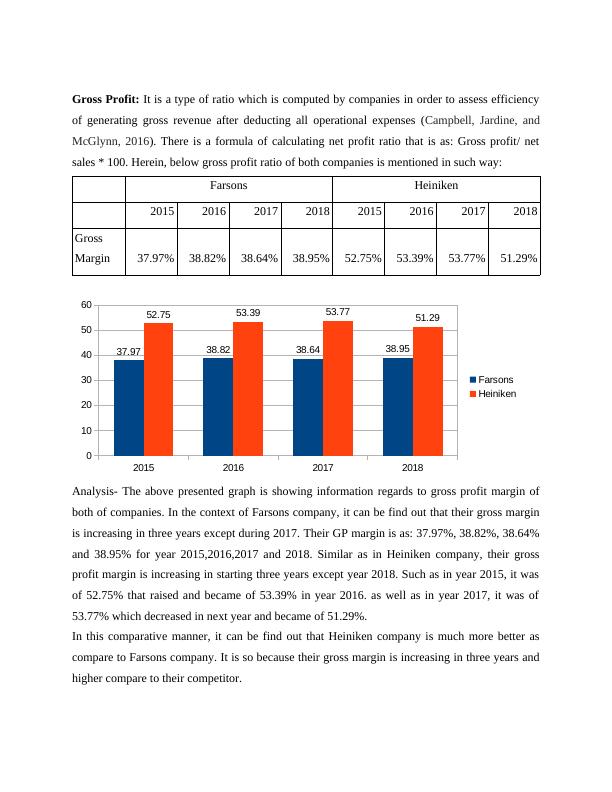
Gross Profit: It is a type of ratio which is computed by companies in order to assess efficiency
of generating gross revenue after deducting all operational expenses (Campbell, Jardine, and
McGlynn, 2016). There is a formula of calculating net profit ratio that is as: Gross profit/ net
sales * 100. Herein, below gross profit ratio of both companies is mentioned in such way:
Farsons Heiniken
2015 2016 2017 2018 2015 2016 2017 2018
Gross
Margin 37.97% 38.82% 38.64% 38.95% 52.75% 53.39% 53.77% 51.29%
2015 2016 2017 2018
0
10
20
30
40
50
60
37.97 38.82 38.64 38.95
52.75 53.39 53.77 51.29
Farsons
Heiniken
Analysis- The above presented graph is showing information regards to gross profit margin of
both of companies. In the context of Farsons company, it can be find out that their gross margin
is increasing in three years except during 2017. Their GP margin is as: 37.97%, 38.82%, 38.64%
and 38.95% for year 2015,2016,2017 and 2018. Similar as in Heiniken company, their gross
profit margin is increasing in starting three years except year 2018. Such as in year 2015, it was
of 52.75% that raised and became of 53.39% in year 2016. as well as in year 2017, it was of
53.77% which decreased in next year and became of 51.29%.
In this comparative manner, it can be find out that Heiniken company is much more better as
compare to Farsons company. It is so because their gross margin is increasing in three years and
higher compare to their competitor.
End of preview
Want to access all the pages? Upload your documents or become a member.
Related Documents
Financial Analysis of Farsons and Heinikenlg...
|33
|6239
|55
Financial Analysis of Farsons and Heiniken: Vertical, Horizontal, and Ratio Analysislg...
|32
|3730
|25
Financial Analysis of Farsons and Heinekenlg...
|11
|3843
|49
Financial Analysis of Farsons and Heinikenlg...
|34
|4021
|20
Financial Analysis of Farsons and Heiniken Companieslg...
|24
|3501
|53
Financial Analysis Management & Enterpriselg...
|33
|4061
|58