Comprehensive Financial Analysis Report: Nick Scali Limited
VerifiedAdded on 2022/08/15
|26
|6940
|21
Report
AI Summary
This report presents a comprehensive financial analysis of Nick Scali Limited, a public limited company operating in the furniture retail and import sector. The analysis is divided into two parts: Part A focuses on ratio analysis, including profitability, asset turnover, liquidity, and solvency ratios, examining trends over a five-year period from 2015 to 2019. The report assesses the company's financial health, efficiency, and leverage, providing insights into its performance. Part B delves into the evaluation of future performance using forecasting and valuation models like the dividend discount model, culminating in conclusions and recommendations. The report highlights the company's increasing net profit margin, consistent return on equity, and efficient use of operating assets, while also acknowledging the impact of financial leverage and asset turnover. The analysis aims to guide internal and external stakeholders in understanding the financial figures and trends within the context of the business environment.
FINANCIAL STATEMENT ANALYSIS
NICK SCALI LIMITED
2/9/2020
Student’s Name:
NICK SCALI LIMITED
2/9/2020
Student’s Name:
Paraphrase This Document
Need a fresh take? Get an instant paraphrase of this document with our AI Paraphraser
FINANCIAL ANALYSIS- NICK SCALI LIMITED
1
Contents
Introduction...........................................................................................................................................2
Organisation background and the Outlook............................................................................................2
Ratio Analysis.......................................................................................................................................3
Profitability Ratios.............................................................................................................................3
Asset turnover....................................................................................................................................7
Cash Flow Position................................................................................................................................8
Liquidity Ratios:................................................................................................................................8
Solvency ratio....................................................................................................................................9
Cash debt coverage ratio..................................................................................................................11
Cash flow return on asset.................................................................................................................11
Forecasting..........................................................................................................................................12
Valuation.............................................................................................................................................16
Recommendations...............................................................................................................................19
References...........................................................................................................................................20
Appendix.............................................................................................................................................22
FINANCIAL ANALYSIS- NICK SCALI LIMITED
2
Introduction
The enhanced globalisation has made the business activities more complex, and a need of
more detailed and efficient presentation of the financial statements to the varied stakeholders.
The process of reviewing the financial statements of an organisation to guide the internal and
external stakeholders is called as the Financial Analysis. The relevancy of the financial
analysis to the external stakeholders is that the same aids in the evaluation of the business
value and value of the investments. In contrast to this, the internal stakeholders use the
financial statement as a monitoring tool, to efficiently manage the varied resources of an
entity. It is imperative to understand the financial figures present in the financial statements
in conjunction with the happenings in the business environment, such as changes in the
political, economic, technological and legal environment and others. Further, the data of
multiple years needs to be analysed to understand the overall trend of the financial
performances. Often the trends are analysed in comparison to the industry benchmarks or the
competitor data.
The following report is prepared with an aim to present a comprehensive financial analysis of
the company Nick Scali Limited. The analysis would be divided into two parts namely the
Part A and the Part B. The Part A would touch the various aspects of the business, and would
be guided by the various financial techniques. In addition to the above, a set of reformatted
financial statements would be provided to guide the detailed analysis of varied items of the
financial statements. The ratio analysis would shed light on the liquidity, solvency,
profitability and overall efficiency of the conduct of the business operations of the entity.
Apart from the above listed; the Part B of the report is inclusive of the evaluation of the
future performances of the entity. This part would include the determination of the forecasted
financial values with the aid of different models such as dividend discount model. An overall
conclusion along with a set of recommendations would be provided at the end to summarise
the key findings and address the issues if any.
Organisation background and the Outlook
The organisation Nick Scali Limited is a public limited company that has been listed on the
Australian Stock Exchange, and the foundation of which was laid down 50 years ago. The
organisation’s chief business is the retailing and the importing of the quality furniture
⊘ This is a preview!⊘
Do you want full access?
Subscribe today to unlock all pages.
Trusted by 1+ million students worldwide
FINANCIAL ANALYSIS- NICK SCALI LIMITED
3
products, to provide the household furniture and the associated accessories (Nick Scali
Limited, 2020). The headquarters of the company is located at Lidcombe, New South Wales,
and the listing of the company shares is done on ASX under the symbol “NCK.” Some of the
chief products of the company include lounges, dining tables, cabinets, rugs, mirrors and
others. The organisation operates under the two brands namely the Sofas2Go and the Nick
Scali Furniture. Over the years, the company has earned the status of a respected and trusted
brand of furniture in terms of the finest quality and the low prices.
PART A
Ratio Analysis
There are various ways to analyse a set of financial statement comprehensively, such as the
trend analysis, vertical analysis and ratio analysis. The technique used in the presented report
is that of the ratio analysis. Computation of ratios is one of most fundamental financial
analysis techniques in which the various ratios give insights about the various aspects of the
financial health. The following report involves the computation of the various ratios for the
period of five financial years, descending from the most recent that is the year 2019. The
analysis of the key ratios is presented as follows.
Profitability Ratios
Determination of the profitability ratios is an important exercise not only for the external
stakeholders such as the regulators and the investors of the company for the decision making
process, but for the internal stakeholders to review the business processes. There are varied
kinds of profitability ratios as computed on the various stages of profitability. The said
earnings are examined against the different elements of the financial statements such as the
assets, revenue, equity and others, and useful insights are gained by comparing and
evaluating the trends (Edmonds, 2013).
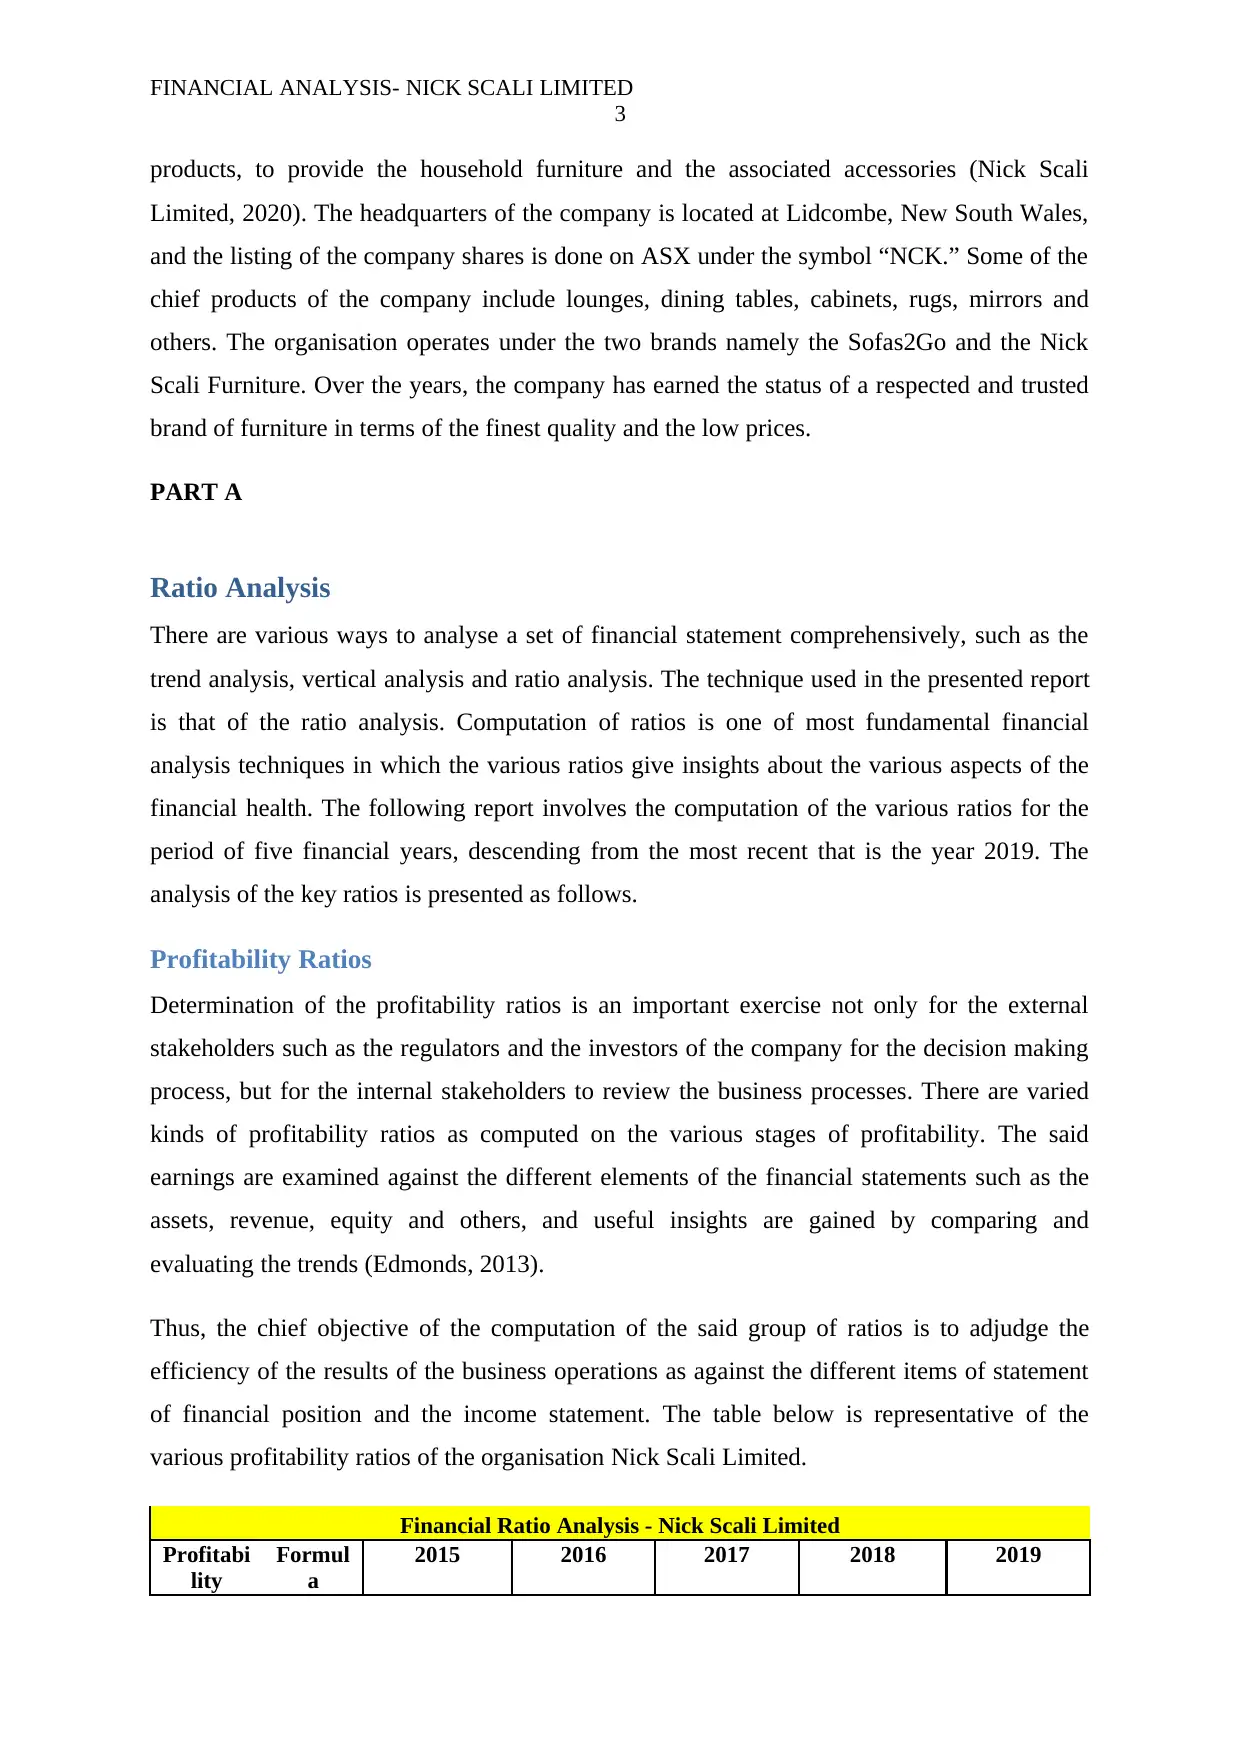
Thus, the chief objective of the computation of the said group of ratios is to adjudge the
efficiency of the results of the business operations as against the different items of statement
of financial position and the income statement. The table below is representative of the
various profitability ratios of the organisation Nick Scali Limited.
Financial Ratio Analysis - Nick Scali Limited
Profitabi
lity
Formul
a
2015 2016 2017 2018 2019
3
products, to provide the household furniture and the associated accessories (Nick Scali
Limited, 2020). The headquarters of the company is located at Lidcombe, New South Wales,
and the listing of the company shares is done on ASX under the symbol “NCK.” Some of the
chief products of the company include lounges, dining tables, cabinets, rugs, mirrors and
others. The organisation operates under the two brands namely the Sofas2Go and the Nick
Scali Furniture. Over the years, the company has earned the status of a respected and trusted
brand of furniture in terms of the finest quality and the low prices.
PART A
Ratio Analysis
There are various ways to analyse a set of financial statement comprehensively, such as the
trend analysis, vertical analysis and ratio analysis. The technique used in the presented report
is that of the ratio analysis. Computation of ratios is one of most fundamental financial
analysis techniques in which the various ratios give insights about the various aspects of the
financial health. The following report involves the computation of the various ratios for the
period of five financial years, descending from the most recent that is the year 2019. The
analysis of the key ratios is presented as follows.
Profitability Ratios
Determination of the profitability ratios is an important exercise not only for the external
stakeholders such as the regulators and the investors of the company for the decision making
process, but for the internal stakeholders to review the business processes. There are varied
kinds of profitability ratios as computed on the various stages of profitability. The said
earnings are examined against the different elements of the financial statements such as the
assets, revenue, equity and others, and useful insights are gained by comparing and
evaluating the trends (Edmonds, 2013).
Thus, the chief objective of the computation of the said group of ratios is to adjudge the
efficiency of the results of the business operations as against the different items of statement
of financial position and the income statement. The table below is representative of the
various profitability ratios of the organisation Nick Scali Limited.
Financial Ratio Analysis - Nick Scali Limited
Profitabi
lity
Formul
a
2015 2016 2017 2018 2019
Paraphrase This Document
Need a fresh take? Get an instant paraphrase of this document with our AI Paraphraser
FINANCIAL ANALYSIS- NICK SCALI LIMITED
4
Ratios
Return
on
Equity
Profit /
Averag
e equity
17077/
(46226+4013
0)/2
26150/
(57794+462
26)/2
37236/
(70384+577
94)/2
40979/
(83663+7038
4)/2
42116/
(85183+836
63)/2
=0.09887558
5
=0.1256969
81
=0.1452511
35
=0.13300810
8
=0.1247171
98
9.89% 12.57% 14.53% 13.30% 12.47%
Return
on Net
Operatin
g Assets
Net
profit /
Net
Operati
ng
Assets 17077/60772
26150/8108
7 37236/93746
40979/10264
3
42116/11141
0
=0.28100111
9
=0.3224931
25
=0.3972009
47
=0.39923813
6
=0.3780271
07
28.10% 32.25% 39.72% 40% 38%
Net
Profit
Margin
Net
profit /
Sales or
revenue
17077/15719
5
26150/2044
73
37236/23448
2
40979/25271
6
42116/27021
0
0.108635771 0.127889746 0.158801102 0.162154355 0.155863958
10.86% 12.79% 15.88% 16% 16%
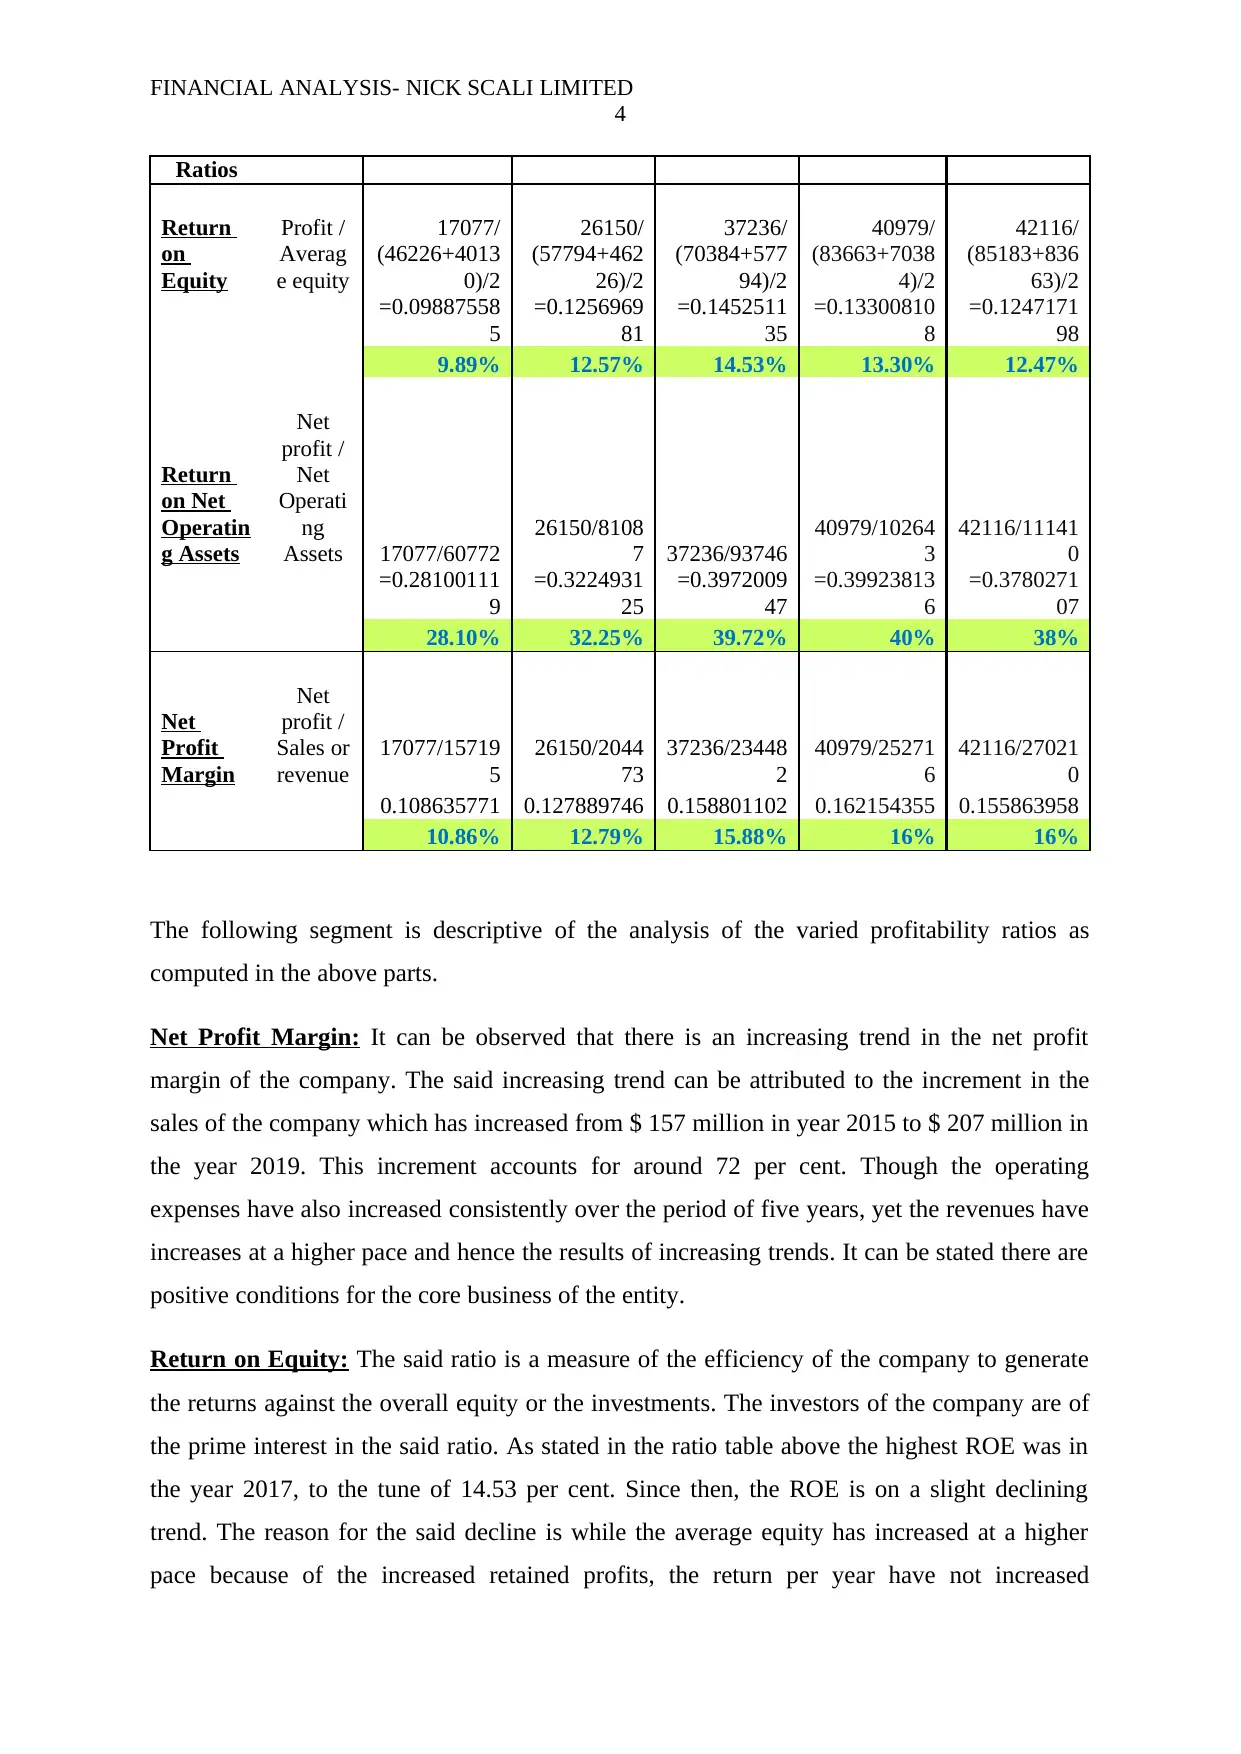
The following segment is descriptive of the analysis of the varied profitability ratios as
computed in the above parts.
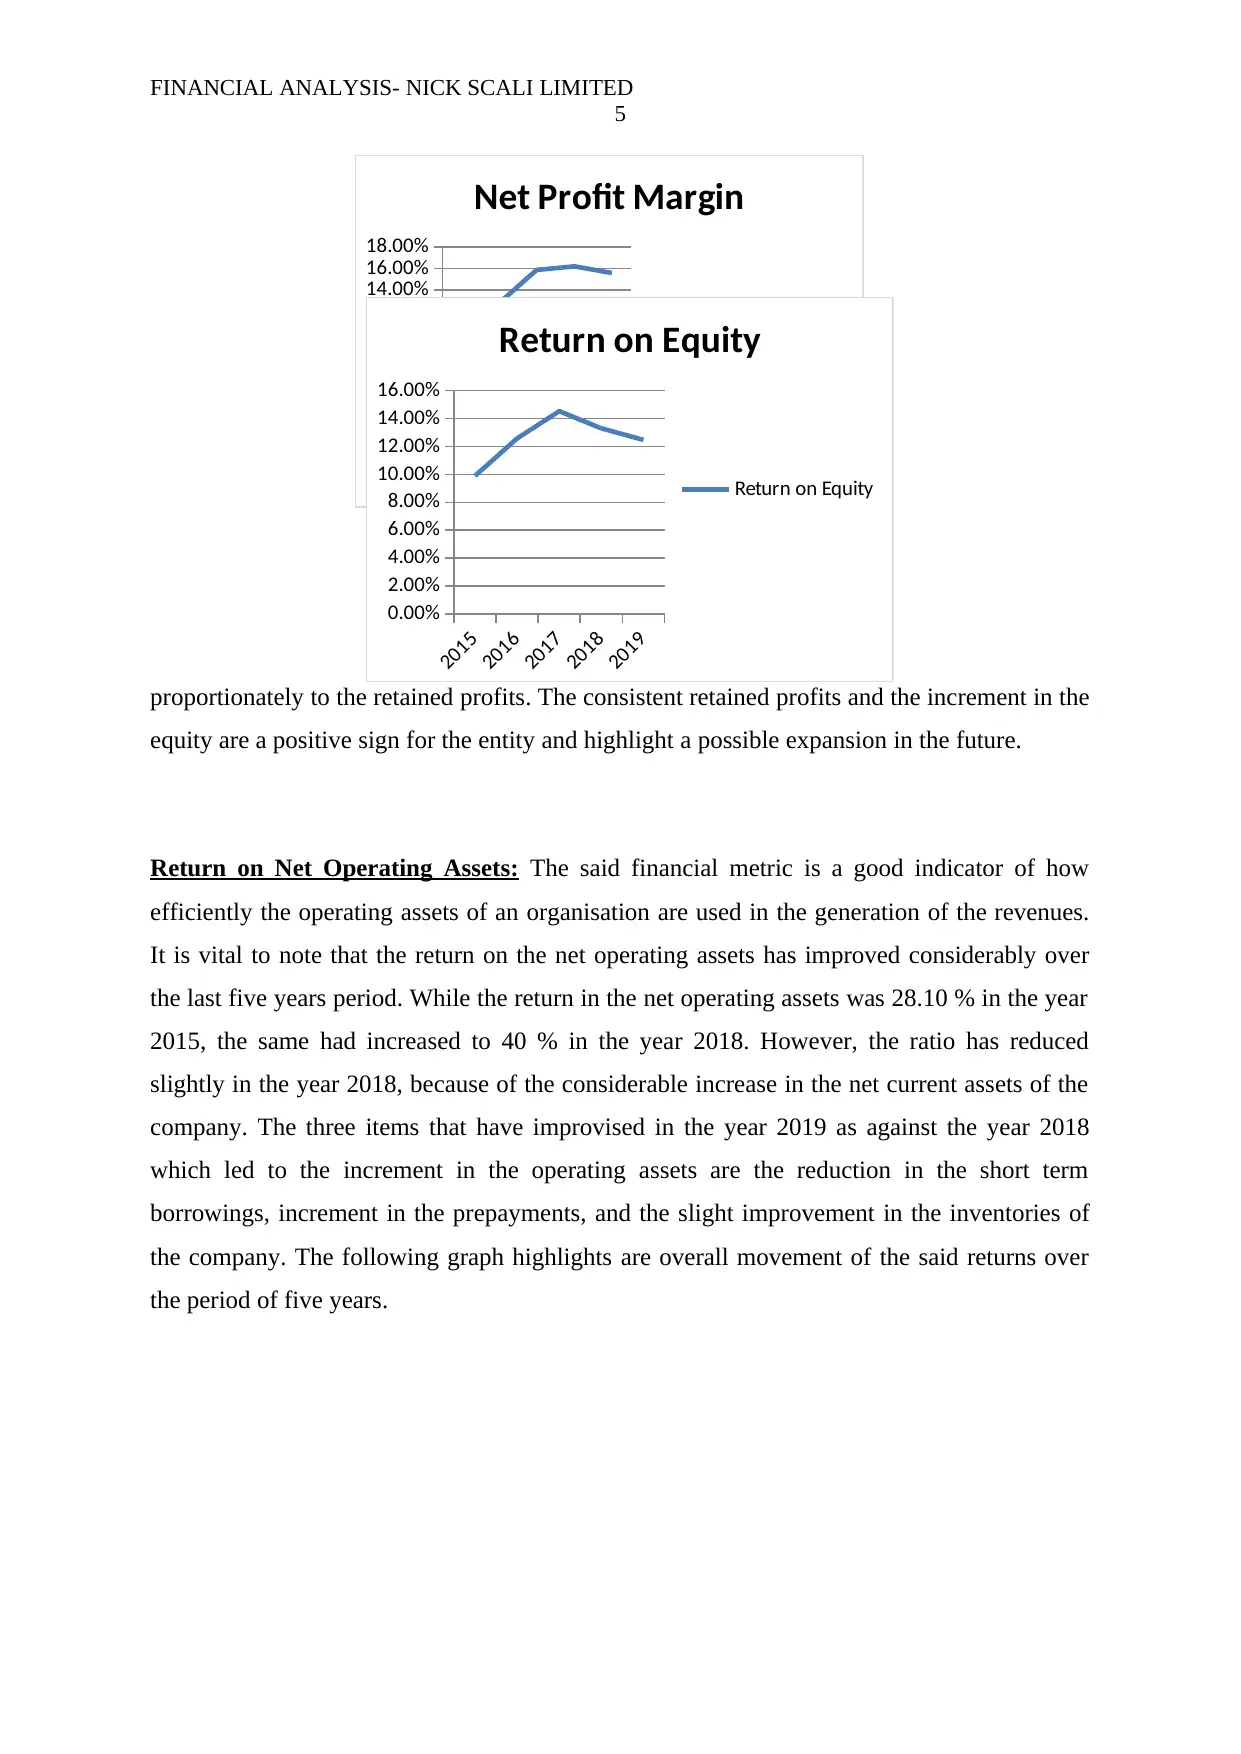
Net Profit Margin: It can be observed that there is an increasing trend in the net profit
margin of the company. The said increasing trend can be attributed to the increment in the
sales of the company which has increased from $ 157 million in year 2015 to $ 207 million in
the year 2019. This increment accounts for around 72 per cent. Though the operating
expenses have also increased consistently over the period of five years, yet the revenues have
increases at a higher pace and hence the results of increasing trends. It can be stated there are
positive conditions for the core business of the entity.
Return on Equity: The said ratio is a measure of the efficiency of the company to generate
the returns against the overall equity or the investments. The investors of the company are of
the prime interest in the said ratio. As stated in the ratio table above the highest ROE was in
the year 2017, to the tune of 14.53 per cent. Since then, the ROE is on a slight declining
trend. The reason for the said decline is while the average equity has increased at a higher
pace because of the increased retained profits, the return per year have not increased
4
Ratios
Return
on
Equity
Profit /
Averag
e equity
17077/
(46226+4013
0)/2
26150/
(57794+462
26)/2
37236/
(70384+577
94)/2
40979/
(83663+7038
4)/2
42116/
(85183+836
63)/2
=0.09887558
5
=0.1256969
81
=0.1452511
35
=0.13300810
8
=0.1247171
98
9.89% 12.57% 14.53% 13.30% 12.47%
Return
on Net
Operatin
g Assets
Net
profit /
Net
Operati
ng
Assets 17077/60772
26150/8108
7 37236/93746
40979/10264
3
42116/11141
0
=0.28100111
9
=0.3224931
25
=0.3972009
47
=0.39923813
6
=0.3780271
07
28.10% 32.25% 39.72% 40% 38%
Net
Profit
Margin
Net
profit /
Sales or
revenue
17077/15719
5
26150/2044
73
37236/23448
2
40979/25271
6
42116/27021
0
0.108635771 0.127889746 0.158801102 0.162154355 0.155863958
10.86% 12.79% 15.88% 16% 16%
The following segment is descriptive of the analysis of the varied profitability ratios as
computed in the above parts.
Net Profit Margin: It can be observed that there is an increasing trend in the net profit
margin of the company. The said increasing trend can be attributed to the increment in the
sales of the company which has increased from $ 157 million in year 2015 to $ 207 million in
the year 2019. This increment accounts for around 72 per cent. Though the operating
expenses have also increased consistently over the period of five years, yet the revenues have
increases at a higher pace and hence the results of increasing trends. It can be stated there are
positive conditions for the core business of the entity.
Return on Equity: The said ratio is a measure of the efficiency of the company to generate
the returns against the overall equity or the investments. The investors of the company are of
the prime interest in the said ratio. As stated in the ratio table above the highest ROE was in
the year 2017, to the tune of 14.53 per cent. Since then, the ROE is on a slight declining
trend. The reason for the said decline is while the average equity has increased at a higher
pace because of the increased retained profits, the return per year have not increased
FINANCIAL ANALYSIS- NICK SCALI LIMITED
5
proportionately to the retained profits. The consistent retained profits and the increment in the
equity are a positive sign for the entity and highlight a possible expansion in the future.
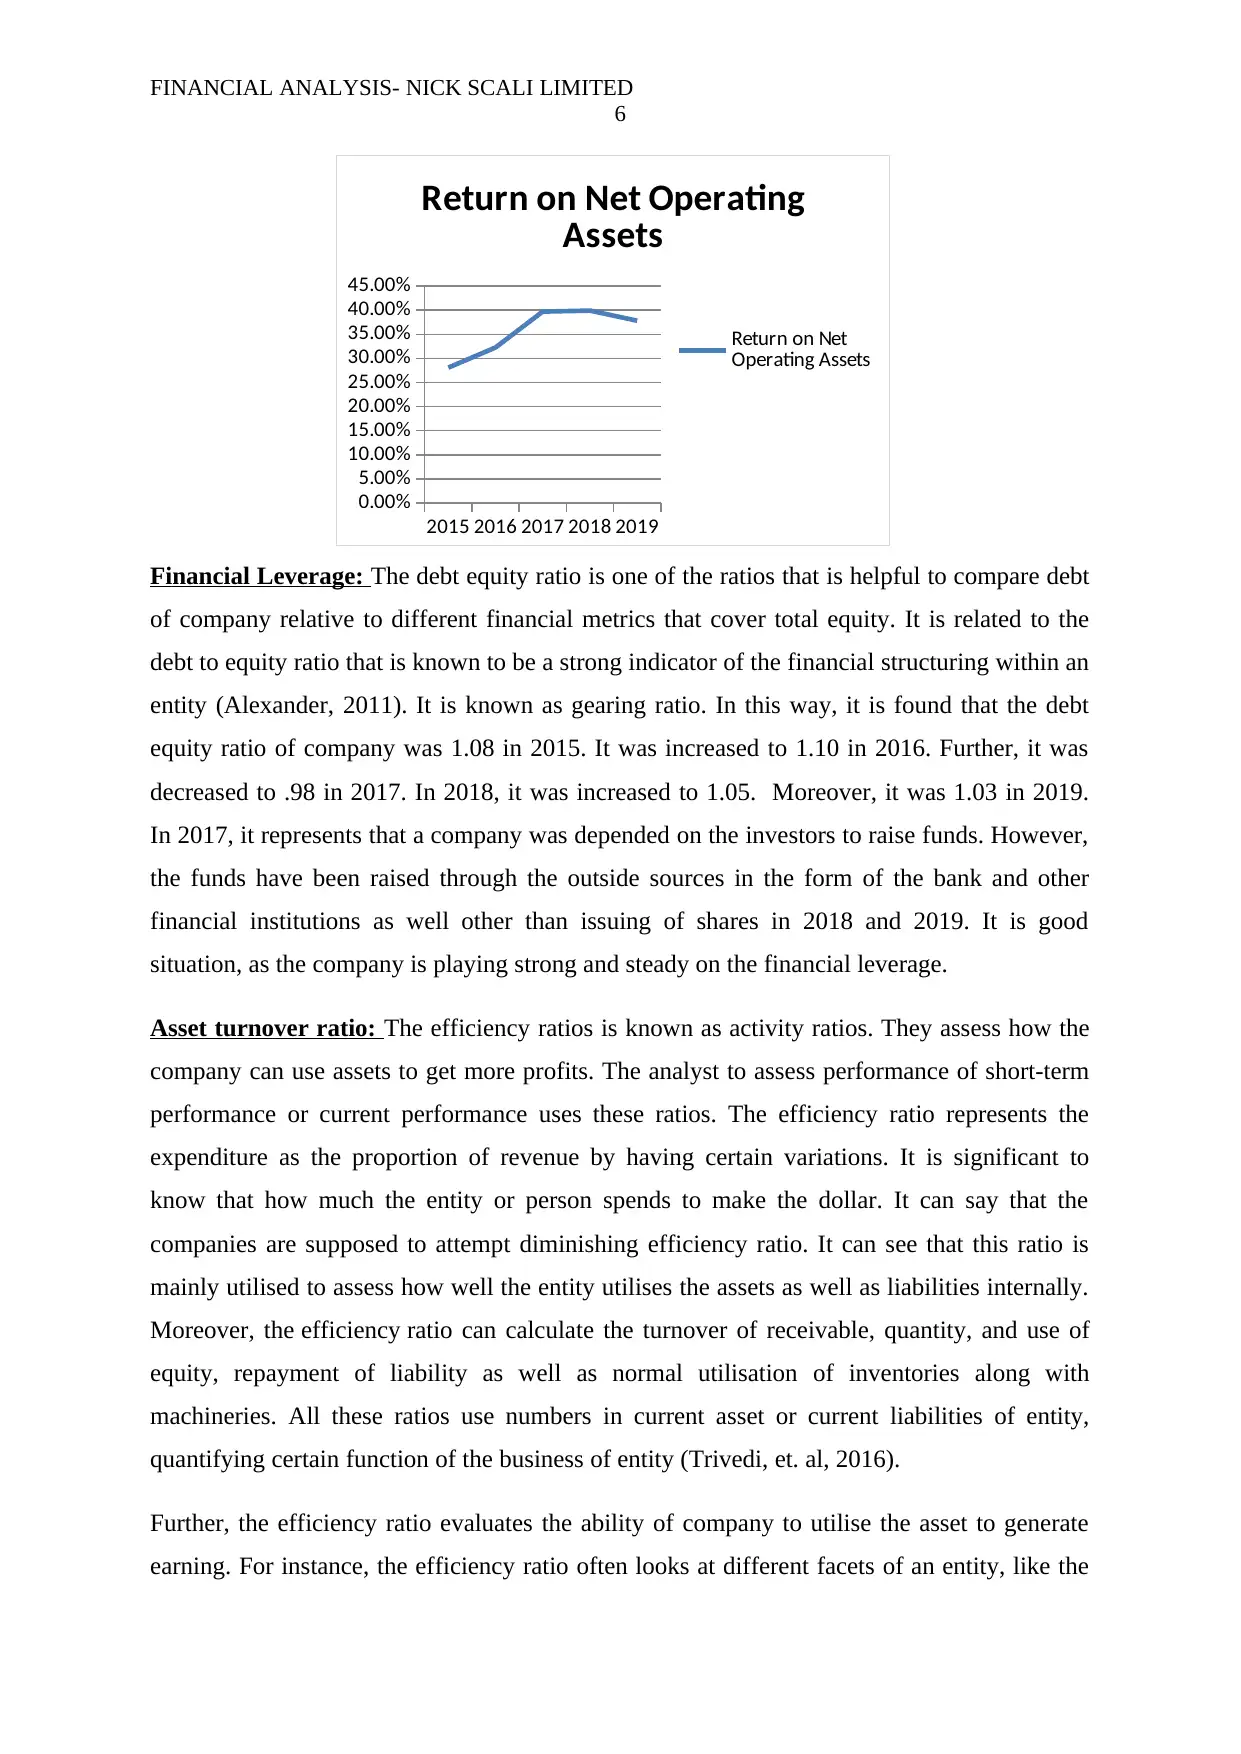
Return on Net Operating Assets: The said financial metric is a good indicator of how
efficiently the operating assets of an organisation are used in the generation of the revenues.
It is vital to note that the return on the net operating assets has improved considerably over
the last five years period. While the return in the net operating assets was 28.10 % in the year
2015, the same had increased to 40 % in the year 2018. However, the ratio has reduced
slightly in the year 2018, because of the considerable increase in the net current assets of the
company. The three items that have improvised in the year 2019 as against the year 2018
which led to the increment in the operating assets are the reduction in the short term
borrowings, increment in the prepayments, and the slight improvement in the inventories of
the company. The following graph highlights are overall movement of the said returns over
the period of five years.
2015
2016
2017
2018
2019
0.00%
2.00%
4.00%
6.00%
8.00%
10.00%
12.00%
14.00%
16.00%
18.00%
Net Profit Margin
Net Profit Margin
2015
2016
2017
2018
2019
0.00%
2.00%
4.00%
6.00%
8.00%
10.00%
12.00%
14.00%
16.00%
Return on Equity
Return on Equity
5
proportionately to the retained profits. The consistent retained profits and the increment in the
equity are a positive sign for the entity and highlight a possible expansion in the future.
Return on Net Operating Assets: The said financial metric is a good indicator of how
efficiently the operating assets of an organisation are used in the generation of the revenues.
It is vital to note that the return on the net operating assets has improved considerably over
the last five years period. While the return in the net operating assets was 28.10 % in the year
2015, the same had increased to 40 % in the year 2018. However, the ratio has reduced
slightly in the year 2018, because of the considerable increase in the net current assets of the
company. The three items that have improvised in the year 2019 as against the year 2018
which led to the increment in the operating assets are the reduction in the short term
borrowings, increment in the prepayments, and the slight improvement in the inventories of
the company. The following graph highlights are overall movement of the said returns over
the period of five years.
2015
2016
2017
2018
2019
0.00%
2.00%
4.00%
6.00%
8.00%
10.00%
12.00%
14.00%
16.00%
18.00%
Net Profit Margin
Net Profit Margin
2015
2016
2017
2018
2019
0.00%
2.00%
4.00%
6.00%
8.00%
10.00%
12.00%
14.00%
16.00%
Return on Equity
Return on Equity
⊘ This is a preview!⊘
Do you want full access?
Subscribe today to unlock all pages.
Trusted by 1+ million students worldwide
FINANCIAL ANALYSIS- NICK SCALI LIMITED
6
Financial Leverage: The debt equity ratio is one of the ratios that is helpful to compare debt
of company relative to different financial metrics that cover total equity. It is related to the
debt to equity ratio that is known to be a strong indicator of the financial structuring within an
entity (Alexander, 2011). It is known as gearing ratio. In this way, it is found that the debt
equity ratio of company was 1.08 in 2015. It was increased to 1.10 in 2016. Further, it was
decreased to .98 in 2017. In 2018, it was increased to 1.05. Moreover, it was 1.03 in 2019.
In 2017, it represents that a company was depended on the investors to raise funds. However,
the funds have been raised through the outside sources in the form of the bank and other
financial institutions as well other than issuing of shares in 2018 and 2019. It is good
situation, as the company is playing strong and steady on the financial leverage.
Asset turnover ratio: The efficiency ratios is known as activity ratios. They assess how the
company can use assets to get more profits. The analyst to assess performance of short-term
performance or current performance uses these ratios. The efficiency ratio represents the
expenditure as the proportion of revenue by having certain variations. It is significant to
know that how much the entity or person spends to make the dollar. It can say that the
companies are supposed to attempt diminishing efficiency ratio. It can see that this ratio is
mainly utilised to assess how well the entity utilises the assets as well as liabilities internally.
Moreover, the efficiency ratio can calculate the turnover of receivable, quantity, and use of
equity, repayment of liability as well as normal utilisation of inventories along with
machineries. All these ratios use numbers in current asset or current liabilities of entity,
quantifying certain function of the business of entity (Trivedi, et. al, 2016).
Further, the efficiency ratio evaluates the ability of company to utilise the asset to generate
earning. For instance, the efficiency ratio often looks at different facets of an entity, like the
2015 2016 2017 2018 2019
0.00%
5.00%
10.00%
15.00%
20.00%
25.00%
30.00%
35.00%
40.00%
45.00%
Return on Net Operating
Assets
Return on Net
Operating Assets
Paraphrase This Document
Need a fresh take? Get an instant paraphrase of this document with our AI Paraphraser
FINANCIAL ANALYSIS- NICK SCALI LIMITED
7
time to take cash from customer or the amount of time to change inventory into cash. In this
way, it creates the efficiency ratios significant. The main reason is that the improvement in
efficiency ratio generally transforms to developed profitability (West, 2018). In this way, the
efficiency ratios are best to be used to know how to reduce expenses as well as increase
earnings. It can that the efficiency of company can be assessed from different ratios. These
efficiency ratios are accounts receivable turnover, sale to inventory, asset turnover, accounts
payable to sales, sales to net working capital, cash flow return on asset, stock turnover ratio
as well as asset turnover ratios. The asset turnover ratio as well as cash flow return on asset
are significant to measure company’s efficiency (Williams and Dobelman, 2017). These two
ratios are discussed below -
Asset turnover
The asset turnover ratio is helpful in measuring the value of sales or revenue of company
relative to value of company’s assets. The asset turnover ratio is assessed annually. The
company uses this ratio as the indicator of the efficiency with which the entity is utilising
the assets to get income. The higher the asset turnover ratio, the more efficient a company. It
can say that high asset turnover ratio states that company is doing well. The high ratios states
that the company is making revenue per dollar of the asset. On the other hand, if the entity
has lower asset turnover ratio, it means that company is not using assets effectively to
generate revenue. It is assessed that the asset turnover ratio was 1.78 in 2015. It was slightly
increased to 1.88 in 2016. Further, it was slightly decreased to 1.83 in 2017 and 1.63 in 2018.
It was 1.57 in 2019. It means company is not doing well. In this way, the entity can improve
the low asset turnover ratio by constantly utilising assets restraining purchase of inventories,
as well as make sales without buying new assets (Satryo, Rokhmania and Diptyana, 2017).
FINANCIAL ANALYSIS- NICK SCALI LIMITED
8
Cash Flow Position
Liquidity Ratios:
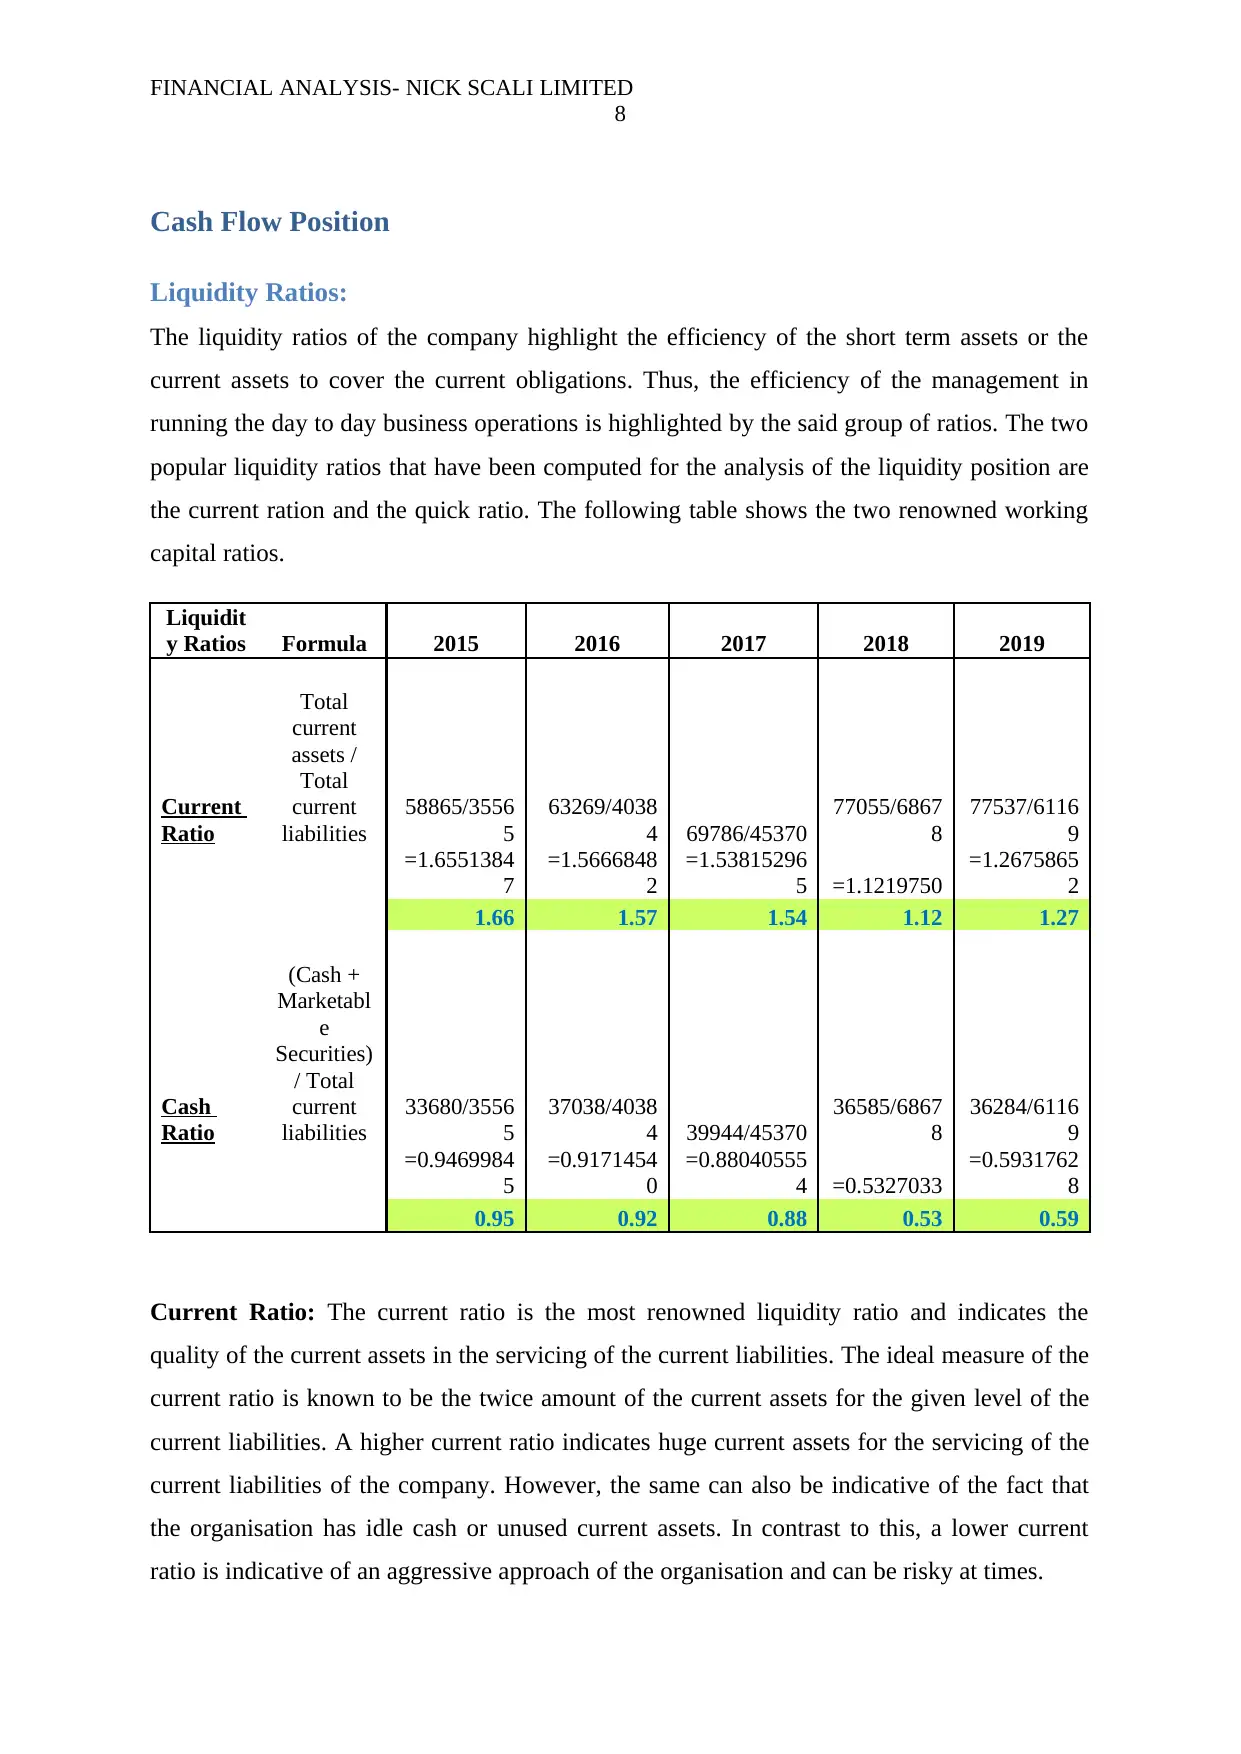
The liquidity ratios of the company highlight the efficiency of the short term assets or the
current assets to cover the current obligations. Thus, the efficiency of the management in
running the day to day business operations is highlighted by the said group of ratios. The two
popular liquidity ratios that have been computed for the analysis of the liquidity position are
the current ration and the quick ratio. The following table shows the two renowned working
capital ratios.
Liquidit
y Ratios Formula 2015 2016 2017 2018 2019
Current
Ratio
Total
current
assets /
Total
current
liabilities
58865/3556
5
63269/4038
4 69786/45370
77055/6867
8
77537/6116
9
=1.6551384
7
=1.5666848
2
=1.53815296
5 =1.1219750
=1.2675865
2
1.66 1.57 1.54 1.12 1.27
Cash
Ratio
(Cash +
Marketabl
e
Securities)
/ Total
current
liabilities
33680/3556
5
37038/4038
4 39944/45370
36585/6867
8
36284/6116
9
=0.9469984
5
=0.9171454
0
=0.88040555
4 =0.5327033
=0.5931762
8
0.95 0.92 0.88 0.53 0.59
Current Ratio: The current ratio is the most renowned liquidity ratio and indicates the
quality of the current assets in the servicing of the current liabilities. The ideal measure of the
current ratio is known to be the twice amount of the current assets for the given level of the
current liabilities. A higher current ratio indicates huge current assets for the servicing of the
current liabilities of the company. However, the same can also be indicative of the fact that
the organisation has idle cash or unused current assets. In contrast to this, a lower current
ratio is indicative of an aggressive approach of the organisation and can be risky at times.
8
Cash Flow Position
Liquidity Ratios:
The liquidity ratios of the company highlight the efficiency of the short term assets or the
current assets to cover the current obligations. Thus, the efficiency of the management in
running the day to day business operations is highlighted by the said group of ratios. The two
popular liquidity ratios that have been computed for the analysis of the liquidity position are
the current ration and the quick ratio. The following table shows the two renowned working
capital ratios.
Liquidit
y Ratios Formula 2015 2016 2017 2018 2019
Current
Ratio
Total
current
assets /
Total
current
liabilities
58865/3556
5
63269/4038
4 69786/45370
77055/6867
8
77537/6116
9
=1.6551384
7
=1.5666848
2
=1.53815296
5 =1.1219750
=1.2675865
2
1.66 1.57 1.54 1.12 1.27
Cash
Ratio
(Cash +
Marketabl
e
Securities)
/ Total
current
liabilities
33680/3556
5
37038/4038
4 39944/45370
36585/6867
8
36284/6116
9
=0.9469984
5
=0.9171454
0
=0.88040555
4 =0.5327033
=0.5931762
8
0.95 0.92 0.88 0.53 0.59
Current Ratio: The current ratio is the most renowned liquidity ratio and indicates the
quality of the current assets in the servicing of the current liabilities. The ideal measure of the
current ratio is known to be the twice amount of the current assets for the given level of the
current liabilities. A higher current ratio indicates huge current assets for the servicing of the
current liabilities of the company. However, the same can also be indicative of the fact that
the organisation has idle cash or unused current assets. In contrast to this, a lower current
ratio is indicative of an aggressive approach of the organisation and can be risky at times.
⊘ This is a preview!⊘
Do you want full access?
Subscribe today to unlock all pages.
Trusted by 1+ million students worldwide

FINANCIAL ANALYSIS- NICK SCALI LIMITED
9
9
Paraphrase This Document
Need a fresh take? Get an instant paraphrase of this document with our AI Paraphraser
FINANCIAL ANALYSIS- NICK SCALI LIMITED
10
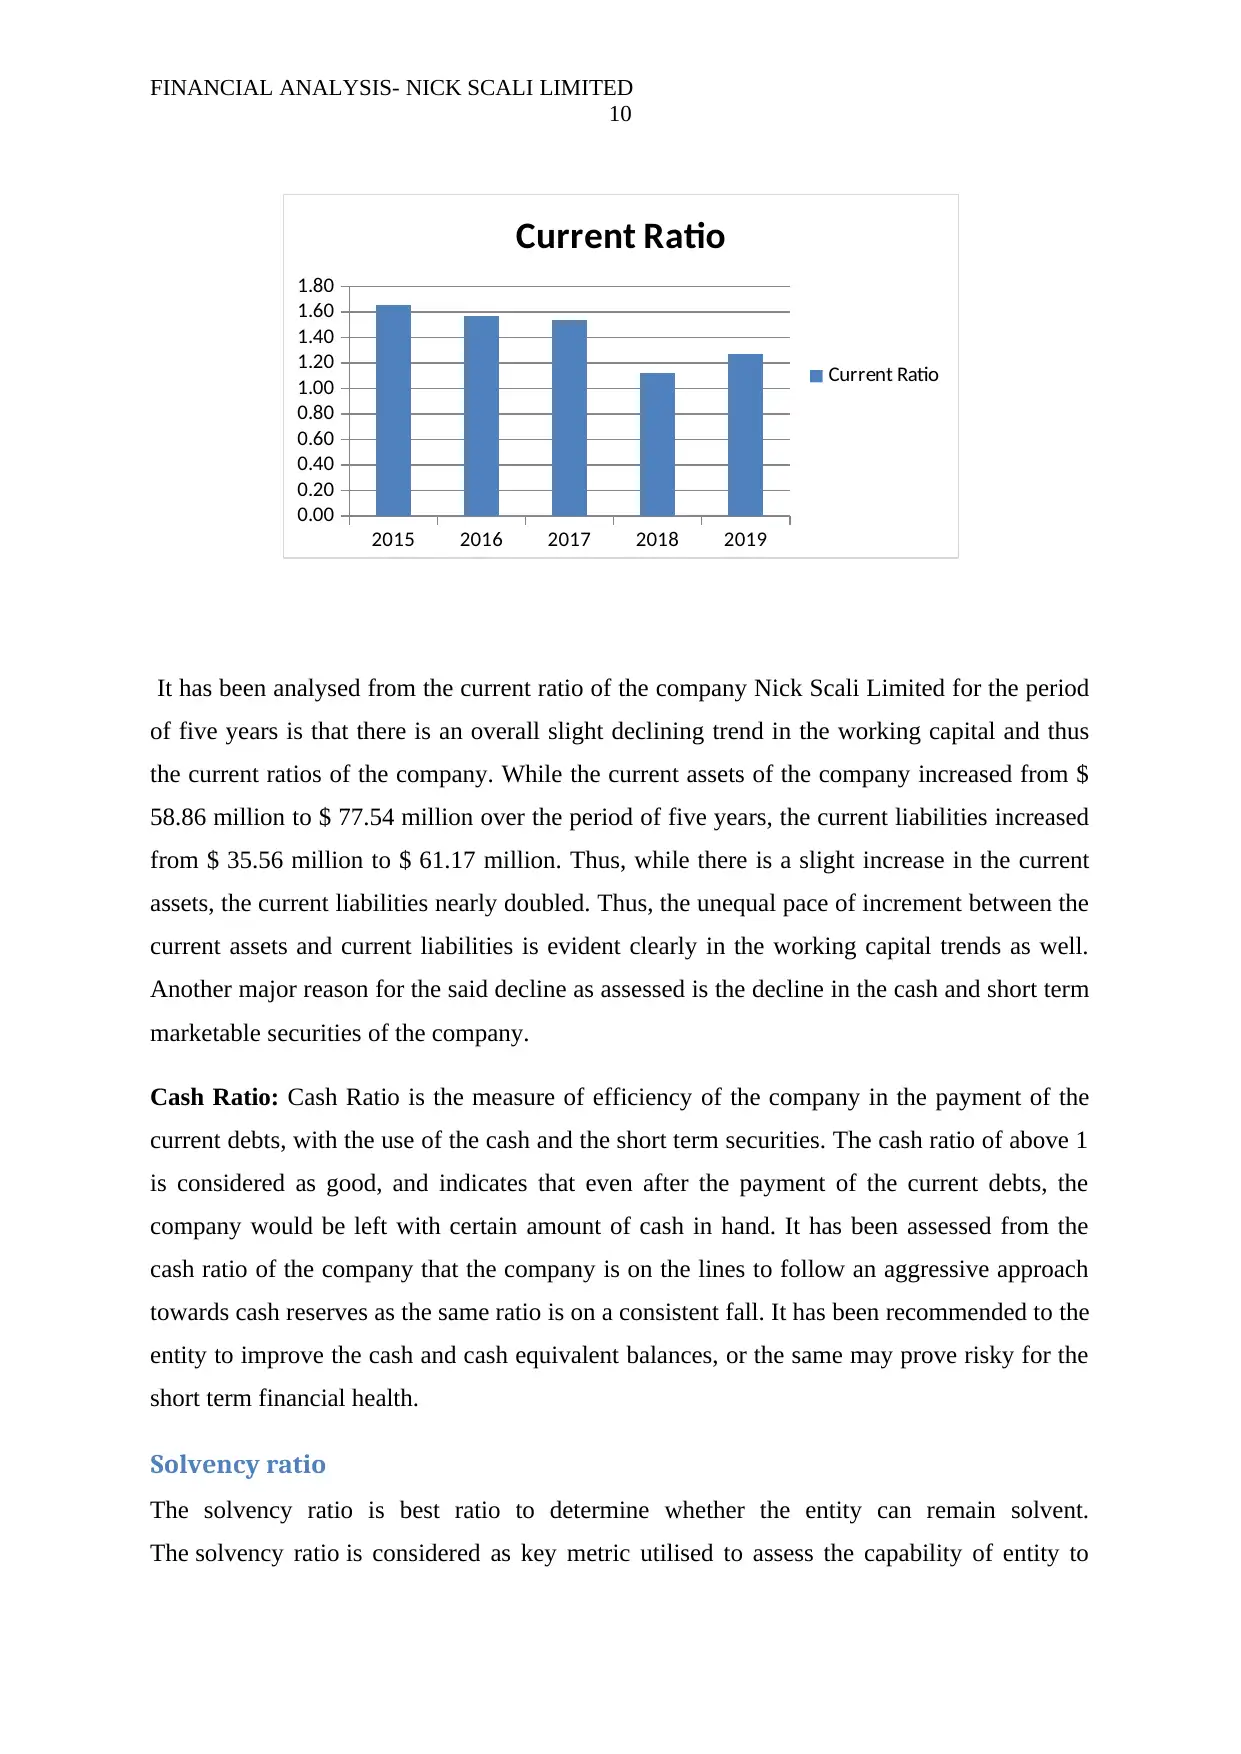
It has been analysed from the current ratio of the company Nick Scali Limited for the period
of five years is that there is an overall slight declining trend in the working capital and thus
the current ratios of the company. While the current assets of the company increased from $
58.86 million to $ 77.54 million over the period of five years, the current liabilities increased
from $ 35.56 million to $ 61.17 million. Thus, while there is a slight increase in the current
assets, the current liabilities nearly doubled. Thus, the unequal pace of increment between the
current assets and current liabilities is evident clearly in the working capital trends as well.
Another major reason for the said decline as assessed is the decline in the cash and short term
marketable securities of the company.
Cash Ratio: Cash Ratio is the measure of efficiency of the company in the payment of the
current debts, with the use of the cash and the short term securities. The cash ratio of above 1
is considered as good, and indicates that even after the payment of the current debts, the
company would be left with certain amount of cash in hand. It has been assessed from the
cash ratio of the company that the company is on the lines to follow an aggressive approach
towards cash reserves as the same ratio is on a consistent fall. It has been recommended to the
entity to improve the cash and cash equivalent balances, or the same may prove risky for the
short term financial health.
Solvency ratio
The solvency ratio is best ratio to determine whether the entity can remain solvent.
The solvency ratio is considered as key metric utilised to assess the capability of entity to
2015 2016 2017 2018 2019
0.00
0.20
0.40
0.60
0.80
1.00
1.20
1.40
1.60
1.80
Current Ratio
Current Ratio
10
It has been analysed from the current ratio of the company Nick Scali Limited for the period
of five years is that there is an overall slight declining trend in the working capital and thus
the current ratios of the company. While the current assets of the company increased from $
58.86 million to $ 77.54 million over the period of five years, the current liabilities increased
from $ 35.56 million to $ 61.17 million. Thus, while there is a slight increase in the current
assets, the current liabilities nearly doubled. Thus, the unequal pace of increment between the
current assets and current liabilities is evident clearly in the working capital trends as well.
Another major reason for the said decline as assessed is the decline in the cash and short term
marketable securities of the company.
Cash Ratio: Cash Ratio is the measure of efficiency of the company in the payment of the
current debts, with the use of the cash and the short term securities. The cash ratio of above 1
is considered as good, and indicates that even after the payment of the current debts, the
company would be left with certain amount of cash in hand. It has been assessed from the
cash ratio of the company that the company is on the lines to follow an aggressive approach
towards cash reserves as the same ratio is on a consistent fall. It has been recommended to the
entity to improve the cash and cash equivalent balances, or the same may prove risky for the
short term financial health.
Solvency ratio
The solvency ratio is best ratio to determine whether the entity can remain solvent.
The solvency ratio is considered as key metric utilised to assess the capability of entity to
2015 2016 2017 2018 2019
0.00
0.20
0.40
0.60
0.80
1.00
1.20
1.40
1.60
1.80
Current Ratio
Current Ratio
FINANCIAL ANALYSIS- NICK SCALI LIMITED
11
fulfil the obligation related to debts. This ratio is helpful in measuring the extent to which
asset covers commitment for the payment in upcoming period. Solvency ratio of the entity is
considered as size of the capital relative to risk taken by it. It can say that the future business
lender uses this ratio. It is indicated by the solvency ratio that whether the cash flow of
company is sufficient to fulfil the short-term liabilities as well as long-term liabilities. It is
evident that the lower solvency ratio of company leads the great possibility that this would
default on the debts obligation (Salawau, 2017).
Further, the solvency ratio is considered as wide-ranging measure of solvency. The main
reason is that it is helpful in assessing the actual cash flow of company in place of net income
by including depreciation again and non-cash expenditure to measure the ability of company
to stay afloat. It is evident that the solvency ratio assesses the cash flow ability regarding the
liabilities in place of only short-term debts. Therefore, one can use the solvency ratio to
assess long-term health of company by assessing the capability of repayment for the long-
term debts as well as interest on long-term debt. In general, the solvency ratio more than
twenty per cent is considered fiscally sound. However, this ratio can differ from industry to
industry. In this way, the entity is capable to close out the long-term debt obligation when
they become due utilising operating revenue. Henceforth, the lenders will usually use the
solvency ratio as a factor for soundness by assessing the financial statement of company. The
solvency ratio examines a company's ability to meet its long-term obligations. This ratio is
utilised by potential lenders at the time of assessing creditworthiness of company. A higher
ratio percentage result indicates a company's increased ability to cover its liabilities over the
long term. There are different solvency ratios to assess the solvency of company. These are
debt to equity as well as equity ratio. These are discussed as below-
The equity ratio is solvency ratio. It is helpful in measuring the amount of asset that is funded
by owners' investment by making comparison with total equity in organisation to total assets.
This ratio puts focus on the two significant financial concepts of solvent operations of
company. The low equity ratio shows that the company has used more debt to pay for the
assets. This ratio also states that how much shareholder will get at the time of liquidation
(Singh, 2017). The ratio states the dependency of company on debt. It also shows stability of
company. The equity ratio of company was 0.48 in 2015 and 2016. It was increased to .51 in
2017. Further, it was decreased to .49 in 2018 and 2019. It means company is doing well. The
⊘ This is a preview!⊘
Do you want full access?
Subscribe today to unlock all pages.
Trusted by 1+ million students worldwide
1 out of 26
Related Documents


Your All-in-One AI-Powered Toolkit for Academic Success.
+13062052269
info@desklib.com
Available 24*7 on WhatsApp / Email
![[object Object]](/_next/static/media/star-bottom.7253800d.svg)
Unlock your academic potential
Copyright © 2020–2026 A2Z Services. All Rights Reserved. Developed and managed by ZUCOL.