Introduction to Financial Analysis Contents
Added on 2020-03-07
16 Pages1717 Words95 Views
1Financial Analysis

2ContentsIntroduction................................................................................................................................3Financial Analysis of all the four companies.............................................................................3Growth over the years................................................................................................................3Annual rate of growth in revenue...........................................................................................3Annual rate of growth in earnings per share..........................................................................4Annual rate of growth in dividends........................................................................................5Profitability Ratios.....................................................................................................................6Gross Margin..........................................................................................................................6Operating Margin...................................................................................................................8Pre Tax Margin (EBT Margin)...............................................................................................9Net Income Margin...............................................................................................................10Return on Assets...................................................................................................................12Return on Equity...................................................................................................................13Efficiency Ratios......................................................................................................................14Solvency Ratio.........................................................................................................................15Financial leverage Ratio.......................................................................................................15Comments on the Ratio Analysis.............................................................................................16Conclusion................................................................................................................................17References................................................................................................................................18
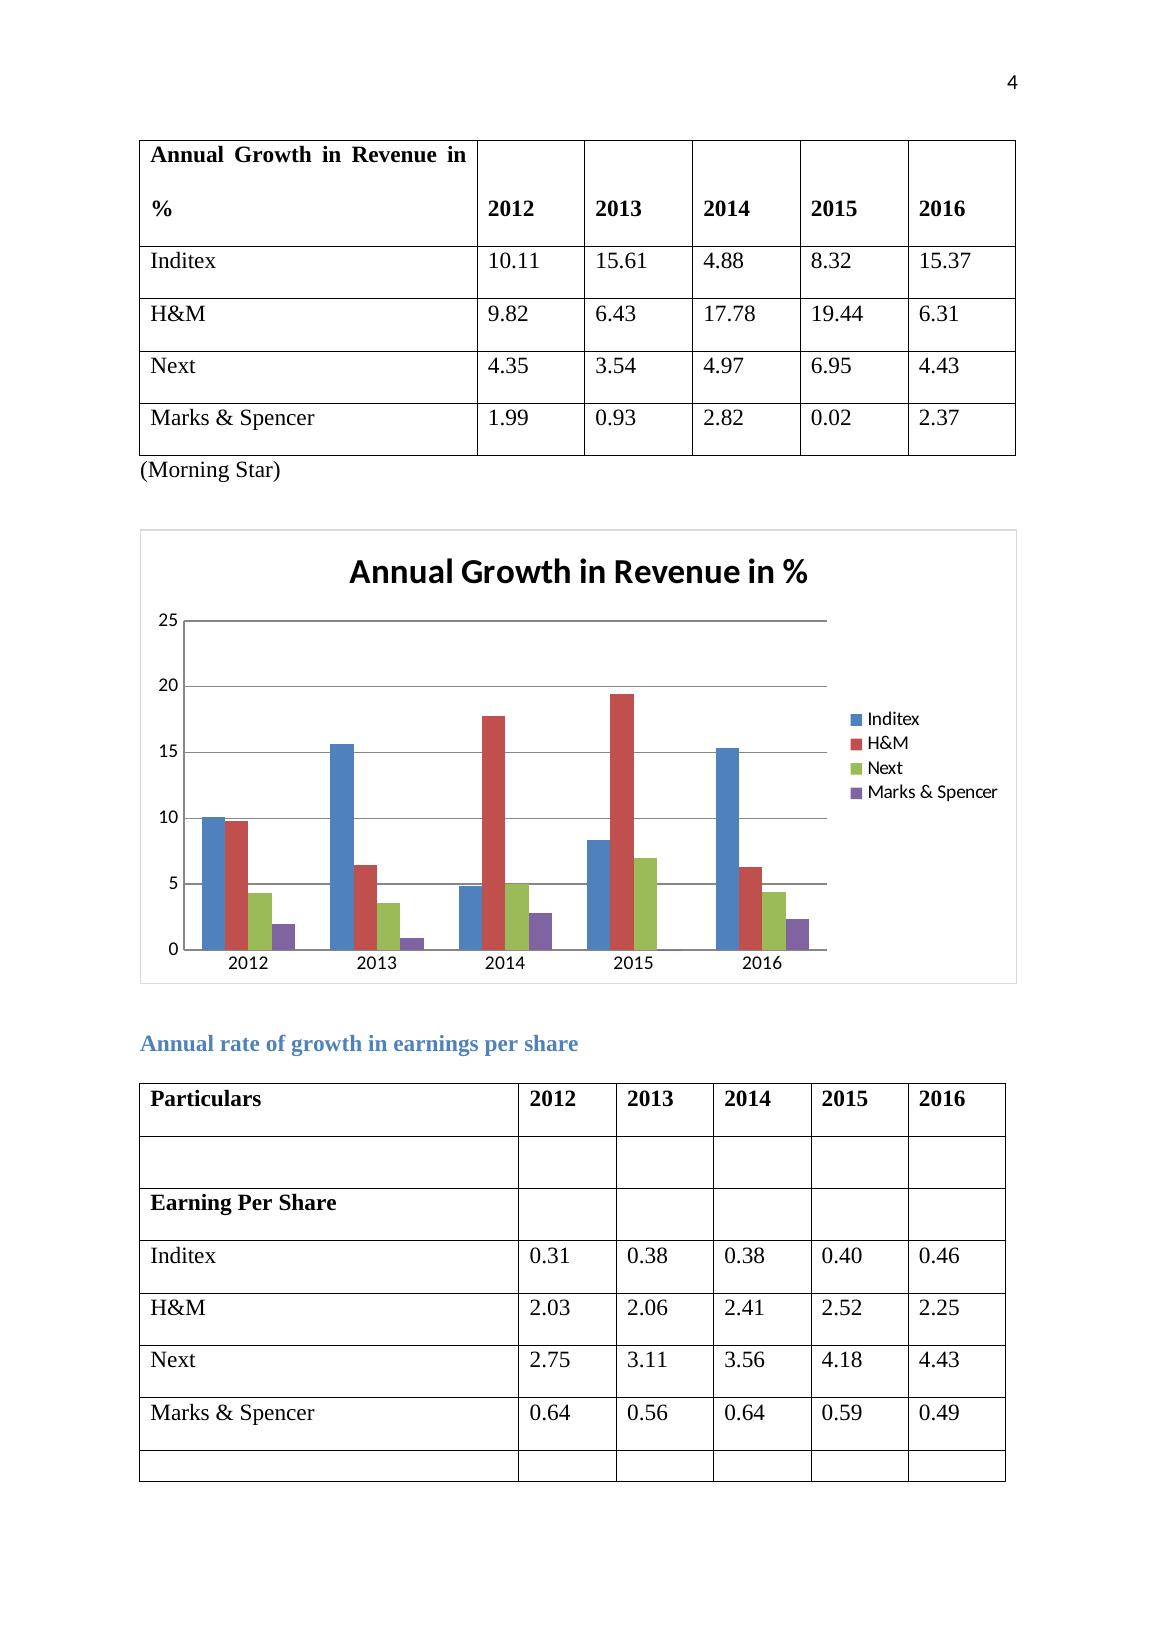
3IntroductionFinancial analysis is the most important aspect to measuring the financialperformance of the company and to compare with performance of other companies in sameindustry. There are many methods to evaluate the financial performance over the current yearand also with previous years. Among them ratio analysis is most widely used method tomeasure and compare the financial performance of the companies. In this financial report,performance of four retail clothing companies has been evaluated for years 2012 to 2016. Thefour companies selected for this purpose is Inditex, H&M, Next and Marks & Spencer.In order to make financial analysis, financial data for the above mentioned companies hasbeen extracted from various online sources and from their published annual reports. Financial Analysis of all the four companiesFinancial performance has been conducted through making detailed analysis of eachratio. Financial data and calculation made on it are present in the format of tables and graphs.Growth over the yearsAnnual rate of growth in revenueParticulars20122013201420152016RevenueInditex13,79315,94616,72418,11720,900H&M120,799128,562151,419180,861192,267Next3,4413,5633,7404,0004,176Marks & Spencer9,93410,02610,31010,31110,555Annual Growth in Revenue in%20122013201420152016Inditex10.1115.614.888.3215.37H&M9.826.4317.7819.446.31
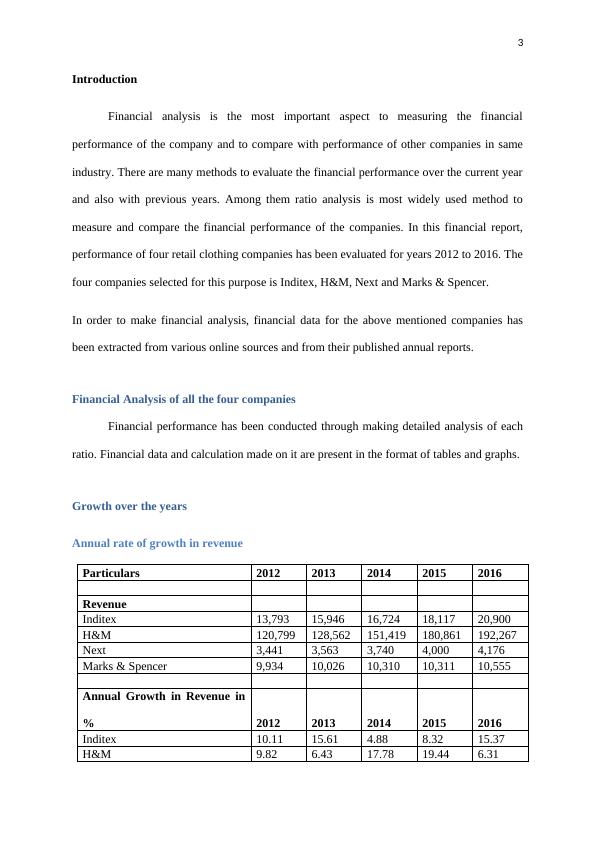
4Next4.353.544.976.954.43Marks & Spencer1.990.932.820.022.37(Morning Star)201220132014201520160510152025Annual Growth in Revenue in %Inditex H&MNext Marks & SpencerAnnual rate of growth in earnings per shareParticulars20122013201420152016Earning Per ShareInditex 0.310.380.380.400.46H&M2.032.062.412.522.25Next 2.753.113.564.184.43Marks & Spencer0.640.560.640.590.49Annual Growth in EPS in %20122013201420152016Inditex 11.5522.160.745.2414.94H&M6.61.6716.514.64-10.85Next 27.0713.314.0817.526.01Marks & Spencer-16.15-9.9411.03-8.39-15.93(Morning Star)
End of preview
Want to access all the pages? Upload your documents or become a member.