Financial Analysis Report: Reliance Worldwide Corporation Limited
VerifiedAdded on 2021/05/31
|25
|4658
|95
Report
AI Summary
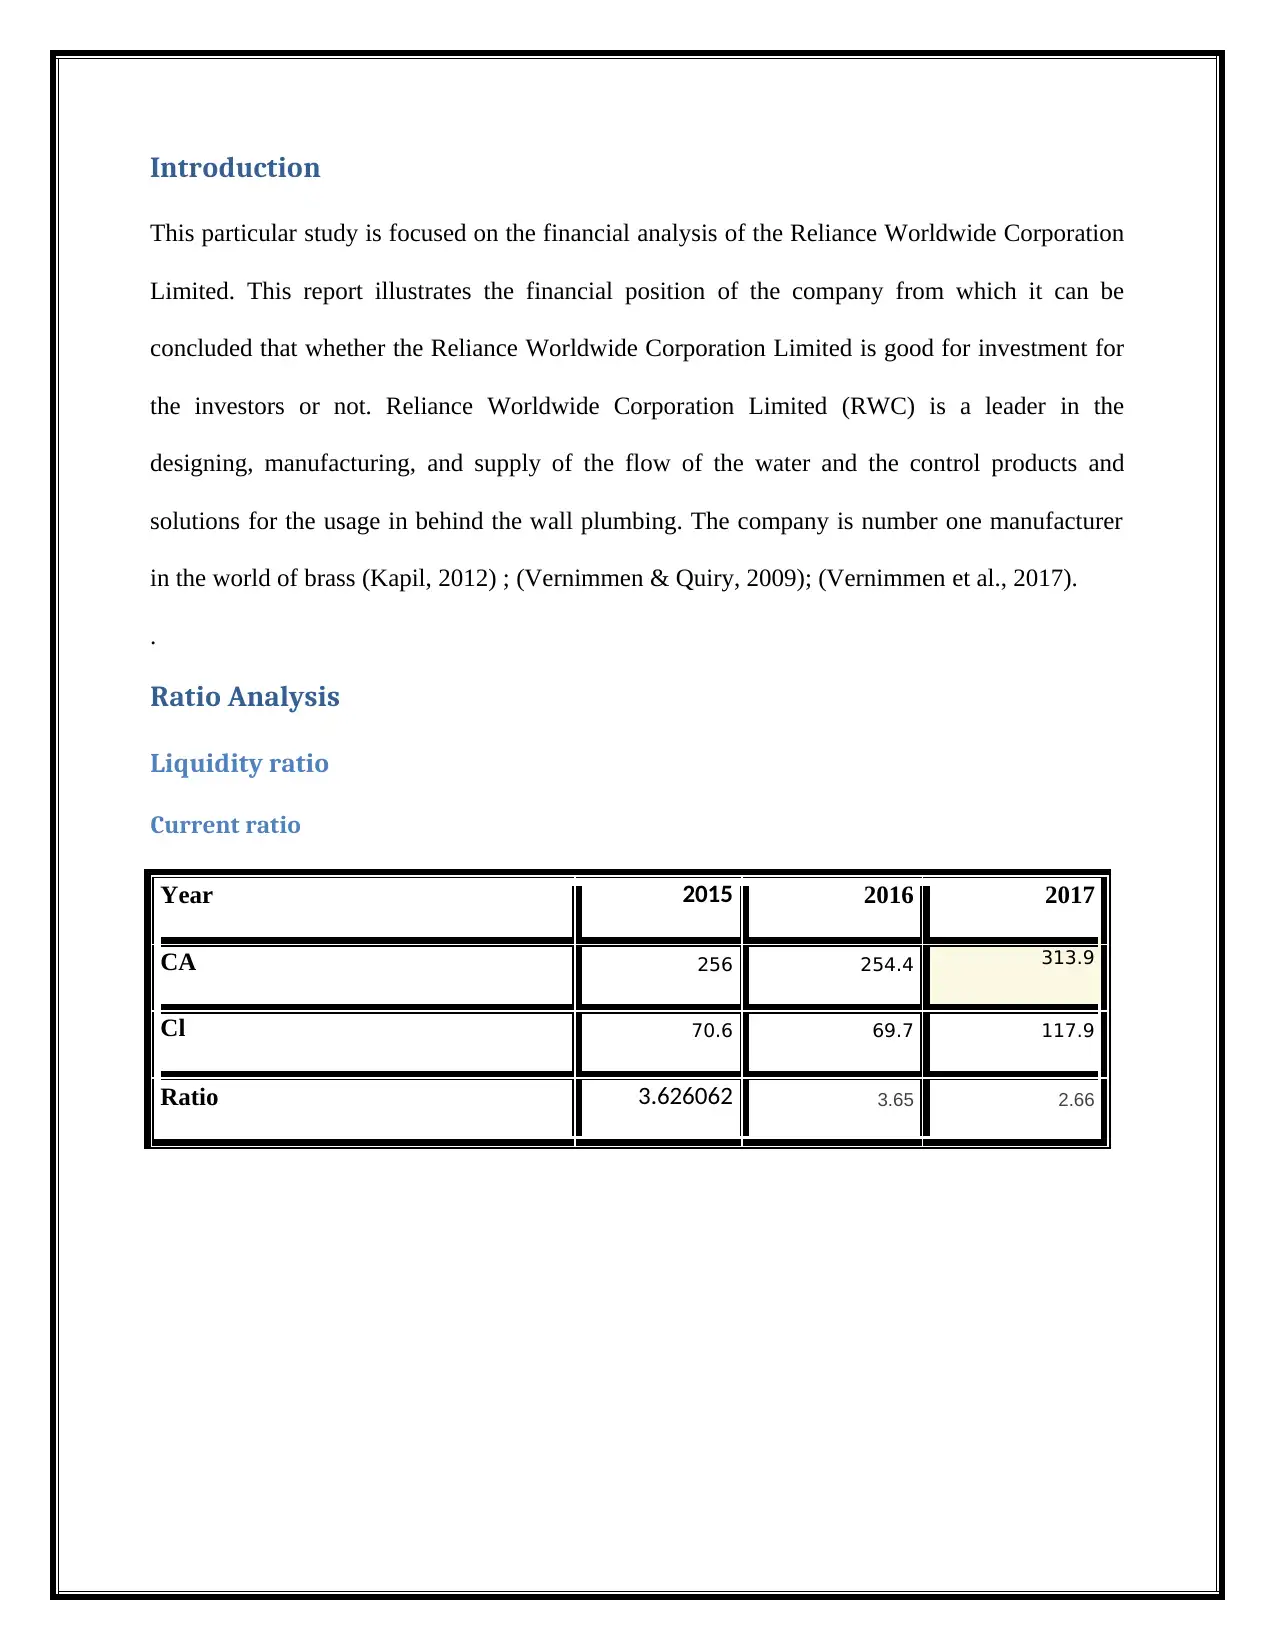
This report offers a detailed financial analysis of Reliance Worldwide Corporation Limited (RWC), evaluating its performance from 2015 to 2017. The analysis encompasses a range of financial ratios, including liquidity (current, quick, and working capital ratios), long-term solvency (debt-to-equity, debt-t...

Financial Analysis of Reliance
Worldwide Corporation
Limited
Worldwide Corporation
Limited
Paraphrase This Document
Need a fresh take? Get an instant paraphrase of this document with our AI Paraphraser

Table of Contents
Introduction......................................................................................................................................3
Ratio Analysis..................................................................................................................................3
Liquidity ratio..............................................................................................................................3
Current ratio.............................................................................................................................3
Quick Ratio...............................................................................................................................4
Working capital Ratio..............................................................................................................5
Gross profit percentage............................................................................................................6
Long-term Solvency ratios...........................................................................................................8
Debt to Equity Ratio.................................................................................................................8
Debt to total assets....................................................................................................................9
Cash Flow from operations to total liabilities........................................................................10
Profitability ratios......................................................................................................................11
Net Profit Margin Ratio..........................................................................................................11
Total Asset turnover...............................................................................................................12
Return on Asset (ROA)..........................................................................................................13
Return on Equity (RoE)..........................................................................................................14
Operating cash flow / total debt Ratio....................................................................................15
Risk faced by the company in the following years........................................................................16
Australian financial system............................................................................................................17
Horizontal Balance Sheet and Horizontal Income Statement....................................................17
Vertical balance Sheet and Vertical Income statement..............................................................18
Results............................................................................................................................................18

Conclusion.....................................................................................................................................21
References......................................................................................................................................23
You're viewing a preview
Unlock full access by subscribing today!

Introduction
This particular study is focused on the financial analysis of the Reliance Worldwide Corporation
Limited. This report illustrates the financial position of the company from which it can be
concluded that whether the Reliance Worldwide Corporation Limited is good for investment for
the investors or not. Reliance Worldwide Corporation Limited (RWC) is a leader in the
designing, manufacturing, and supply of the flow of the water and the control products and
solutions for the usage in behind the wall plumbing. The company is number one manufacturer
in the world of brass (Kapil, 2012) ; (Vernimmen & Quiry, 2009); (Vernimmen et al., 2017).
.
Ratio Analysis
Liquidity ratio
Current ratio
Year 2015 2016 2017
CA 256 254.4 313.9
Cl 70.6 69.7 117.9
Ratio 3.626062 3.65 2.66
Paraphrase This Document
Need a fresh take? Get an instant paraphrase of this document with our AI Paraphraser

2015 2016 2017
0
0.5
1
1.5
2
2.5
3
3.5
4
3.63 3.65
2.66
Current Ratio
Series1
Axis Title
Figure 1: Current Ratio
The chart above illustrates that the company’s current ratio is in safe margin zone in the years
2015, 2016 and 2017. The figures of the ratio show that the efficiency of the operations of the
company has decreased in the year 2017 from 3.65 to 2.66. The company is required to
undertake some serious effective measures for the purpose of enhancing liquidity in the company
(Watson & Head, 2016). The current ratio of the company has decreased in the current year in
comparison to the previous year which shows that the company’s current assets have decreased
in value in comparison to a previous year and it also shows that the company is moving towards
adverse effects. There is a need for the company to strengthen its financial position effectively
(Corelli, 2016; Tracy, 2012).
Quick Ratio
Year 2015 2016 2017
QA 120.3 135.3 151.5
Cl 70.6 69.7 117.9
Ratio 1.703966 1.94 1.28

2015 2016 2017
0
0.5
1
1.5
2
2.5
1.70
1.94
1.28
Quick Ratio
Series1
Figure 2: Quick ratio
The ideal ratio for the quick ratio maintenance of the company is the 1:1 ratio. This particular
ideal ratio reveals that the company basically relies on the inventory of the company or any other
assets of the company for the purpose of payment of short-term liabilities of the company. The
considerable point is that if the value of the ratio gets high with time, then it shows that the
company is not having any type of difficulty in borrowing the shorter term notes. The line chart
above shows that the company is revealing satisfactory performance in the terms of value in
respect of the quick ratio.
Working capital Ratio
Year 2015 2016 2017
CA 256 254.4 313.9
Cl 70.6 69.7 117.9
Ratio 3.626062 3.65 2.66
You're viewing a preview
Unlock full access by subscribing today!

2015 2016 2017
0
0.5
1
1.5
2
2.5
3
3.5
4
3.63 3.65
2.66
Working Capital Ratio
Series1
Figure 3: WC ratio
This ratio is also known amongst the financial analysts as the current ratio of the company. This
ratio helps in determining the liquidity of the organization for the purpose of payment of the
liabilities of the company in accordance with the current assets of the company. The working
capital ratio of the organization was 3.65 in 2016 and 2.66 in 2017. The ratio of the working
capital seems to be more than the ideal value of 1 in the previous years and so it can be
concluded that the debt of the organization is completely at a decreasing rate. Any type of
increase in the level of the debt is going to make the process of business risky towards the
potential credits (Hill & Cpa, 2011; Bragg, 2012).
Gross profit percentage
Year 2015 2016 2017
GP 176.25 38.88 252.22
Revenue 13.335 98.29 601.69
Paraphrase This Document
Need a fresh take? Get an instant paraphrase of this document with our AI Paraphraser

Ratio 13.2171 0.395564 0.41918596
2015 2016 2017
0
2
4
6
8
10
12
14 13.21709786276
72
0.395564146912
199 0.419185959547
275
GP Ratio
Series1
Figure 4: GP Ratio
The ratio of gross profit margin helps in analyzing the percentage of the money which is being
earned by the company with the help of sales. The higher the ratio of the gross margin gets in the
coming time, the more the figure of the profit, the company will be able to take away with it at
home. In the year 2015, the figure was high in comparison to 2016 and 2017 (Bragg, 2009).
The decrease in the ratios shows that the cost of goods sold of the company has been stable and
that is why there is not much change in the stability of the gross profit margin of the company in
the years 2016 and 2017 (Bragg, 2010).

Long-term Solvency ratios
Debt to Equity Ratio
Year 2015 2016 2017
total liabilities 163.5 256.09 395.04
shareholder's equity 269.45 166.99 204.75
Ratio 0.606792 1.533565 1.929377
2015 2016 2017
0
0.5
1
1.5
2
2.5
0.606791612544
074
1.533564884124
8
1.929377289377
29
Debt To Equity Ratio
Series1
Figure 5: debt to equity ratio
The ratio of the debt to equity helps the company in revealing the long-term solvency of the
company. The increase happening in the ratio of debt to equity reveals that the asset of the
company that is being offered by the shareholders are very less in value than the ones which are
being offered by the creditors of the company and because of such reason it is visible that there is
leverage condition in the company. Though in case Reliance Word Company, the figure of debt
You're viewing a preview
Unlock full access by subscribing today!

to equity is increasing which shows that the company is going through effective leverage
condition. The trend analysis reveals that the ratio has been increasing in the past years. The
shareholders of the company are not offering more value of the asset in comparison to creditors.
The debt to equity ratio reveals the company is facing tough time or going out of business and
how much assets the debtors could actually claim. In case of Reliance worldwide, the debt to
equity ratio for the year 2017 was 1.9 and this shows that the company's debt can create trouble
for the company in a downturn but still it is a manageable level. No matter how much high the
level of debt gets if the company is able to cover interest payment, it is considered to be
developing a good utilization of that excessive leverage. For keeping an eye on how it is doing
on that front, an investor can check how easily a company can service the debts (Greene, 2017).
Debt to total assets
Year 2015 2016 2017
Debt 25.23 163.57 270.37
Total Assets 432.95 423.07 599.79
ratio 0.058275 0.386626 0.450774
Paraphrase This Document
Need a fresh take? Get an instant paraphrase of this document with our AI Paraphraser

2015 2016 2017
0
0.05
0.1
0.15
0.2
0.25
0.3
0.35
0.4
0.45
0.5
0.058274627555
145
0.386626326612
618
0.450774437719
869
Debt to Total Assets Ratio
Series1
Figure 6: Debt to total assets
The ratio of debt to total assets helps in analyzing the association in between the debt of the
company and the assets of the company. There is an increase in the ratio level which illustrates
that the position of leverage of the company is very strong
Cash Flow from operations to total liabilities
Year 2015 2016 2017
Cash Flow from operations 54 26.16 71.92
Total Liability 395.04 256.09 395.04
Ratio 0.135682 0.102152 0.182058

2015 2016 2017
0
0.02
0.04
0.06
0.08
0.1
0.12
0.14
0.16
0.18
0.2
0.135682462535
44
0.102151587332
578
0.182057513163
224
Cash Flow from operations to total
liabilities
Series1
Figure 7: Cash Flow from operations to total liability ratio
The ratio of cash flow from operations of the company helps in determining the measurement of
the liquidity of the company. The chart above reveals that the company is being able to generate
enough cash to meet its short-term liabilities on time. The figures are positive in value and it
shows positive signs.
Profitability ratios
Net Profit Margin Ratio
Year 2015 2016 2017
Sales 451.73 98.29 601.69
Net profit 43.3 -1.6 65.61
Ratio 9.585372 -1.627836 10.9042863
You're viewing a preview
Unlock full access by subscribing today!

2015 2016 2017
-4
-2
0
2
4
6
8
10
12
9.585371792885
12
-
1.627835995523
45
10.90428626036
66
Net Profit Ratio
Series1
Figure 8: Net Profit Margin Ratio
The chart above shows that net profit margin was low in 2016 and thereafter it increased in 2017.
The reason behind this increase could be the low cost of production initiate day the company
after the loss in 2016. Reliance World Company will be able to make high net profit margin ratio
if they will focus on enhancing the sales figures.
Total Asset turnover
Year 2015 2016 2017
Sales 451.73 98.29 601.69
Total Assets 432.95 423.07 600
Ratio 1.043377 0.232326 1.00316778
Paraphrase This Document
Need a fresh take? Get an instant paraphrase of this document with our AI Paraphraser

2015 2016 2017
0
0.2
0.4
0.6
0.8
1
1.2
1.043376833352
58
0.232325619873
78
1.003167775388
05
Total Asset Turnover Ratio
Series1
Figure 9: Total Asset Turnover Ratio
The total asset turnover ratio of the company shows the conversion rate of the assets of the
company into cash form. The high ratio in 2017 and 2015 shows that the conversion rate of the
assets was high in these years. The low ratio in 2016 shows that the conversion was slow in
2016. The speed of conversion in 2017 was 1.00 in 2017 which was higher than that in 2016.
This increment reveals that the time taken by the company in converting the assets of the
company into cash has increased. Though the changes are not big still it shows a positive sign for
the company (Chandra, 2010; Periasamy, 2009).
.
Return on Asset (ROA)
Year 2015 2016 2017
Net Income 43.3 -1.6 65.61
Total Assets 432.95 423.07 600
Ratio 0.100012 -0.003782 0.10938829

2015 2016 2017
-0.02
0
0.02
0.04
0.06
0.08
0.1
0.12
0.100011548677
676
-
0.003781880067
12838
0.109388285900
065
Return on Assets Ratio
Series1
Figure 10: Return on Asset (ROA)
The ratio of the return on assets has increased in 2017 from -0.03 to 0.109. The ratio analysis
shows that the profitability of the company related to the total asset return is increasing and it is a
positive sign for the company as the company is having high value in 2017. However, on the
other side, it shows negative sign in 2016. This negative figure shows that the company was not
able to convert the amount invested in assets into cash form. Return on assets has increase din
2017 which reveals that the profitability of the company is increasing
Return on Equity (RoE)
Year 2015 2016 2017
Net Income 43.3 -1.6 65.61
shareholder's equity 269.45 166.99 204.75
Ratio 0.160698 -0.009581 0.32044
You're viewing a preview
Unlock full access by subscribing today!

2015 2016 2017
-0.05
0
0.05
0.1
0.15
0.2
0.25
0.3
0.35
0.160697717572
834
-
0.009581412060
60244
0.320439560439
561
Return on Equity Ratio
Series1
Figure 11: Return on Equity Ratio
The line chart above shows that the ratio of return on equity has increased in value in 2017 in
comparison to 2016. This development is going to help the company in coming a time in the
development of the trust of the shareholders of the company. This particular decrease in the ratio
shows that the profit in respect of the shareholders is increasing and this could be favorable for
the company as it will be able to maintain the trust of the shareholders of the company.
In this case, we have analyzed the profits of the company in respect of the equity of the
shareholders. The ratio chart shows that the figure of the ratio in 2017 was 0.32 which is higher
in value in comparison to the figure of 2016 which means that the company has been successful
in earning compatible profits in the current year in comparison to the profits of the previous year
Operating cash flow / total debt Ratio
2015 2016 2017
Operating cash flow 54 26.16 71.92
Total Debt 25.23 163.57 270.37
Paraphrase This Document
Need a fresh take? Get an instant paraphrase of this document with our AI Paraphraser

Operating cash flow / total debt 2.124455 0.15993153 0.26600584
2015 2016 2017
0
0.5
1
1.5
2
2.5
Operating cash flow / total debt
Series1
Axis Title
Figure 12: Operating Cash Flow/ Total Debt Ratio
The line chart above shows that the ratio of operating cash flow upon total debt has increased in
2017 but this increase was not that good as that in the year 2015. The figures of the ratio show
that the company is being able to generate cash in 2017 in comparison to 2016 (Pandey, 2015;
Sharma, 2016).
Risk faced by the company in the following years
Reliance Company is exposed to varied changes in economic conditions, legislation, and
regulations that might impact the activities in end markets.
The financial performance of the company is dependent on the activities in the residential
and commercial repairing and renovation. Activities in such markets are impacted by the
changes happening in economic conditions and towards legislation and regulation. A

prolonged downturn in the economic conditions impacts the demand for the services in
the residential and commercial repair and thereby decreasing demand of company.
The results of reliance are also impacted by the exchange rate movements. As the
company is expanding globally, it is getting exposed to additional currencies and a high
proportion of the net sales and cash flows (RWC, 2017; Brigham & Houston, 2015).
Australian financial system
The financial statements of the company are prepared using the consistent accenting policies.
In preparation of financial statements of the entities of the company, transactions in currencies
other than the company’s functional currency are recognized at the exchange rate at the date of
the transaction. The preparation of the consolidated financial statements are in conformance with
the Australian Accounting Standards and it needs management to make some judgments,
estimations, and assumption which might affect the applications of the policies and amounts of
assets and liabilities. There are many issues that come announced, for example, a hurricane or
labor strike. So a company needs to maintain enough liquidity for meeting the short-term
obligations for survival. Reliance worldwide is able to meet the short-term commitments with its
holdings of cash and assets (investing, 2018).
Horizontal Balance Sheet and Horizontal Income Statement
The horizontal analysis of the company is considered as the trend analysis of the company as it
helps in determining the trends in the financial data of the company. The analysis stresses on the
trends in the earning and assets of the company. Information in respect o the trend is helpful in
analyzing the areas of wide divergence. The table in the appendix reveals that the there was 42
percent increase in the total assets of the company. The value of the assets was 423 in 2016 and it
You're viewing a preview
Unlock full access by subscribing today!

reached to 599 in 2017. As far as liabilities of the company are concerned, the total liabilities of
the company increased to 54% in 2017which is not a good sign for the company as it reveals that
the company is having much liability to pay for. The cash and the bank balances of the company
reduced by 2 % in the year 2017. The figures of cash reveal that the company is losing hard cash
values from their hands and this might be because of fewer earnings in the current year.
Vertical balance Sheet and Vertical Income statement
The vertical balance sheet and income statement analysis are considered as the comparison of the
various types of line items with the single periods. It basically compares the items of line with
the total and thereafter it calculates what percentage the line item is of the total amount. In the
year 2017 and 2016, current assets were 52% of total assets. The figure is very low and this
shows that most of the assets of the company are not much in liquid form and it might take some
time in either investing the money or utilizing it for purchasing the additional plant assets. The
assets values are decreasing and because of that, the company is not able to expand its operations
in a good manner. With the decrease in the cost of goods, the quality has suffered.
Results
The financial performance of Reliance worldwide company is satisfactory however there are
some ratios that shows that the company is in need of undertaking some sort of actions against
the policies that will help in earning effective profit level. There s high-level requirement of
enhancing the asset conversion rate of the company. The ratio analysis has helped in determining
that the company is showing good signs of better performances. Net profit and gross profit
margin of the company has enhanced and even the financial position of the company has also
improved in the year 2017. However, the noticeable point is that the increase in the ratios is not
Paraphrase This Document
Need a fresh take? Get an instant paraphrase of this document with our AI Paraphraser

that high that it can be considered as substantial for the company. There is room for
improvement in the financial position of the company. (Lasher, 2013)
Finance alternatives for managing long term and short debts
Company is currently having less financial risk than the sector average and the financial risk
would decline even further is equity finance was used. If debt finance will be used then the
financial risk world initially rise slightly above the sector average but would return soon to the
sector average level.
Long Term Debt: Considering the case of Reliance Company long term debt financing is
suggested to purchase major assets like buildings and equipments. Long term debt which are
secured by assets are having low cost of borrowing. This is especially true when the bank,
maintains low borrowing rates for supporting the business growth. An additional benefit with
relatively low financing cost, is that the interest payment on assets acquired for the business are
generally tax deductible. Compared to the alternative of short term debt with suppliers and equity
investments, long term debt is structured and stable. Company can opt for equity financing, old
finance or bank finance.
Short Term Debt; Short term debt is utilized for funding short term financial commitments, like
payroll, recurring expenses and much more. Though the firm have some short term debt, cash
flow issues should not be taken lightly. Poor cash flow management is detrimental to business.
The goal need not to be to eliminate the short term debt but to manage it. Company need to re
examine the credit terms offered by suppliers. Generally for such big companies it is advisable to
operating line of credit. This can be accessed at any point of time, usually with low cost, should
company find short of funds. It lets the company extend cash resources when need. Another
option is to use the business credit card for small purchase, like office supplies. Advisors advises

that company should pay down the credit card balances in full every month for avoiding
additional interest charges (Royal Bank of Canada, 2010).
Derivatives as funding source
As the volatility in equity markets in this particular year demonstrate, the world continues to be
risky place. Faster moving changes in the foreign exchange have impacts on stock markets and
confidence of business. Such developments has enhanced the continuing need for financial tool
of derivative funding which can mitigate an escalation of the uncertainty which ca freeze
investments and hiring plans. Reliance company need to use derivative as funding source as it
involves three purpose: risk management, price discovery and reduction of transaction cost.
Derivatives can help in management of risk from cash flow volatility arising from the adverse
changes in the market rates, exchange rates and commodity prices, as the company is working at
global platform (DeVol, 2016). The tax codes also offers incentives for the purpose of hedging
the cash flow volatility and income. Hedging strategy involves derivatives which can alleviate
under investments created by insufficient cash flow and risk aversions. At present hedging and
speculation strategies along with the derivatives, are useful tools and techniques which will
enable the company to more effectively manage the risk.
Funding policy available
Capital is usually the single great barrier to an entrepreneur for starting business. Even the
companies like Reliance worldwide are requiring significant amount of capital for covering the
major expenses like rent and labor. The main alternative solution available for the company is to
use the insurance as the seed funding (Keng, 2016).
You're viewing a preview
Unlock full access by subscribing today!

Thee benefit of insurance loan for entrepreneurs are: no credit or background checks that might
affect the credit history, flexible payment schedules because one is not required to make monthly
repayments and lower rate of interest.
There are many methodologies that company may consider to value the shares of company.
Though different values are arrived under all the varied methods, it is important for a value to
arrive at fair value. In practice, the valuer normally, utilizes methodologies of valuation and
arrives at fair value. In practice, the company need to use several methodologies of valuation and
arrive at fair price for entire business. The selection of method depend son purpose of valuation.
In case valuation is for the purpose of liquidation, the business would want to use the realizable
value of the net asset of the company and not the earning capacity. Company can use net asset
value method for valuation purpose. The method represents the value of the business with
reference to the asset base of the company and the liabilities attached on the valuation date (Bcas
Online, 2018). This method is advisable as it is easy to calculate, readily available and offers
minimum value of the company.
Conclusion
It is visible that the conversion rate of the assets is not that adequate but still it is a good
company than most of the competitive companies in the same sector. The stocks of the company
are also doing well in the market. The company is currently surrounded by a higher level of
expectations and this basically calls for higher level of additional risk factor. The ratio analysis
of the company reveals that the organization has successfully decreased the level of the funds
with the help of debts. The company is having a good amount of liquidity for the purpose of
meeting out the liability level. The level of profit margin has enhanced in the past years
Paraphrase This Document
Need a fresh take? Get an instant paraphrase of this document with our AI Paraphraser

adequately. As the company has been successful in decreasing the level of funds with the help of
debts, so there is a requirement for enhancing the leverage position of the company. The profit
margin of the company has been increasing but the rate of conversion of the assets is decreasing.
This might have possibly taken place because of inefficient operations of the company. The
company is currently in good form from the view of investment as it has liquidity in debt
repayment and it also the capability of improvement.
It is expected that the margins of the company will expand in coming years, with an expectation
of 10 percent at least in annual revenue growth and the net income. This shows that future
earnings growth of the company is basically driven by the enhanced cost efficiency and along
with that side revenue level also increases, which will enlarge the incremental amount of the net
income which is retained from the figure of forecasted revenue growth of the company.
Despite all this, the investors of the company need to realize that the expected margin has varied
impacts on the profits and returns which depends on the underlying situations, which basically
helps in the reinforcement of the importance of the deep research level. It is quite useful to
determine and judge the profit margin of the company and its implication associated with the
return in comparison to the other companies that are having similar trait levels. In case of
Reliance worldwide the future margin of profit is expected to expand along with the
development of industry margins (Bragg, 2010). This turns up as an indication of the confidence
amongst the research analysts which covers the tocks that the nature of the Reliance worldwide
earnings will be resulting in high level of return per dollar of equity in comparison to the
industry.
However, the margins use the items on the income statement that are prone to be manipulated by
varied measures of accounting that can distort the analysis. Thus it is important to run the

analysis on the future earning of reliance Worldwide while maintaining the watchful eye over the
sustainability of the methods of cost management and the runaway for the top line growth level.
References
Bcas Online, 2018. Valuation Methodologies. [Online] Available at:
https://www.bcasonline.org/Referencer2015-16/Accounting%20&%20Auditing/
valuation_methodologies_an_overview.html [Accessed 10 May 2018].
Bragg, S.M., 2009. Accounting Control Best Practices. John Wiley & Sons.
Bragg, S.M., 2010. Accounting Best Practices. John Wiley & Sons.
Bragg, S.M., 2010. Business Ratios and Formulas: A Comprehensive Guide. John Wiley & Sons.
Bragg, S.M., 2012. Business Ratios and Formulas: A Comprehensive Guide. Wiley.
Brigham, E.F. & Houston, J.F., 2015. Fundamentals of Financial Management. Cengage
Learning.
Chandra, P., 2010. Financial Management. Tata McGraw-Hill Education.
Corelli, A., 2016. Analytical Corporate Finance. Springer.
DeVol, R., 2016. Derivatives: Good for Risk Mitigation and Growth. [Online] Available at:
https://www.huffingtonpost.com/ross-devol/derivatives-good-for-risk_b_9778838.html.
Greene, C., 2017. Is Reliance Worldwide Corporation Limited (ASX:RWC) A Financially Sound
Company? [Online] Available at: https://simplywall.st/news/is-reliance-worldwide-corporation-
limited-asxrwc-a-financially-sound-company/.
Hill, G. & Cpa, G.H., 2011. What You Really Need to Know about Accounting. Not for
Accountants.
investing, 2018. Reliance Worldwide Corporation (Aust) Pty Ltd (RWC). [Online] Available at:
https://www.investing.com/equities/reliance-worldwide-corporation-income-statement.
Kapil, S., 2012. Financial Management. Pearson Education India.
Keng, C., 2016. Entrepreneurs Funding Businesses With Their Insurance Policies & Avoiding
Taxes. [Online] Available at:
https://www.forbes.com/sites/cameronkeng/2016/03/17/entrepreneurs-funding-businesses-with-
their-insurance-policies-avoiding-taxes/#2c24c0f32f65 [Accessed 12 May 2018].
You're viewing a preview
Unlock full access by subscribing today!

Lasher, W.R., 2013. Practical Financial Management. Cengage Learning.
Pandey, I.M., 2015. Financial Management. Vikas Pulishing.
Periasamy, 2009. Financial Management, 2E. Tata McGraw-Hill Education.
Royal Bank of Canada, 2010. Understanding and managing short- and long-term debt. [Online]
Available at: http://www.rbcroyalbank.com/commercial/expert-advice/_assets-custom/pdf/
managing-debt-e.pdf [Accessed 13 May 2018].
RWC, 2017. Annual Report Reliance Worldwide Corporation Limited . [Online] Available at:
http://www.rwc.com/wp-content/uploads/2017/08/Appendix-4E-with-Financial-Report-1.pdf.
Sharma, D.F.C., 2016. Financial Management: Latest EditionFinancial Management: Latest
Edition. SBPD Publications.
Tracy, A., 2012. Ratio Analysis Fundamentals. John Wiley & Sons.
Vernimmen, P. & Quiry, P., 2009. Corporate Finance: Theory and Practice. John Wiley &
Sons.
Vernimmen, P. et al., 2017. Corporate Finance: Theory and Practice. John Wiley & Sons.
Watson, D. & Head, A., 2016. Corporate Finance: Principles and Practice. Pearson Education
Limited.
1 out of 25
Related Documents

Your All-in-One AI-Powered Toolkit for Academic Success.
+13062052269
info@desklib.com
Available 24*7 on WhatsApp / Email
Unlock your academic potential
© 2024 | Zucol Services PVT LTD | All rights reserved.