Comprehensive Financial Analysis of Apple and Samsung (2014-2017)
VerifiedAdded on 2020/10/23
|22
|4606
|499
Report
AI Summary
This report presents a financial analysis of Apple Inc. and Samsung, examining their performance from 2014 to 2017. It begins with an introduction to financial analysis, its importance, and the scope of the report. The core of the report includes a comparative analysis of the two companies using profitability, liquidity, solvency, efficiency, and investment ratios. It also covers horizontal and vertical analyses of their income statements and balance sheets. The report further addresses corporate social responsibility activities undertaken by both companies. The analysis is supported by data from financial statements and includes interpretations of key financial metrics, offering insights into each company's financial health and performance trends. References and appendices with supporting data are also included.

FAME
Paraphrase This Document
Need a fresh take? Get an instant paraphrase of this document with our AI Paraphraser
TABLE OF CONTENTS
INTRODUCTION...........................................................................................................................1
TASK 1...................................................................................................................................2
Financial Analysis of Samsung and Apple.............................................................................2
Horizontal analysis of Income statement and Balance sheet of Apple and Samsung............8
Horizontal analysis of income statement of Apple.................................................................8
Horizontal analysis of balance sheet of Apple.......................................................................8
Horizontal analysis of income statement of Samsung............................................................8
Horizontal analysis of balance sheet of Samsung..................................................................8
Vertical analysis of Income statement and Balance sheet of Apple and Samsung................9
Vertical analysis on income statement of Apple....................................................................9
Vertical analysis on balance sheet of Apple...........................................................................9
Vertical analysis on income statement of Samsung...............................................................9
Vertical analysis on balance sheet of Samsung......................................................................9
TASK 2..........................................................................................................................................10
Corporate Social Responsibility...........................................................................................10
REFERENCES..............................................................................................................................14
APPENDIX....................................................................................................................................16
Horizontal analysis of income statement of Apple...............................................................16
Horizontal analysis of balance sheet of Apple.....................................................................16
Horizontal analysis of income statement of Samsung..........................................................17
Horizontal analysis of balance sheet of Samsung................................................................18
Vertical analysis on income statement of Apple..................................................................18
Vertical analysis on balance sheet of Apple.........................................................................19
Vertical analysis on income statement of Samsung.............................................................20
Vertical analysis on balance sheet of Samsung....................................................................20
INTRODUCTION
Financial Analysis is used for improving the profit levels, cash flow of a business
organisation by analysing whether the business, projects or sub - business is stable, solvent,
liquid or profitable and also helpful in achieving the business objectives with the available
resources with the relevant financial information of the business organisation. The report has
included the financial analysis of Samsung and Apple Inc. companies from the year 2014 - 2017.
The report has discussed the financial position of Samsung and Apple Inc. companies with the
help of income statement and balance sheet. The report has also included the corporate social
responsibility topic. Furthermore, the report has defined the activities related to corporate social
responsibility conducted by Samsung and Apple Inc. companies in different different areas
(Williams, E.E. and Dobelman, J.A., 2017).
⊘ This is a preview!⊘
Do you want full access?
Subscribe today to unlock all pages.
Trusted by 1+ million students worldwide
TASK 1
Financial Analysis of Samsung and Apple.
Financial Analysis is defined as the process of assessing and evaluating the suitability,
profitability, viability, solvency and stability of the business performance, projects and finance-
related business entities. It is used in improving profit levels, cash flow of a business
organisation by analysing whether it is stable, solvent, liquid or profitable helpful in achieving
the business objectives with the available resources with the relevant financial information
(Williams, E.E. and Dobelman, J.A., 2017).
Profitability ratio analysis
Company's profitability depicts financial performance of the company. It represents how
profitable the fund of owner has been used in the company (Sayed, S.S.M. and Sawant, P.H.,
2015). Profitability ratio used by company to evaluate ability of company to generate income as
compared to cost and expenses associated during a particular period. The profitability ratio
includes -
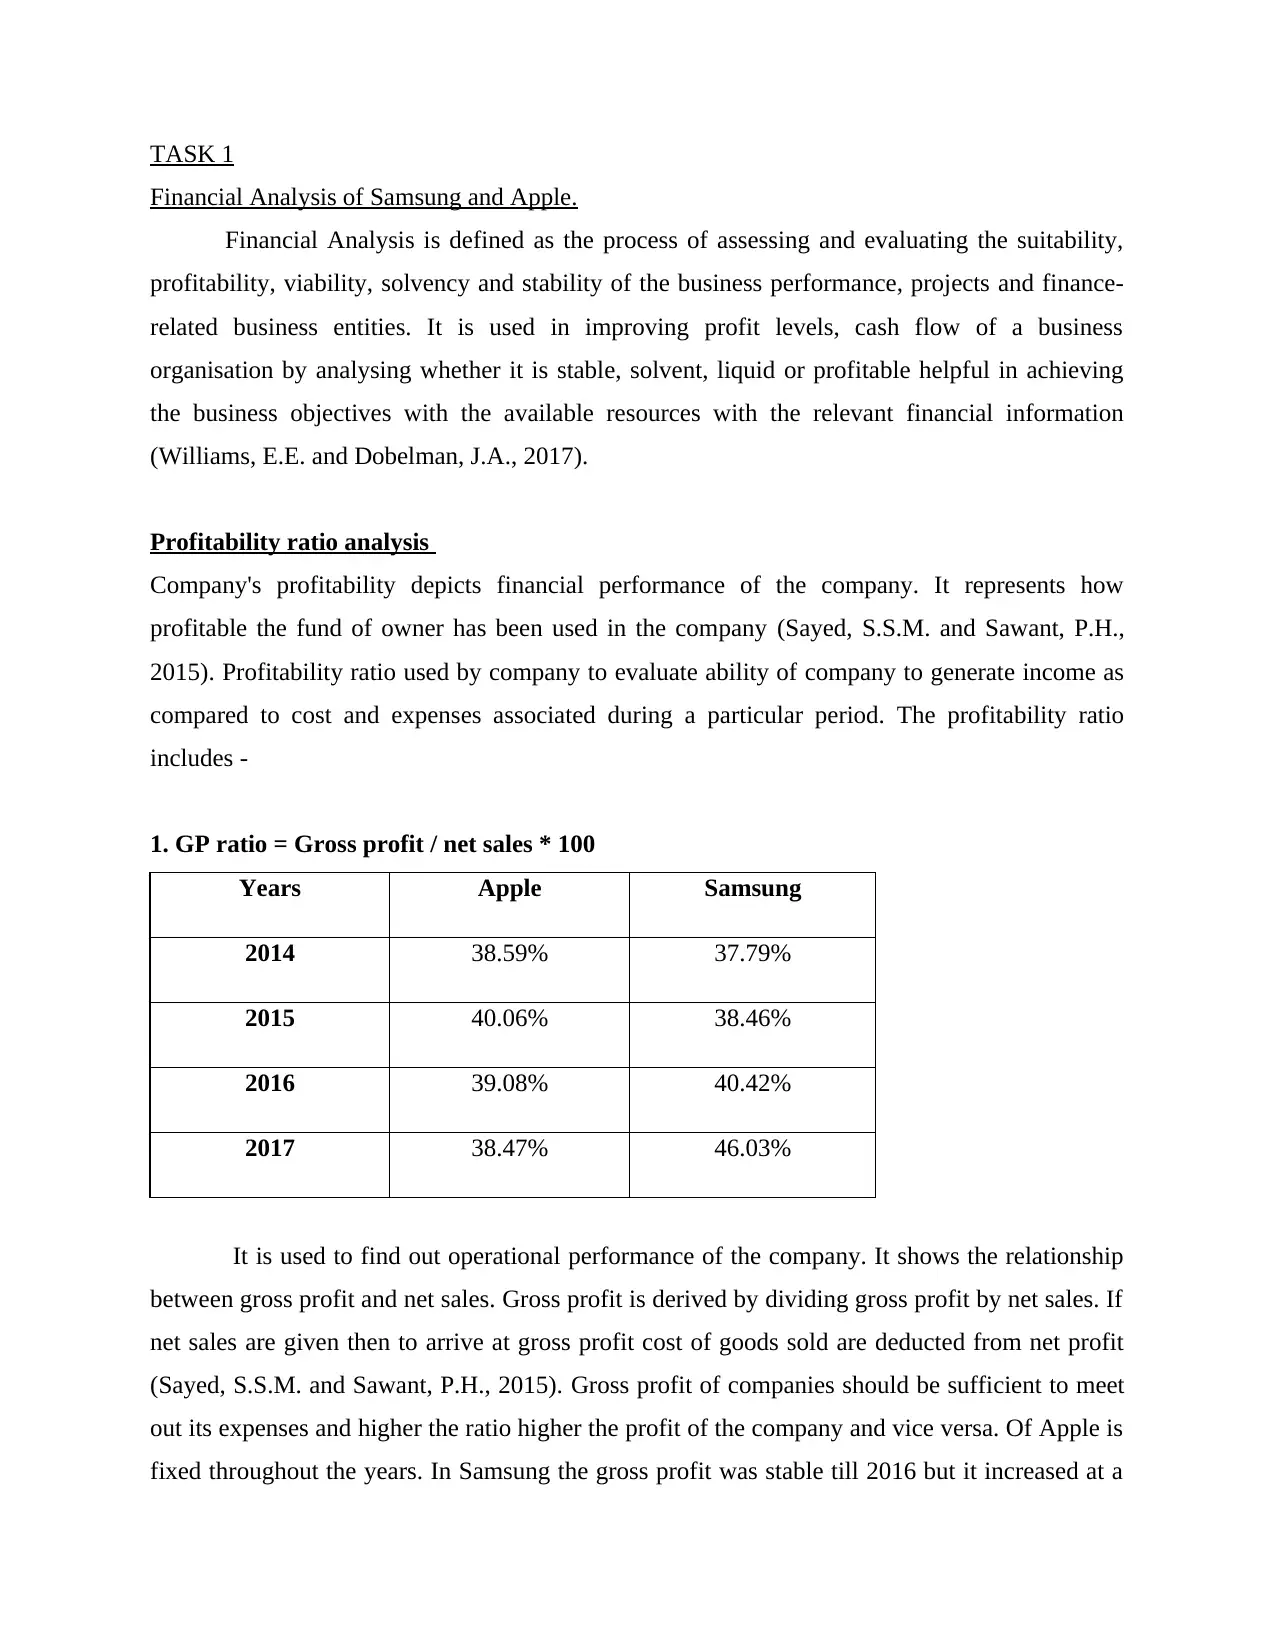
1. GP ratio = Gross profit / net sales * 100
Years Apple Samsung
2014 38.59% 37.79%
2015 40.06% 38.46%
2016 39.08% 40.42%
2017 38.47% 46.03%
It is used to find out operational performance of the company. It shows the relationship
between gross profit and net sales. Gross profit is derived by dividing gross profit by net sales. If
net sales are given then to arrive at gross profit cost of goods sold are deducted from net profit
(Sayed, S.S.M. and Sawant, P.H., 2015). Gross profit of companies should be sufficient to meet
out its expenses and higher the ratio higher the profit of the company and vice versa. Of Apple is
fixed throughout the years. In Samsung the gross profit was stable till 2016 but it increased at a
Financial Analysis of Samsung and Apple.
Financial Analysis is defined as the process of assessing and evaluating the suitability,
profitability, viability, solvency and stability of the business performance, projects and finance-
related business entities. It is used in improving profit levels, cash flow of a business
organisation by analysing whether it is stable, solvent, liquid or profitable helpful in achieving
the business objectives with the available resources with the relevant financial information
(Williams, E.E. and Dobelman, J.A., 2017).
Profitability ratio analysis
Company's profitability depicts financial performance of the company. It represents how
profitable the fund of owner has been used in the company (Sayed, S.S.M. and Sawant, P.H.,
2015). Profitability ratio used by company to evaluate ability of company to generate income as
compared to cost and expenses associated during a particular period. The profitability ratio
includes -
1. GP ratio = Gross profit / net sales * 100
Years Apple Samsung
2014 38.59% 37.79%
2015 40.06% 38.46%
2016 39.08% 40.42%
2017 38.47% 46.03%
It is used to find out operational performance of the company. It shows the relationship
between gross profit and net sales. Gross profit is derived by dividing gross profit by net sales. If
net sales are given then to arrive at gross profit cost of goods sold are deducted from net profit
(Sayed, S.S.M. and Sawant, P.H., 2015). Gross profit of companies should be sufficient to meet
out its expenses and higher the ratio higher the profit of the company and vice versa. Of Apple is
fixed throughout the years. In Samsung the gross profit was stable till 2016 but it increased at a
Paraphrase This Document
Need a fresh take? Get an instant paraphrase of this document with our AI Paraphraser
high speed in 2017 because Samsung launched products with new technologies and has
expanded its operations in the market which lead to high customer base and increase in gross
profit.
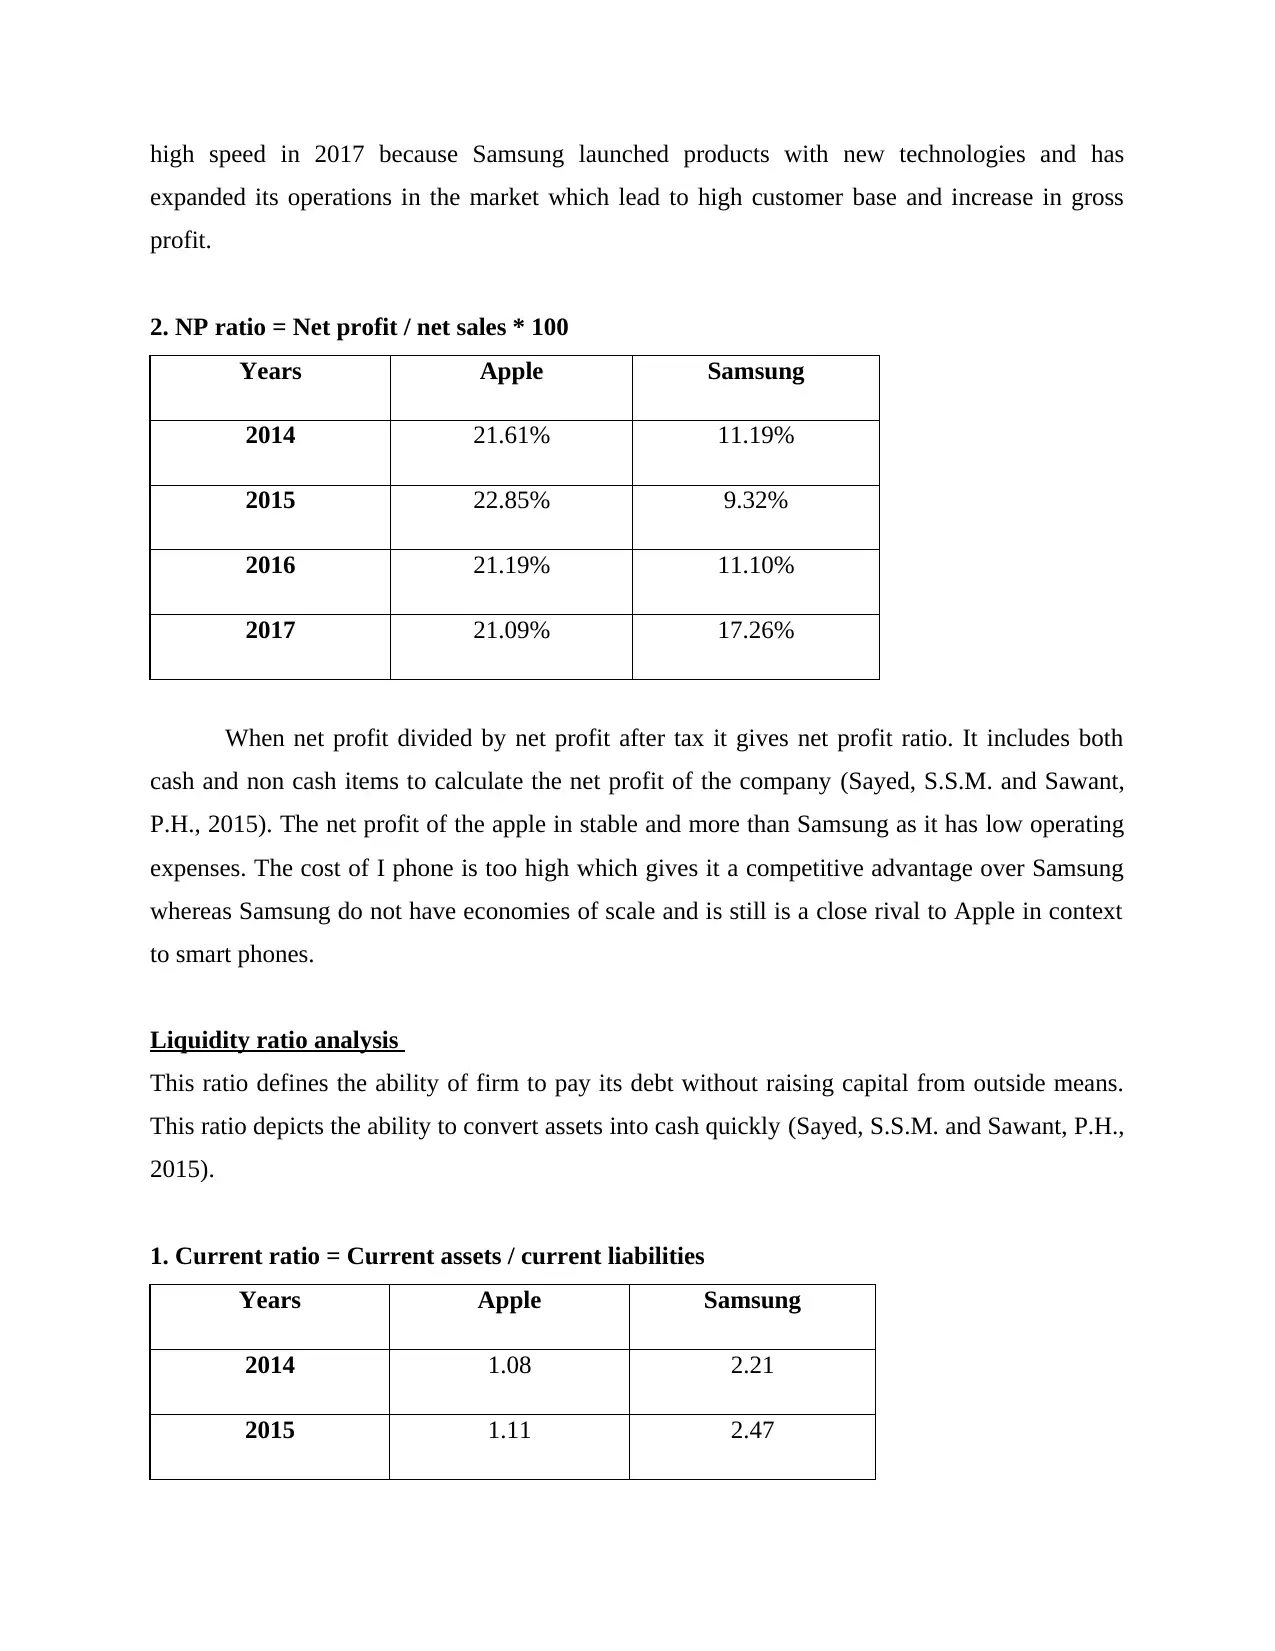
2. NP ratio = Net profit / net sales * 100
Years Apple Samsung
2014 21.61% 11.19%
2015 22.85% 9.32%
2016 21.19% 11.10%
2017 21.09% 17.26%
When net profit divided by net profit after tax it gives net profit ratio. It includes both
cash and non cash items to calculate the net profit of the company (Sayed, S.S.M. and Sawant,
P.H., 2015). The net profit of the apple in stable and more than Samsung as it has low operating
expenses. The cost of I phone is too high which gives it a competitive advantage over Samsung
whereas Samsung do not have economies of scale and is still is a close rival to Apple in context
to smart phones.
Liquidity ratio analysis
This ratio defines the ability of firm to pay its debt without raising capital from outside means.
This ratio depicts the ability to convert assets into cash quickly (Sayed, S.S.M. and Sawant, P.H.,
2015).
1. Current ratio = Current assets / current liabilities
Years Apple Samsung
2014 1.08 2.21
2015 1.11 2.47
expanded its operations in the market which lead to high customer base and increase in gross
profit.
2. NP ratio = Net profit / net sales * 100
Years Apple Samsung
2014 21.61% 11.19%
2015 22.85% 9.32%
2016 21.19% 11.10%
2017 21.09% 17.26%
When net profit divided by net profit after tax it gives net profit ratio. It includes both
cash and non cash items to calculate the net profit of the company (Sayed, S.S.M. and Sawant,
P.H., 2015). The net profit of the apple in stable and more than Samsung as it has low operating
expenses. The cost of I phone is too high which gives it a competitive advantage over Samsung
whereas Samsung do not have economies of scale and is still is a close rival to Apple in context
to smart phones.
Liquidity ratio analysis
This ratio defines the ability of firm to pay its debt without raising capital from outside means.
This ratio depicts the ability to convert assets into cash quickly (Sayed, S.S.M. and Sawant, P.H.,
2015).
1. Current ratio = Current assets / current liabilities
Years Apple Samsung
2014 1.08 2.21
2015 1.11 2.47
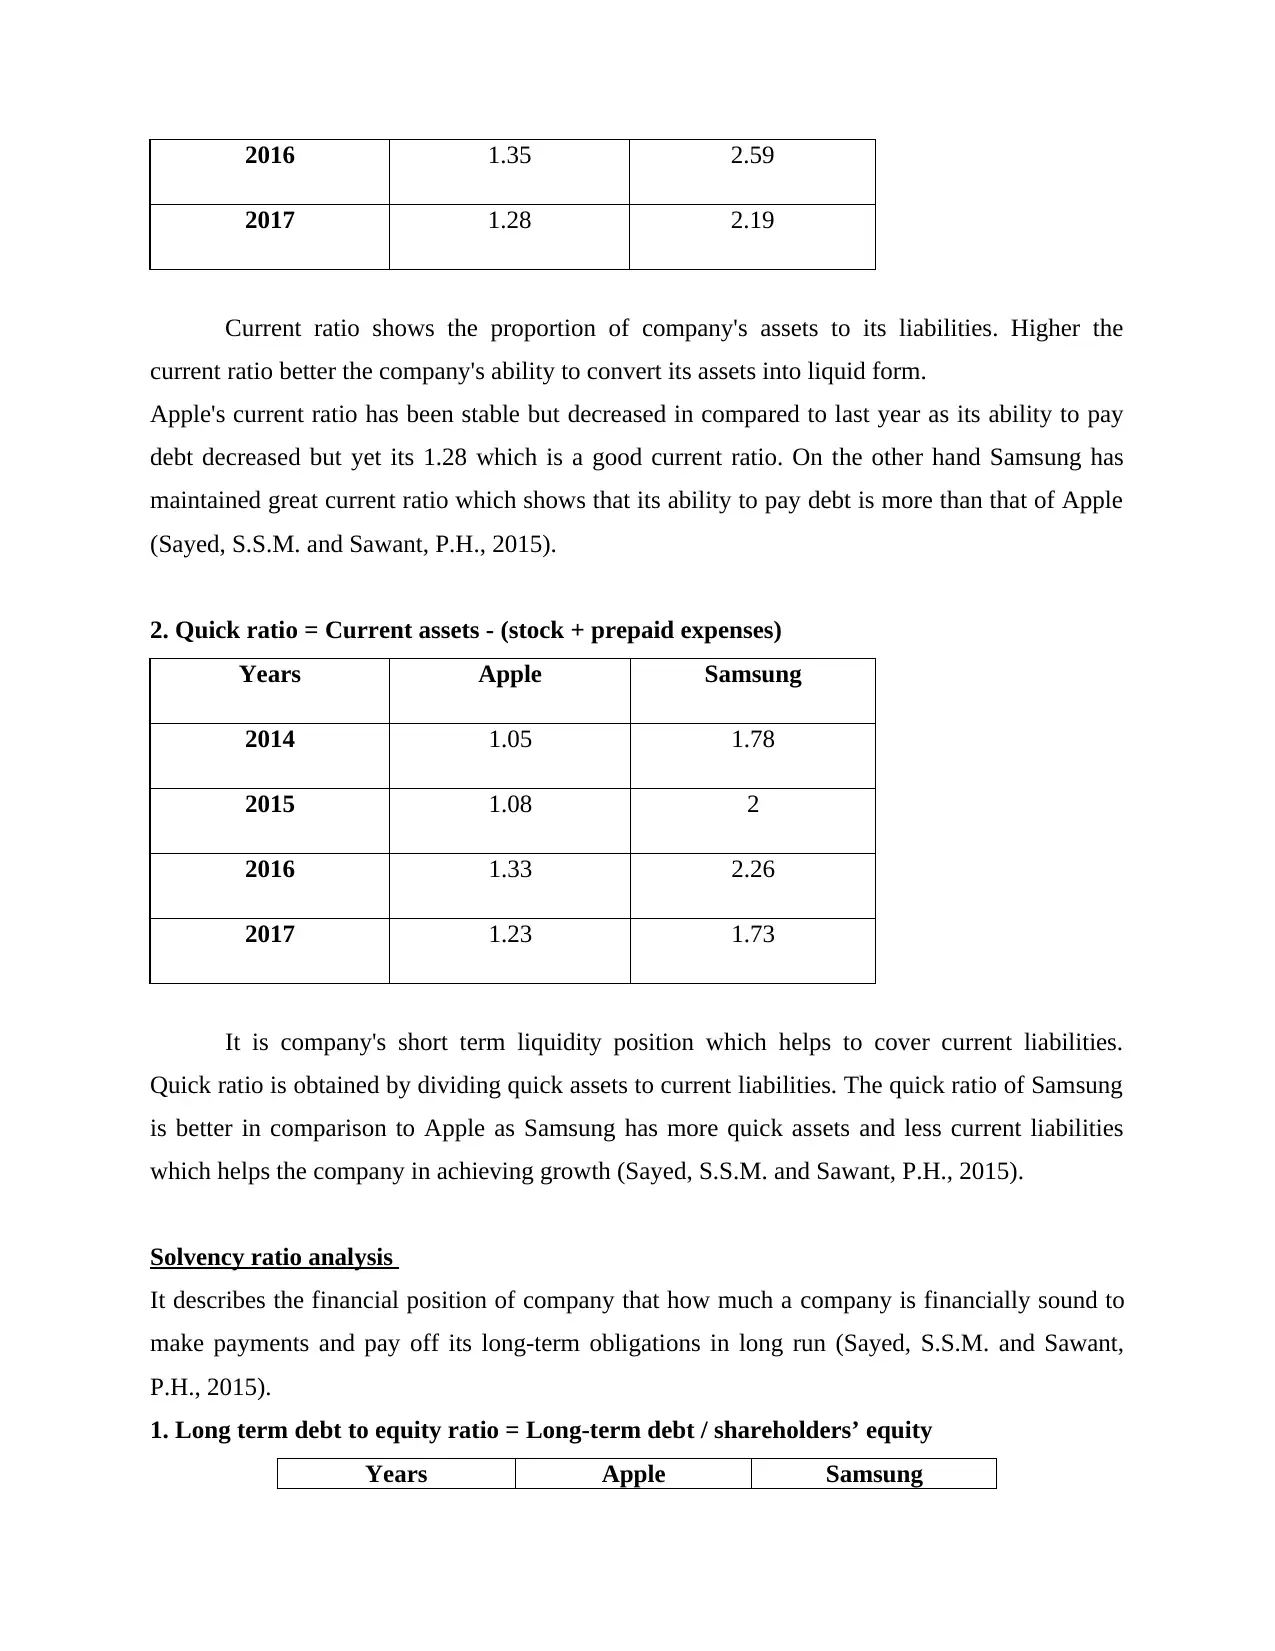
2016 1.35 2.59
2017 1.28 2.19
Current ratio shows the proportion of company's assets to its liabilities. Higher the
current ratio better the company's ability to convert its assets into liquid form.
Apple's current ratio has been stable but decreased in compared to last year as its ability to pay
debt decreased but yet its 1.28 which is a good current ratio. On the other hand Samsung has
maintained great current ratio which shows that its ability to pay debt is more than that of Apple
(Sayed, S.S.M. and Sawant, P.H., 2015).
2. Quick ratio = Current assets - (stock + prepaid expenses)
Years Apple Samsung
2014 1.05 1.78
2015 1.08 2
2016 1.33 2.26
2017 1.23 1.73
It is company's short term liquidity position which helps to cover current liabilities.
Quick ratio is obtained by dividing quick assets to current liabilities. The quick ratio of Samsung
is better in comparison to Apple as Samsung has more quick assets and less current liabilities
which helps the company in achieving growth (Sayed, S.S.M. and Sawant, P.H., 2015).
Solvency ratio analysis
It describes the financial position of company that how much a company is financially sound to
make payments and pay off its long-term obligations in long run (Sayed, S.S.M. and Sawant,
P.H., 2015).
1. Long term debt to equity ratio = Long-term debt / shareholders’ equity
Years Apple Samsung
⊘ This is a preview!⊘
Do you want full access?
Subscribe today to unlock all pages.
Trusted by 1+ million students worldwide
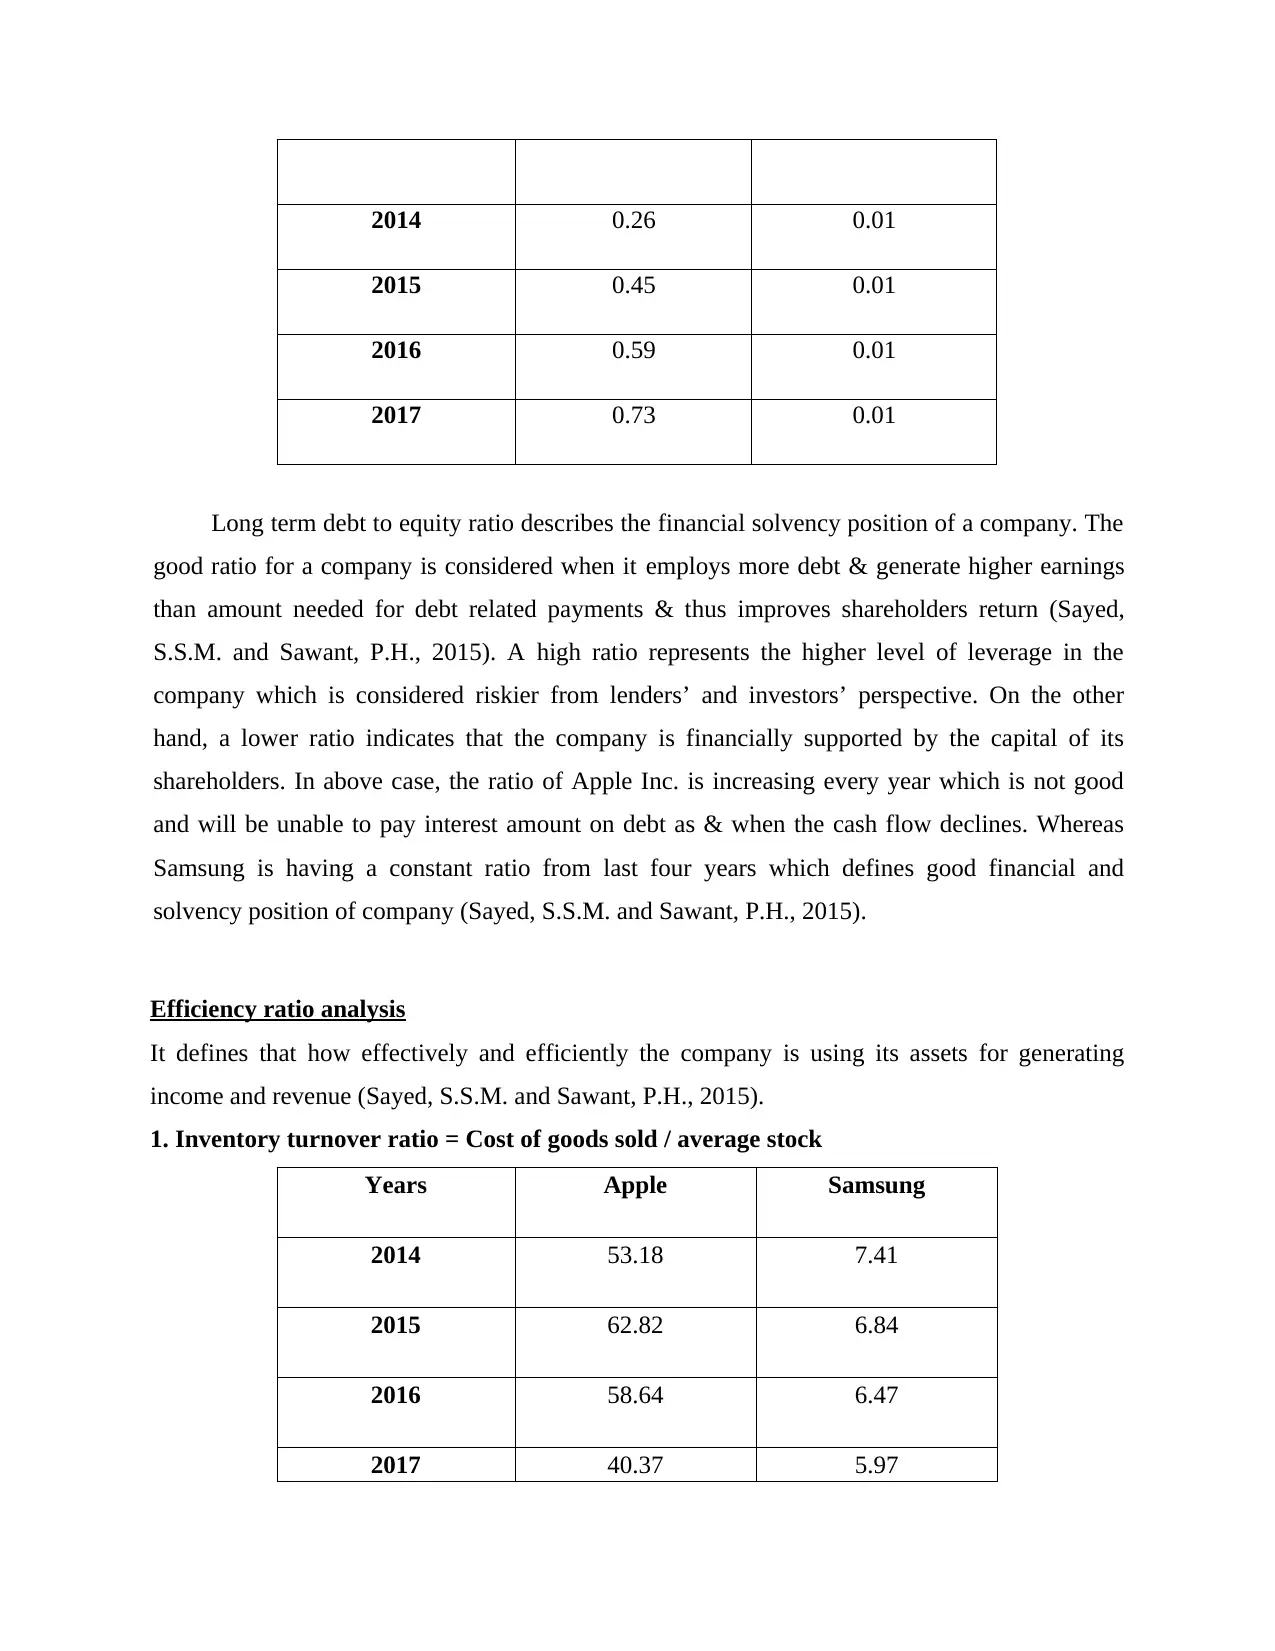
2014 0.26 0.01
2015 0.45 0.01
2016 0.59 0.01
2017 0.73 0.01
Long term debt to equity ratio describes the financial solvency position of a company. The
good ratio for a company is considered when it employs more debt & generate higher earnings
than amount needed for debt related payments & thus improves shareholders return (Sayed,
S.S.M. and Sawant, P.H., 2015). A high ratio represents the higher level of leverage in the
company which is considered riskier from lenders’ and investors’ perspective. On the other
hand, a lower ratio indicates that the company is financially supported by the capital of its
shareholders. In above case, the ratio of Apple Inc. is increasing every year which is not good
and will be unable to pay interest amount on debt as & when the cash flow declines. Whereas
Samsung is having a constant ratio from last four years which defines good financial and
solvency position of company (Sayed, S.S.M. and Sawant, P.H., 2015).
Efficiency ratio analysis
It defines that how effectively and efficiently the company is using its assets for generating
income and revenue (Sayed, S.S.M. and Sawant, P.H., 2015).
1. Inventory turnover ratio = Cost of goods sold / average stock
Years Apple Samsung
2014 53.18 7.41
2015 62.82 6.84
2016 58.64 6.47
2017 40.37 5.97
Paraphrase This Document
Need a fresh take? Get an instant paraphrase of this document with our AI Paraphraser
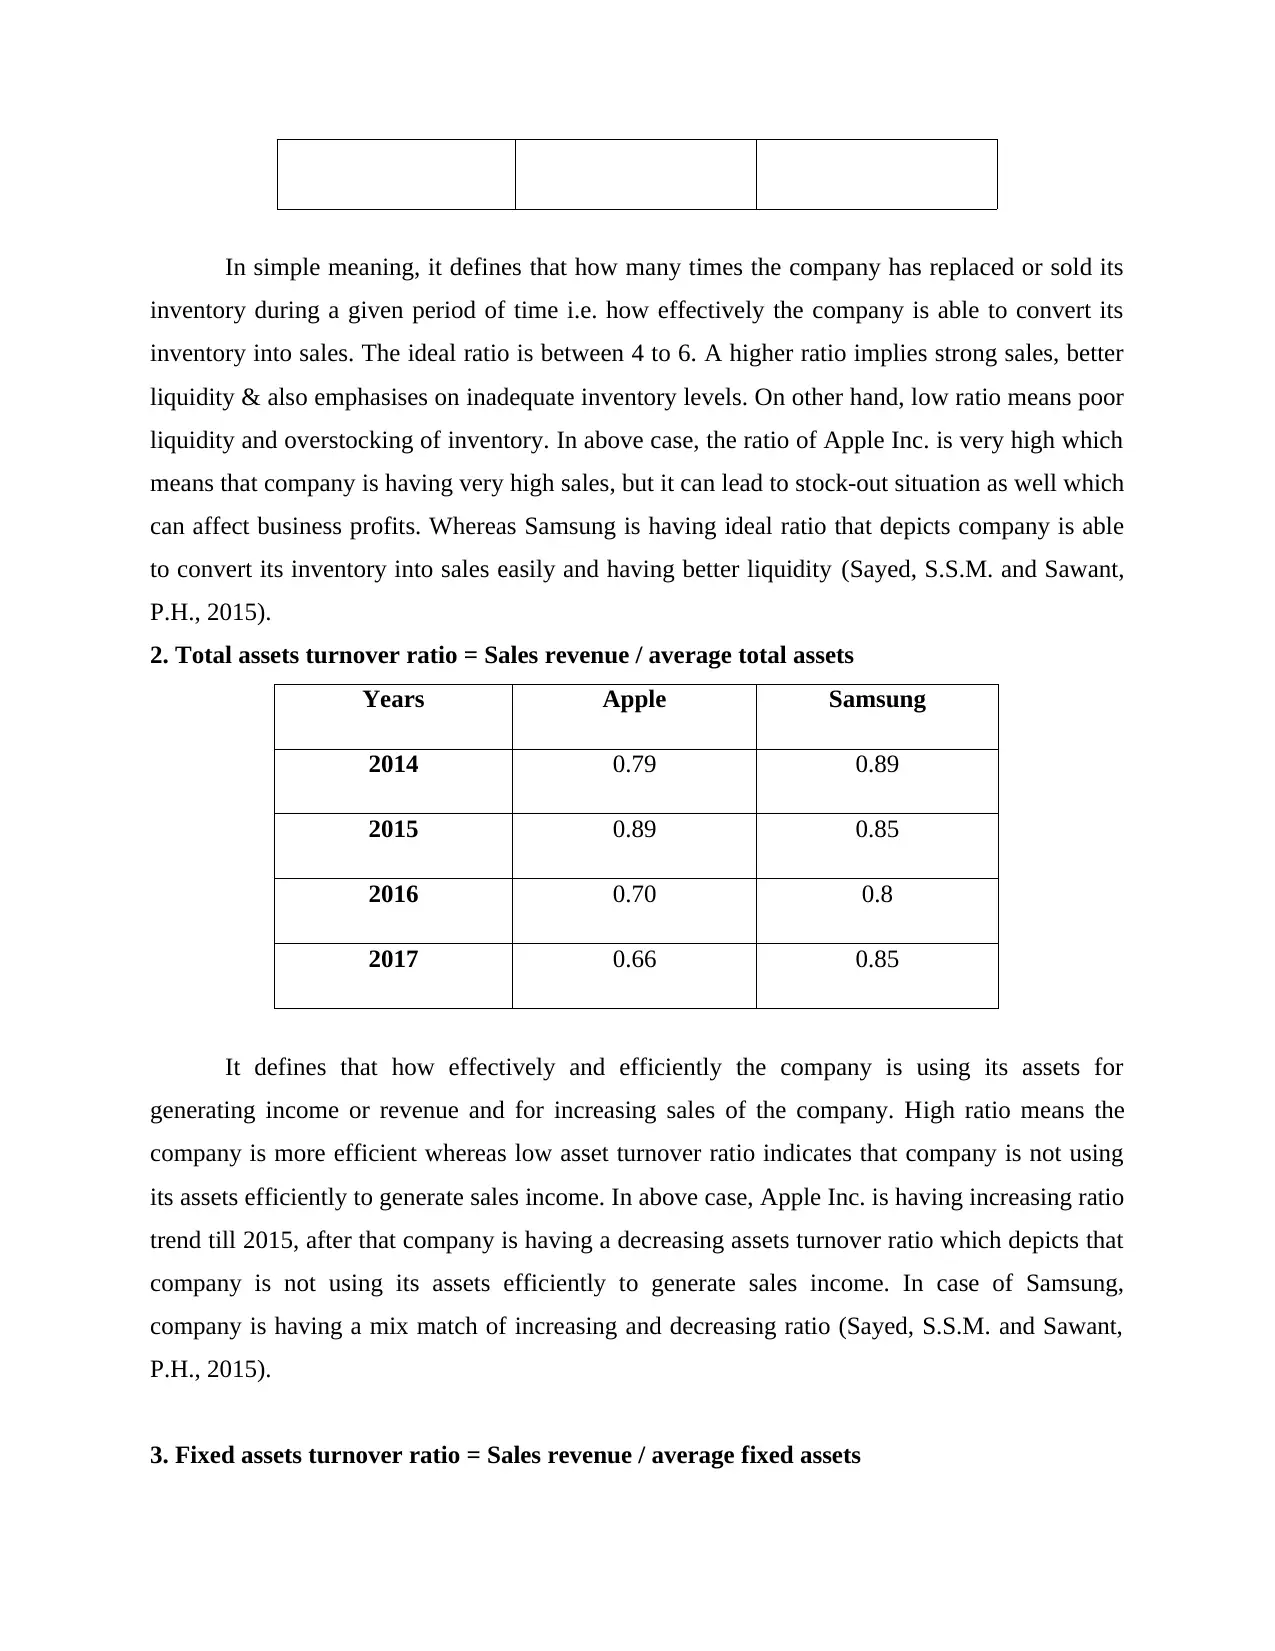
In simple meaning, it defines that how many times the company has replaced or sold its
inventory during a given period of time i.e. how effectively the company is able to convert its
inventory into sales. The ideal ratio is between 4 to 6. A higher ratio implies strong sales, better
liquidity & also emphasises on inadequate inventory levels. On other hand, low ratio means poor
liquidity and overstocking of inventory. In above case, the ratio of Apple Inc. is very high which
means that company is having very high sales, but it can lead to stock-out situation as well which
can affect business profits. Whereas Samsung is having ideal ratio that depicts company is able
to convert its inventory into sales easily and having better liquidity (Sayed, S.S.M. and Sawant,
P.H., 2015).
2. Total assets turnover ratio = Sales revenue / average total assets
Years Apple Samsung
2014 0.79 0.89
2015 0.89 0.85
2016 0.70 0.8
2017 0.66 0.85
It defines that how effectively and efficiently the company is using its assets for
generating income or revenue and for increasing sales of the company. High ratio means the
company is more efficient whereas low asset turnover ratio indicates that company is not using
its assets efficiently to generate sales income. In above case, Apple Inc. is having increasing ratio
trend till 2015, after that company is having a decreasing assets turnover ratio which depicts that
company is not using its assets efficiently to generate sales income. In case of Samsung,
company is having a mix match of increasing and decreasing ratio (Sayed, S.S.M. and Sawant,
P.H., 2015).
3. Fixed assets turnover ratio = Sales revenue / average fixed assets
Years Apple Samsung
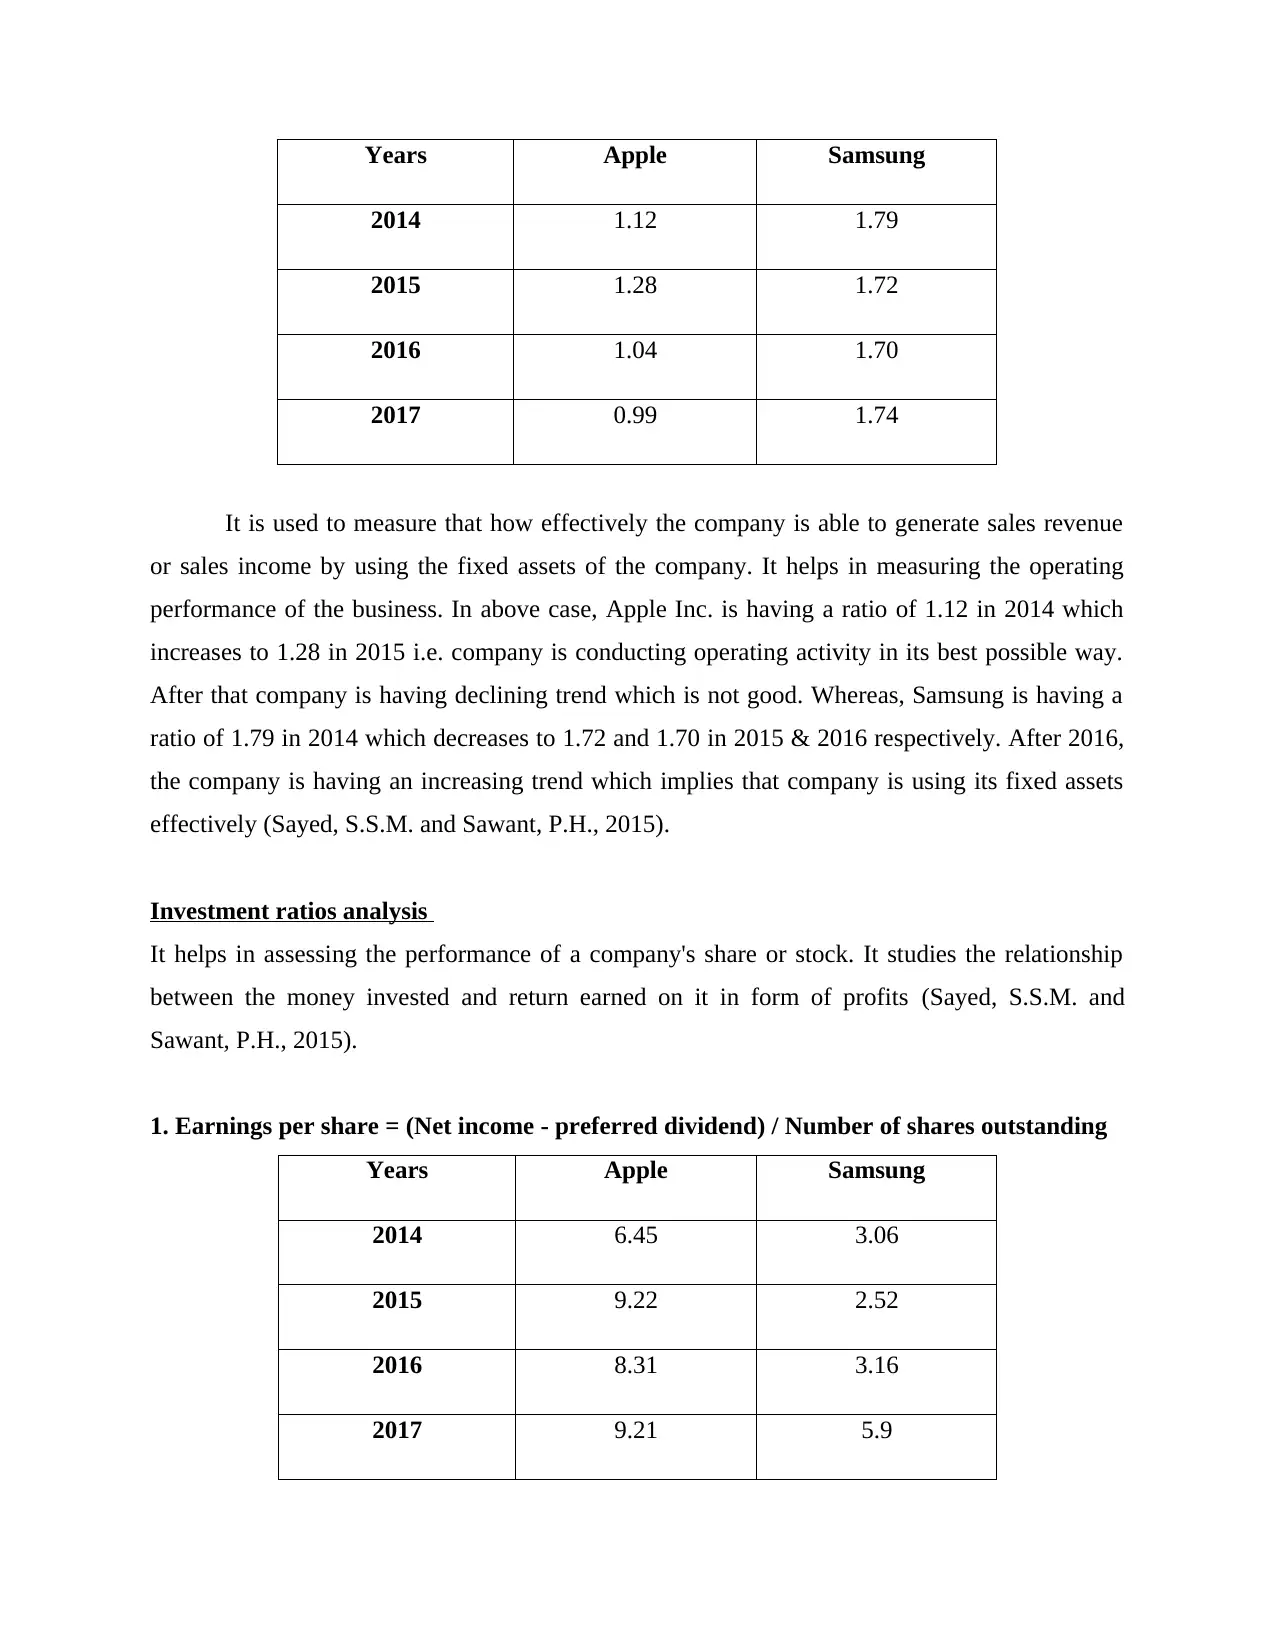
2014 1.12 1.79
2015 1.28 1.72
2016 1.04 1.70
2017 0.99 1.74
It is used to measure that how effectively the company is able to generate sales revenue
or sales income by using the fixed assets of the company. It helps in measuring the operating
performance of the business. In above case, Apple Inc. is having a ratio of 1.12 in 2014 which
increases to 1.28 in 2015 i.e. company is conducting operating activity in its best possible way.
After that company is having declining trend which is not good. Whereas, Samsung is having a
ratio of 1.79 in 2014 which decreases to 1.72 and 1.70 in 2015 & 2016 respectively. After 2016,
the company is having an increasing trend which implies that company is using its fixed assets
effectively (Sayed, S.S.M. and Sawant, P.H., 2015).
Investment ratios analysis
It helps in assessing the performance of a company's share or stock. It studies the relationship
between the money invested and return earned on it in form of profits (Sayed, S.S.M. and
Sawant, P.H., 2015).
1. Earnings per share = (Net income - preferred dividend) / Number of shares outstanding
Years Apple Samsung
2014 6.45 3.06
2015 9.22 2.52
2016 8.31 3.16
2017 9.21 5.9
⊘ This is a preview!⊘
Do you want full access?
Subscribe today to unlock all pages.
Trusted by 1+ million students worldwide
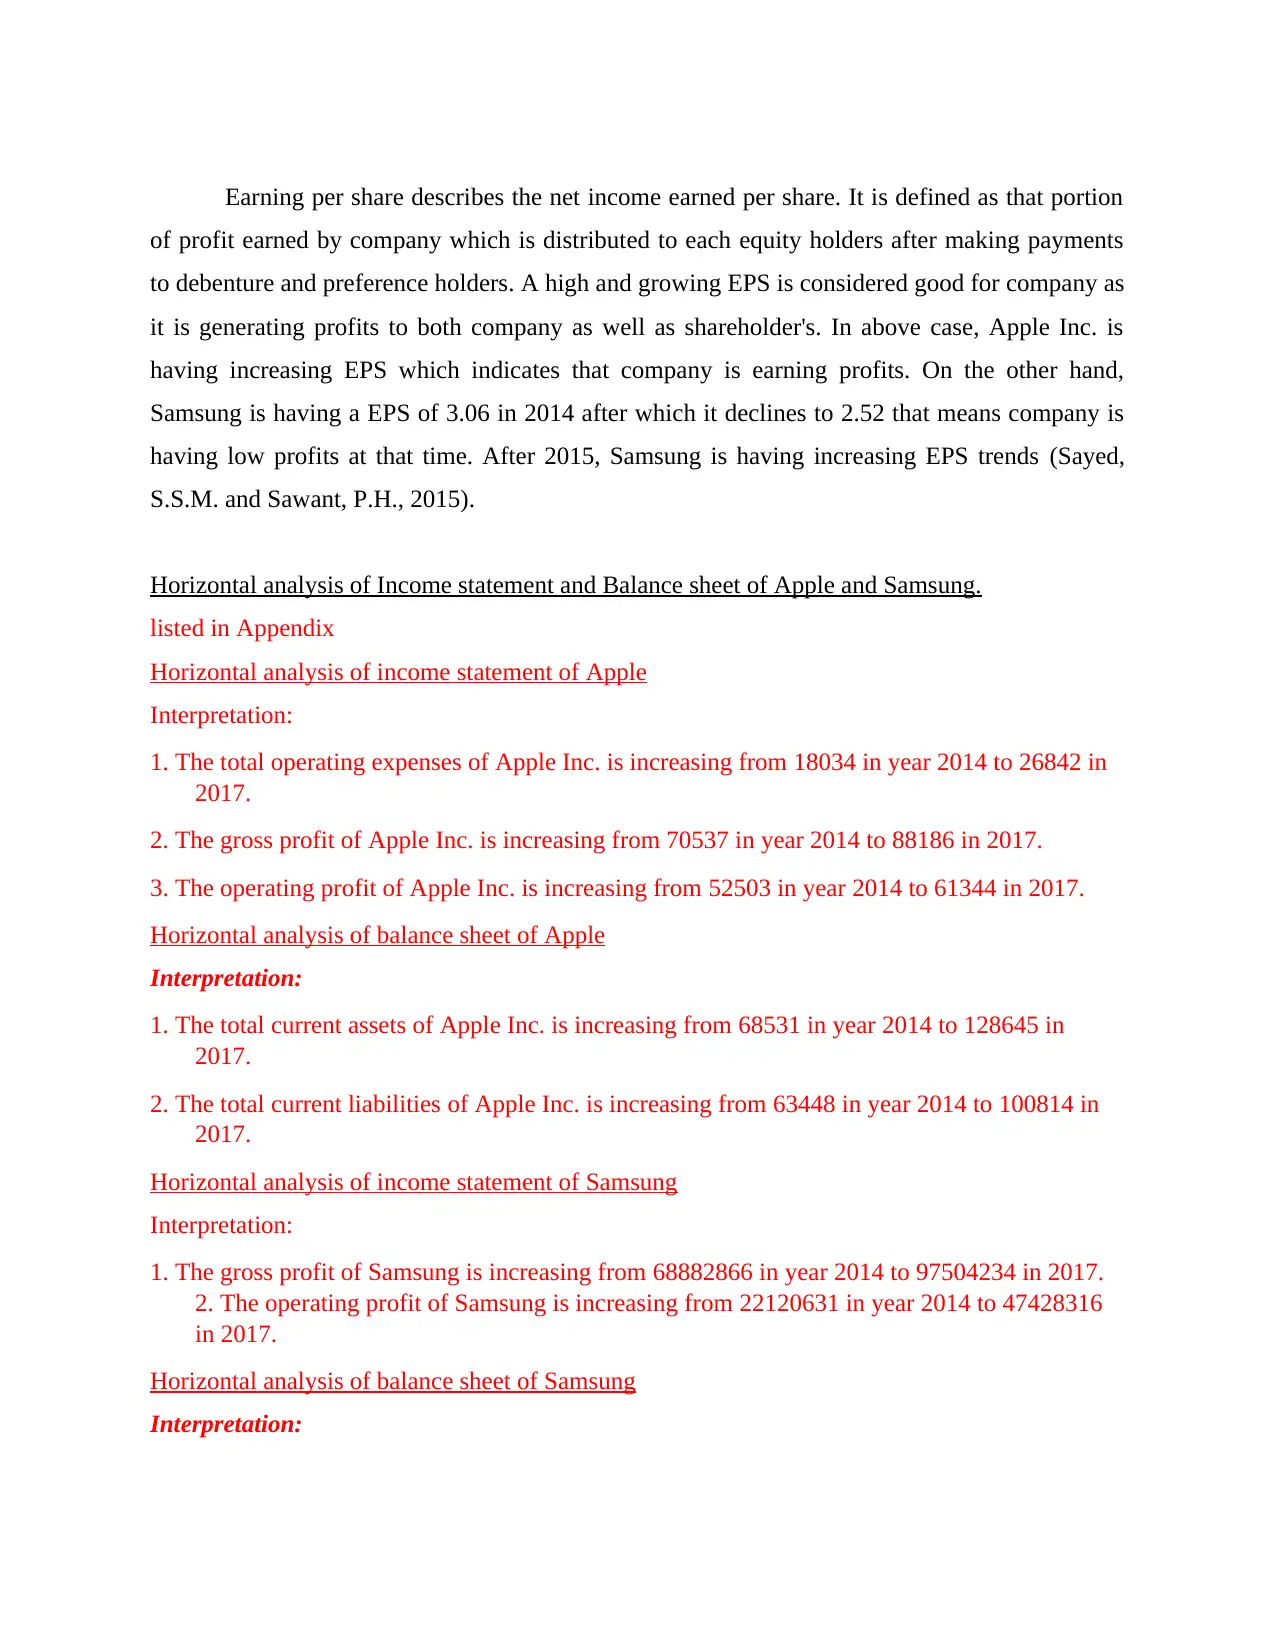
Earning per share describes the net income earned per share. It is defined as that portion
of profit earned by company which is distributed to each equity holders after making payments
to debenture and preference holders. A high and growing EPS is considered good for company as
it is generating profits to both company as well as shareholder's. In above case, Apple Inc. is
having increasing EPS which indicates that company is earning profits. On the other hand,
Samsung is having a EPS of 3.06 in 2014 after which it declines to 2.52 that means company is
having low profits at that time. After 2015, Samsung is having increasing EPS trends (Sayed,
S.S.M. and Sawant, P.H., 2015).
Horizontal analysis of Income statement and Balance sheet of Apple and Samsung.
listed in Appendix
Horizontal analysis of income statement of Apple
Interpretation:
1. The total operating expenses of Apple Inc. is increasing from 18034 in year 2014 to 26842 in
2017.
2. The gross profit of Apple Inc. is increasing from 70537 in year 2014 to 88186 in 2017.
3. The operating profit of Apple Inc. is increasing from 52503 in year 2014 to 61344 in 2017.
Horizontal analysis of balance sheet of Apple
Interpretation:
1. The total current assets of Apple Inc. is increasing from 68531 in year 2014 to 128645 in
2017.
2. The total current liabilities of Apple Inc. is increasing from 63448 in year 2014 to 100814 in
2017.
Horizontal analysis of income statement of Samsung
Interpretation:
1. The gross profit of Samsung is increasing from 68882866 in year 2014 to 97504234 in 2017.
2. The operating profit of Samsung is increasing from 22120631 in year 2014 to 47428316
in 2017.
Horizontal analysis of balance sheet of Samsung
Interpretation:
Paraphrase This Document
Need a fresh take? Get an instant paraphrase of this document with our AI Paraphraser
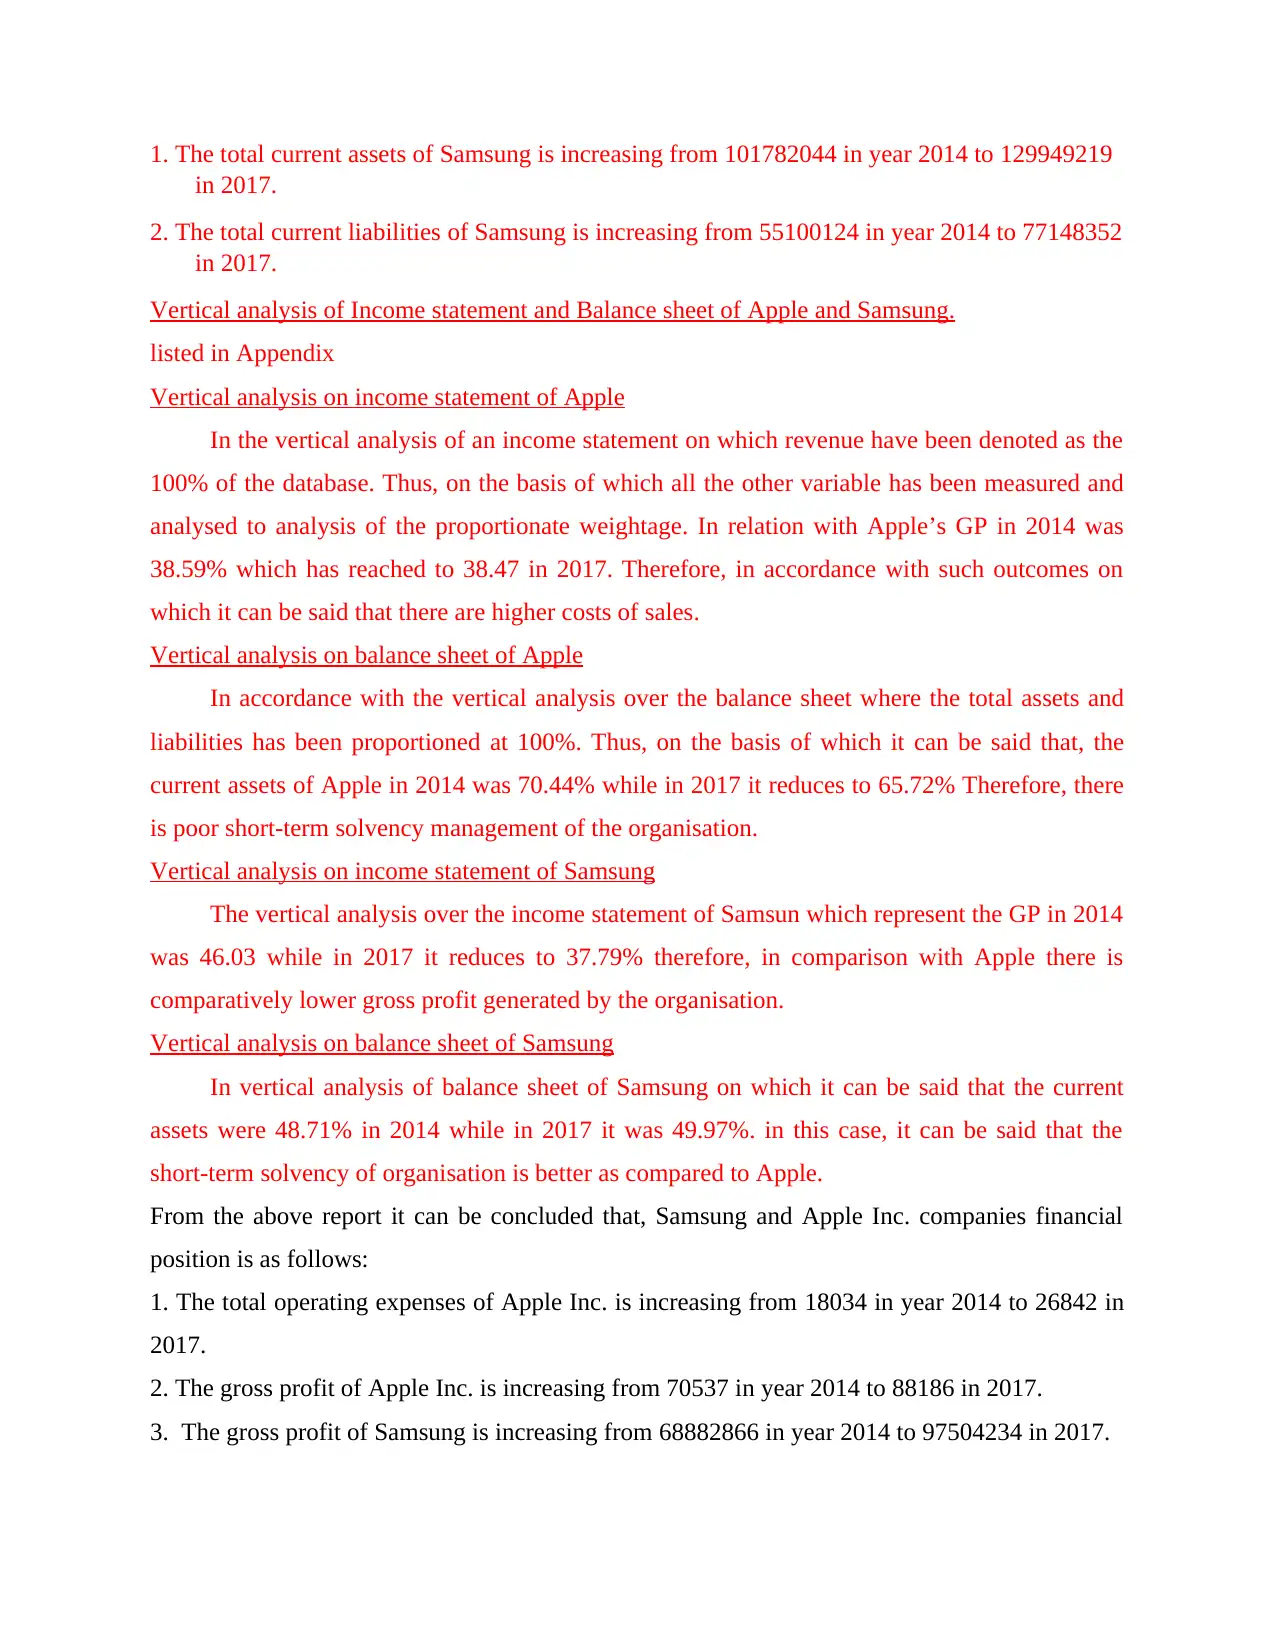
1. The total current assets of Samsung is increasing from 101782044 in year 2014 to 129949219
in 2017.
2. The total current liabilities of Samsung is increasing from 55100124 in year 2014 to 77148352
in 2017.
Vertical analysis of Income statement and Balance sheet of Apple and Samsung.
listed in Appendix
Vertical analysis on income statement of Apple
In the vertical analysis of an income statement on which revenue have been denoted as the
100% of the database. Thus, on the basis of which all the other variable has been measured and
analysed to analysis of the proportionate weightage. In relation with Apple’s GP in 2014 was
38.59% which has reached to 38.47 in 2017. Therefore, in accordance with such outcomes on
which it can be said that there are higher costs of sales.
Vertical analysis on balance sheet of Apple
In accordance with the vertical analysis over the balance sheet where the total assets and
liabilities has been proportioned at 100%. Thus, on the basis of which it can be said that, the
current assets of Apple in 2014 was 70.44% while in 2017 it reduces to 65.72% Therefore, there
is poor short-term solvency management of the organisation.
Vertical analysis on income statement of Samsung
The vertical analysis over the income statement of Samsun which represent the GP in 2014
was 46.03 while in 2017 it reduces to 37.79% therefore, in comparison with Apple there is
comparatively lower gross profit generated by the organisation.
Vertical analysis on balance sheet of Samsung
In vertical analysis of balance sheet of Samsung on which it can be said that the current
assets were 48.71% in 2014 while in 2017 it was 49.97%. in this case, it can be said that the
short-term solvency of organisation is better as compared to Apple.
From the above report it can be concluded that, Samsung and Apple Inc. companies financial
position is as follows:
1. The total operating expenses of Apple Inc. is increasing from 18034 in year 2014 to 26842 in
2017.
2. The gross profit of Apple Inc. is increasing from 70537 in year 2014 to 88186 in 2017.
3. The gross profit of Samsung is increasing from 68882866 in year 2014 to 97504234 in 2017.
in 2017.
2. The total current liabilities of Samsung is increasing from 55100124 in year 2014 to 77148352
in 2017.
Vertical analysis of Income statement and Balance sheet of Apple and Samsung.
listed in Appendix
Vertical analysis on income statement of Apple
In the vertical analysis of an income statement on which revenue have been denoted as the
100% of the database. Thus, on the basis of which all the other variable has been measured and
analysed to analysis of the proportionate weightage. In relation with Apple’s GP in 2014 was
38.59% which has reached to 38.47 in 2017. Therefore, in accordance with such outcomes on
which it can be said that there are higher costs of sales.
Vertical analysis on balance sheet of Apple
In accordance with the vertical analysis over the balance sheet where the total assets and
liabilities has been proportioned at 100%. Thus, on the basis of which it can be said that, the
current assets of Apple in 2014 was 70.44% while in 2017 it reduces to 65.72% Therefore, there
is poor short-term solvency management of the organisation.
Vertical analysis on income statement of Samsung
The vertical analysis over the income statement of Samsun which represent the GP in 2014
was 46.03 while in 2017 it reduces to 37.79% therefore, in comparison with Apple there is
comparatively lower gross profit generated by the organisation.
Vertical analysis on balance sheet of Samsung
In vertical analysis of balance sheet of Samsung on which it can be said that the current
assets were 48.71% in 2014 while in 2017 it was 49.97%. in this case, it can be said that the
short-term solvency of organisation is better as compared to Apple.
From the above report it can be concluded that, Samsung and Apple Inc. companies financial
position is as follows:
1. The total operating expenses of Apple Inc. is increasing from 18034 in year 2014 to 26842 in
2017.
2. The gross profit of Apple Inc. is increasing from 70537 in year 2014 to 88186 in 2017.
3. The gross profit of Samsung is increasing from 68882866 in year 2014 to 97504234 in 2017.
4. The operating profit of Samsung is increasing from 22120631 in year 2014 to 47428316 in
2017.
5. The operating profit of Apple Inc. is increasing from 52503 in year 2014 to 61344 in 2017.
6. The total current assets of Apple Inc. is increasing from 68531 in year 2014 to 128645 in
2017.
7. The total current liabilities of Apple Inc. is increasing from 63448 in year 2014 to 100814 in
2017.
8. The total current assets of Samsung is increasing from 101782044 in year 2014 to 129949219
in 2017.
9. The total current liabilities of Samsung is increasing from 55100124 in year 2014 to 77148352
in 2017.
TASK 2
Corporate Social Responsibility.
Corporate Social Responsibility as per Section 135 of the Companies Act, 2013 is a
business concept which is adopted by most of the business organisations nowadays, which
emphasizes on contributing to sustainable use of natural resources and sustainable development
of the business as well as of the society in which it is conducting its business activity (Hopkins,
M., 2017). As per the provision, companies have to spend at least 2 percent of their average net
profits made in the preceding three years on CSR activity. It is a business approach which fosters
towards sustainable development of the society, company's stakeholders by rendering cultural,
social, economical and environmental benefits (Hopkins, M., 2017).
Corporate Social Responsibility of Samsung - The CSR vision of Samsung is “Global Harmony
with People, Society and Environment”. Samsung CSR activity is managed and conducted by
Samsung CSR Committee (Hopkins, M., 2017). The areas focused by Samsung for activity of
corporate social responsibility are:
1. Healthcare - The company's main purpose is to enhance medical and hospital care
facilities with well equipped instruments to both society and its employees. It focuses on
installation of new, improved and best medical equipments, technology and instruments for
2017.
5. The operating profit of Apple Inc. is increasing from 52503 in year 2014 to 61344 in 2017.
6. The total current assets of Apple Inc. is increasing from 68531 in year 2014 to 128645 in
2017.
7. The total current liabilities of Apple Inc. is increasing from 63448 in year 2014 to 100814 in
2017.
8. The total current assets of Samsung is increasing from 101782044 in year 2014 to 129949219
in 2017.
9. The total current liabilities of Samsung is increasing from 55100124 in year 2014 to 77148352
in 2017.
TASK 2
Corporate Social Responsibility.
Corporate Social Responsibility as per Section 135 of the Companies Act, 2013 is a
business concept which is adopted by most of the business organisations nowadays, which
emphasizes on contributing to sustainable use of natural resources and sustainable development
of the business as well as of the society in which it is conducting its business activity (Hopkins,
M., 2017). As per the provision, companies have to spend at least 2 percent of their average net
profits made in the preceding three years on CSR activity. It is a business approach which fosters
towards sustainable development of the society, company's stakeholders by rendering cultural,
social, economical and environmental benefits (Hopkins, M., 2017).
Corporate Social Responsibility of Samsung - The CSR vision of Samsung is “Global Harmony
with People, Society and Environment”. Samsung CSR activity is managed and conducted by
Samsung CSR Committee (Hopkins, M., 2017). The areas focused by Samsung for activity of
corporate social responsibility are:
1. Healthcare - The company's main purpose is to enhance medical and hospital care
facilities with well equipped instruments to both society and its employees. It focuses on
installation of new, improved and best medical equipments, technology and instruments for
⊘ This is a preview!⊘
Do you want full access?
Subscribe today to unlock all pages.
Trusted by 1+ million students worldwide
1 out of 22
Related Documents


Your All-in-One AI-Powered Toolkit for Academic Success.
+13062052269
info@desklib.com
Available 24*7 on WhatsApp / Email
![[object Object]](/_next/static/media/star-bottom.7253800d.svg)
Unlock your academic potential
Copyright © 2020–2026 A2Z Services. All Rights Reserved. Developed and managed by ZUCOL.