Financial Analysis of TESCO plc: Performance and Position Report
VerifiedAdded on 2020/04/21
|15
|2438
|89
Report
AI Summary
This report presents a financial analysis of TESCO plc, evaluating its performance using ratio analysis, trend analysis, and a comparison with industry averages. The report examines liquidity, profitability, efficiency, solvency, and market-based ratios to assess TESCO's financial health. It highlights the company's challenges, including declining profitability and the need to increase revenue to remain competitive. The analysis includes a cross-sectional comparison with competitors like Morrison, ALDI, and ASDA, revealing TESCO's relative performance. The report concludes by emphasizing the importance of improving turnover and profitability for TESCO's sustainable business. Data sources include TESCO's annual reports and financial data from Bloomberg, Yahoo Finance, and Morningstar. The report follows International Financial Reporting Standards and UK accounting rules.
RUNNING HEAD: Financial analysis of TESCO plc
1
Name of the student
Topic- Financial analysis of TESCO plc
University name-
1
Name of the student
Topic- Financial analysis of TESCO plc
University name-
Paraphrase This Document
Need a fresh take? Get an instant paraphrase of this document with our AI Paraphraser
Financial analysis of TESCO plc 2
Executive summary
This report has reflected the key understanding on the Financial analysis of company and
evaluated the possible business trend which could be used by investors to invest their capital. In
this report, financial analysis of TESCO plc has been taken into consideration. This report will
divulge the use of ratio analysis, trend analysis to measure the business and financial
performance of company. However, there are other tools such as capital budgeting or use of
other sites such as yahoo finance, Bloomberg and Morningstar to evaluate the financial
performance of company.
Financial analysis of TESCO plc 3
Contents
Executive summary............................................................................................................2
Introduction.......................................................................................................................4
Present description of company........................................................................................4
Competitors Company’s name...........................................................................................4
Part-1................................................................................................................................. 5
Ratio analysis of Tesco and industry average.....................................................................5
Part-2............................................................................................................................... 10
Analysis the financial performance and position of TESCO plc....................................10
Part-3............................................................................................................................... 12
Conclusion........................................................................................................................13
⊘ This is a preview!⊘
Do you want full access?
Subscribe today to unlock all pages.
Trusted by 1+ million students worldwide
Financial analysis of TESCO plc 4
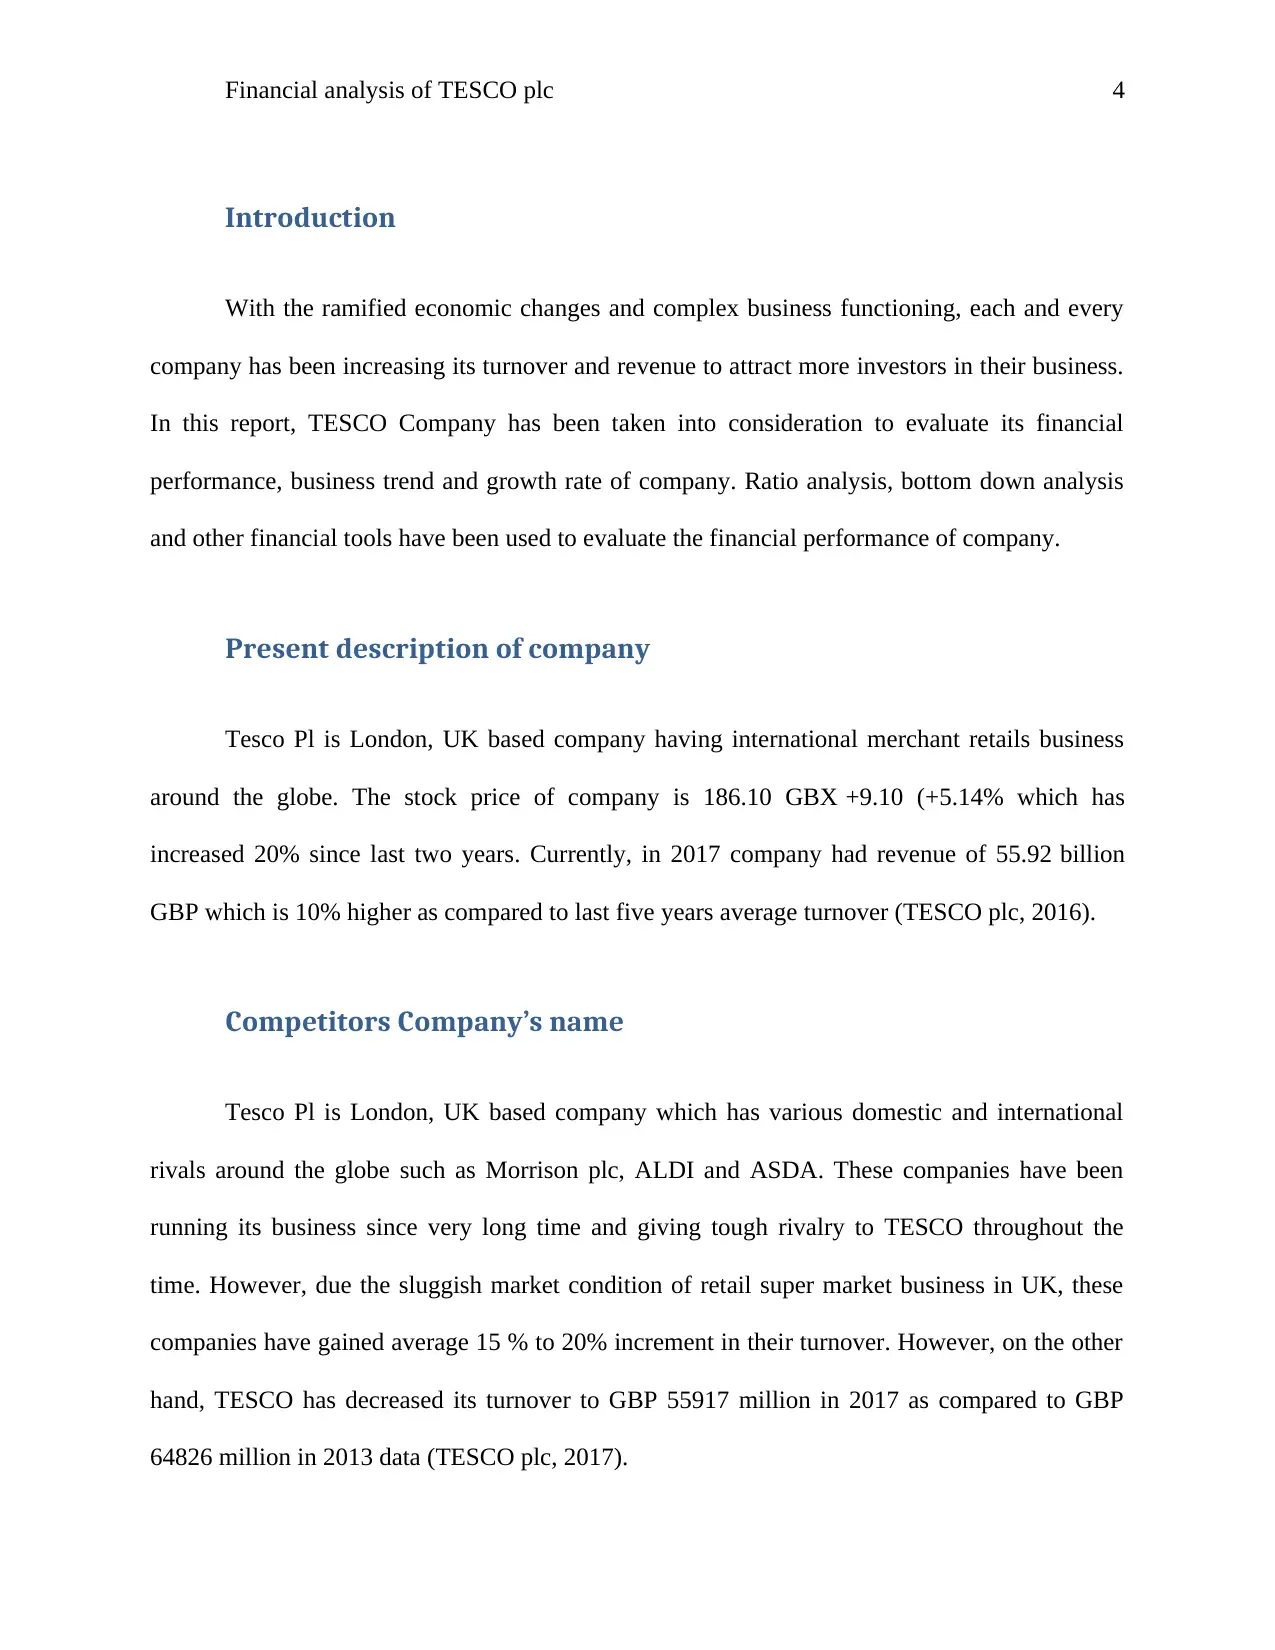
Introduction
With the ramified economic changes and complex business functioning, each and every
company has been increasing its turnover and revenue to attract more investors in their business.
In this report, TESCO Company has been taken into consideration to evaluate its financial
performance, business trend and growth rate of company. Ratio analysis, bottom down analysis
and other financial tools have been used to evaluate the financial performance of company.
Present description of company
Tesco Pl is London, UK based company having international merchant retails business
around the globe. The stock price of company is 186.10 GBX +9.10 (+5.14% which has
increased 20% since last two years. Currently, in 2017 company had revenue of 55.92 billion
GBP which is 10% higher as compared to last five years average turnover (TESCO plc, 2016).
Competitors Company’s name
Tesco Pl is London, UK based company which has various domestic and international
rivals around the globe such as Morrison plc, ALDI and ASDA. These companies have been
running its business since very long time and giving tough rivalry to TESCO throughout the
time. However, due the sluggish market condition of retail super market business in UK, these
companies have gained average 15 % to 20% increment in their turnover. However, on the other
hand, TESCO has decreased its turnover to GBP 55917 million in 2017 as compared to GBP
64826 million in 2013 data (TESCO plc, 2017).
Paraphrase This Document
Need a fresh take? Get an instant paraphrase of this document with our AI Paraphraser
Financial analysis of TESCO plc 5
Part-1
Ratio analysis of Tesco and industry average
Liquidity ratio of company
This ratio reflects the relation between two factors of business and provides the idea
about the business performance of company.
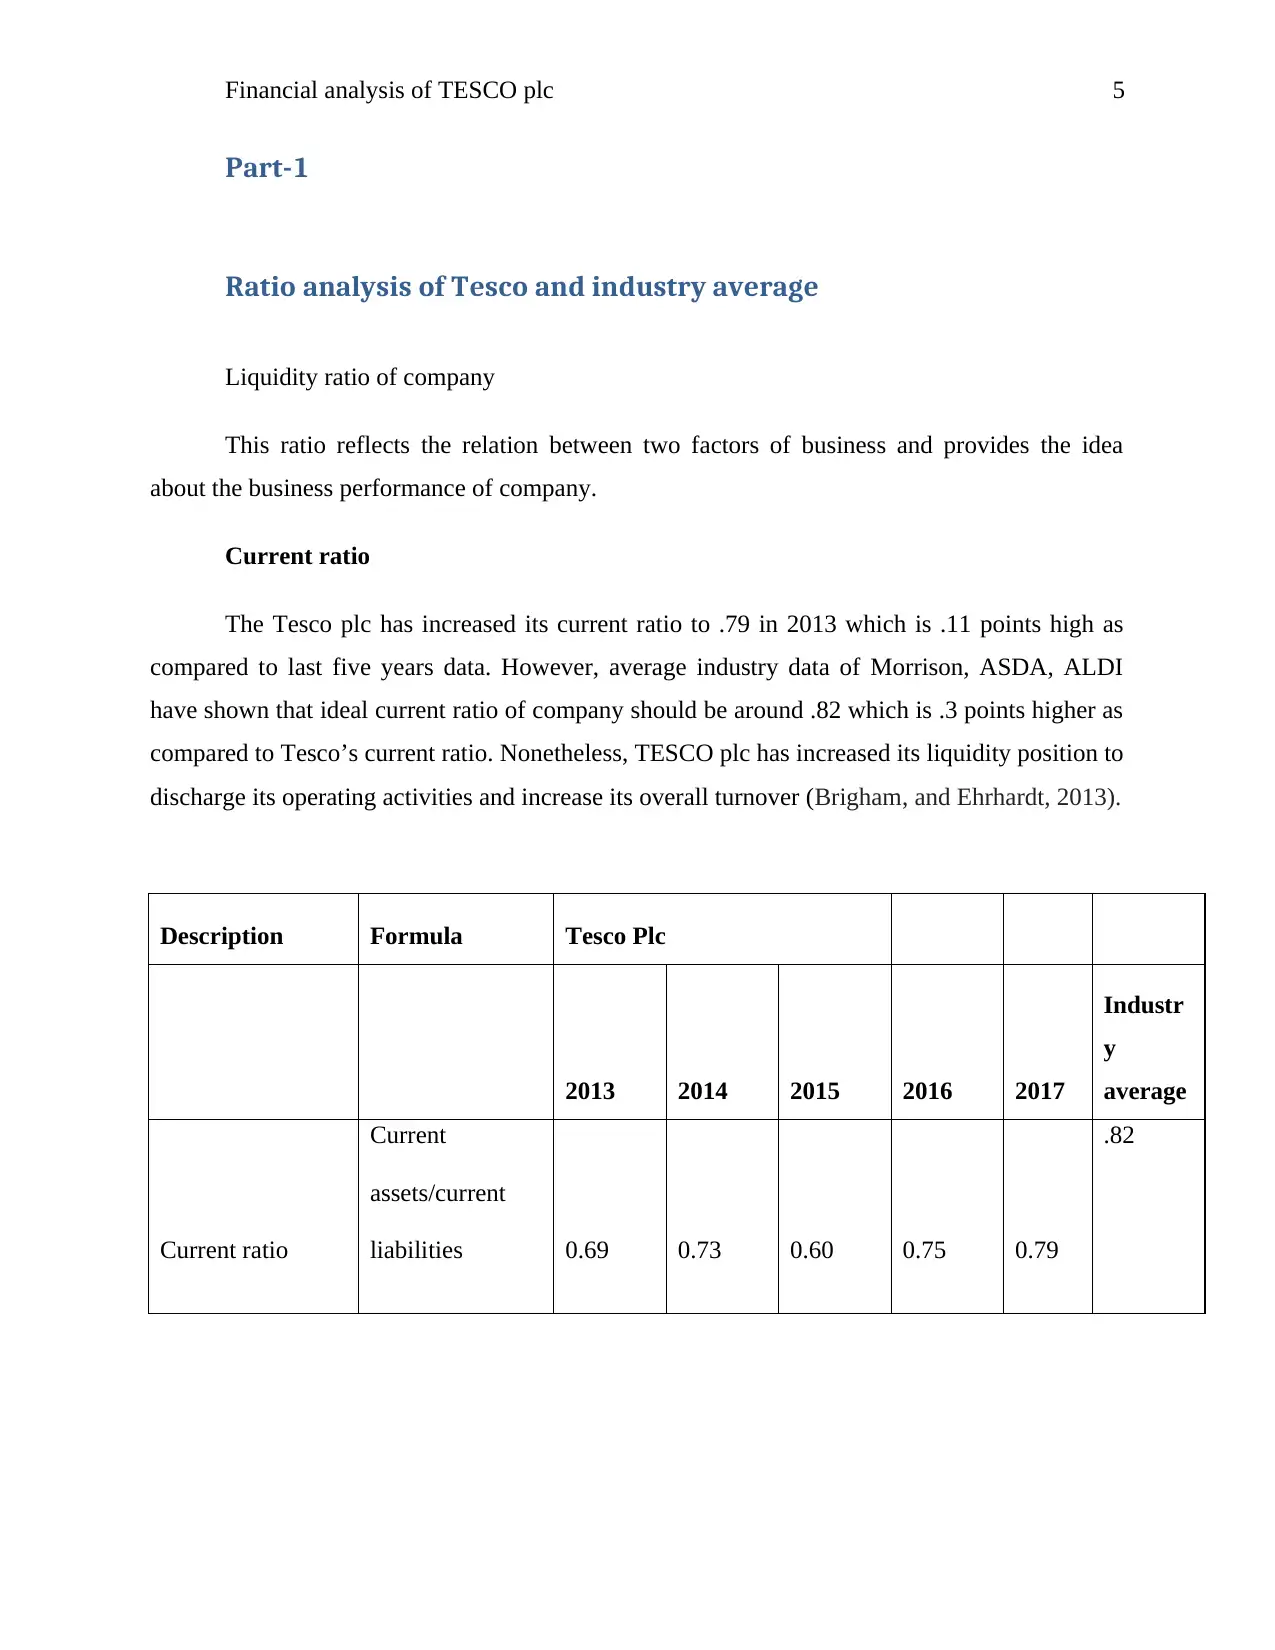
Current ratio
The Tesco plc has increased its current ratio to .79 in 2013 which is .11 points high as
compared to last five years data. However, average industry data of Morrison, ASDA, ALDI
have shown that ideal current ratio of company should be around .82 which is .3 points higher as
compared to Tesco’s current ratio. Nonetheless, TESCO plc has increased its liquidity position to
discharge its operating activities and increase its overall turnover (Brigham, and Ehrhardt, 2013).
Description Formula Tesco Plc
2013 2014 2015 2016 2017
Industr
y
average
Current ratio
Current
assets/current
liabilities 0.69 0.73 0.60 0.75 0.79
.82
Part-1
Ratio analysis of Tesco and industry average
Liquidity ratio of company
This ratio reflects the relation between two factors of business and provides the idea
about the business performance of company.
Current ratio
The Tesco plc has increased its current ratio to .79 in 2013 which is .11 points high as
compared to last five years data. However, average industry data of Morrison, ASDA, ALDI
have shown that ideal current ratio of company should be around .82 which is .3 points higher as
compared to Tesco’s current ratio. Nonetheless, TESCO plc has increased its liquidity position to
discharge its operating activities and increase its overall turnover (Brigham, and Ehrhardt, 2013).
Description Formula Tesco Plc
2013 2014 2015 2016 2017
Industr
y
average
Current ratio
Current
assets/current
liabilities 0.69 0.73 0.60 0.75 0.79
.82
Financial analysis of TESCO plc 6
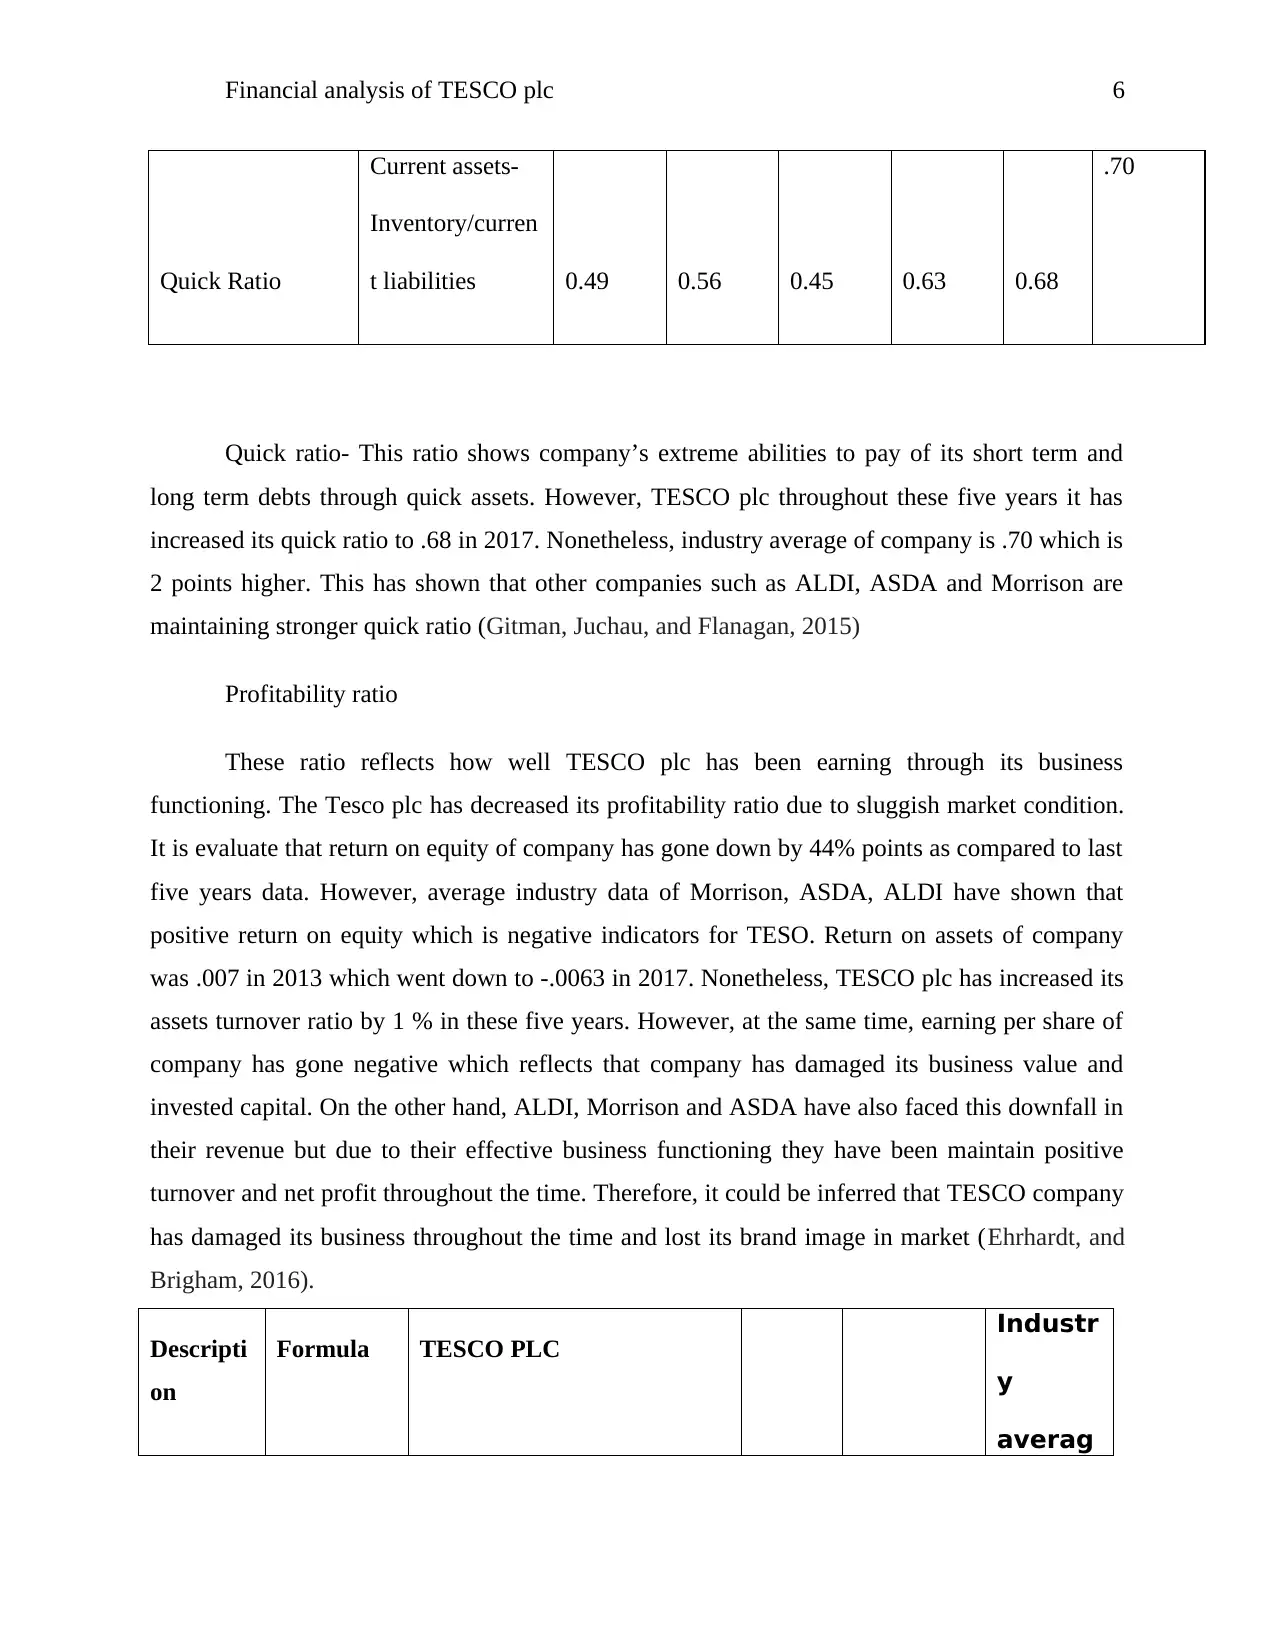
Quick Ratio
Current assets-
Inventory/curren
t liabilities 0.49 0.56 0.45 0.63 0.68
.70
Quick ratio- This ratio shows company’s extreme abilities to pay of its short term and
long term debts through quick assets. However, TESCO plc throughout these five years it has
increased its quick ratio to .68 in 2017. Nonetheless, industry average of company is .70 which is
2 points higher. This has shown that other companies such as ALDI, ASDA and Morrison are
maintaining stronger quick ratio (Gitman, Juchau, and Flanagan, 2015)
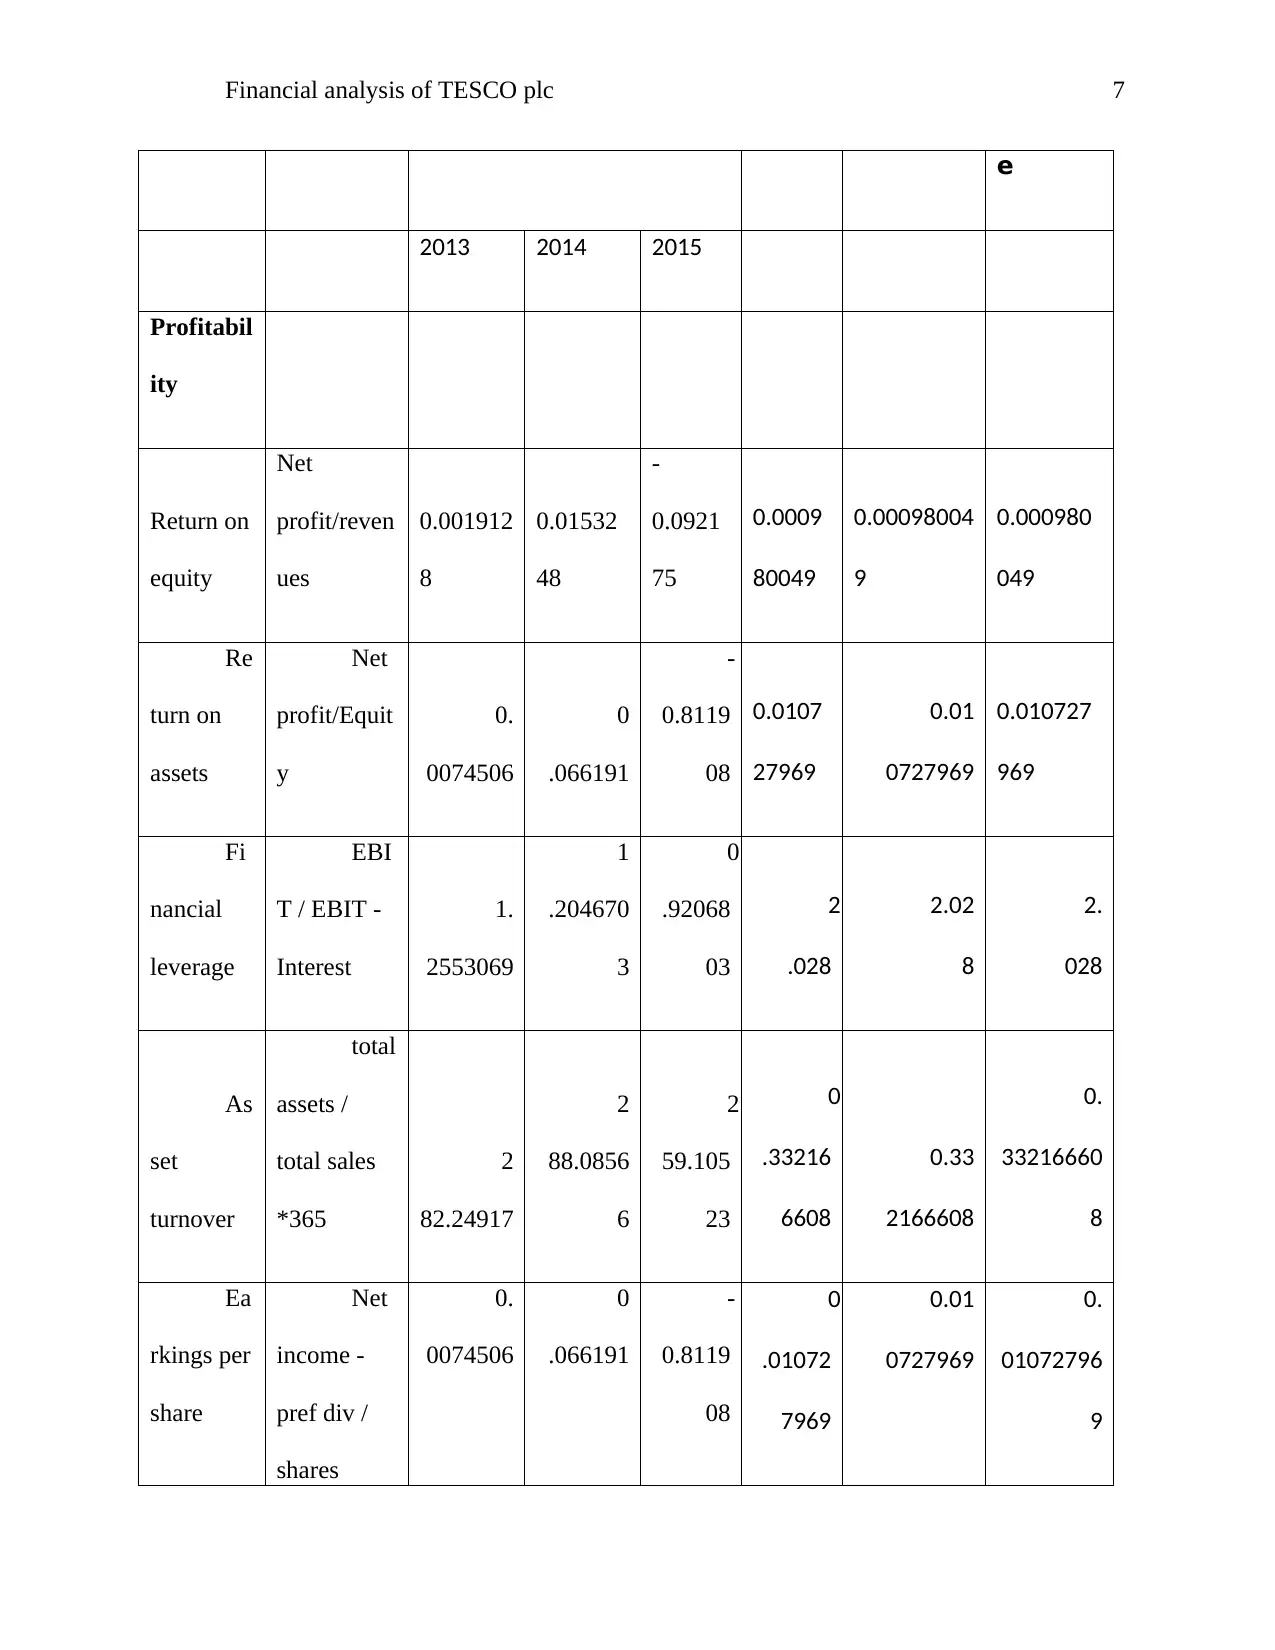
Profitability ratio
These ratio reflects how well TESCO plc has been earning through its business
functioning. The Tesco plc has decreased its profitability ratio due to sluggish market condition.
It is evaluate that return on equity of company has gone down by 44% points as compared to last
five years data. However, average industry data of Morrison, ASDA, ALDI have shown that
positive return on equity which is negative indicators for TESO. Return on assets of company
was .007 in 2013 which went down to -.0063 in 2017. Nonetheless, TESCO plc has increased its
assets turnover ratio by 1 % in these five years. However, at the same time, earning per share of
company has gone negative which reflects that company has damaged its business value and
invested capital. On the other hand, ALDI, Morrison and ASDA have also faced this downfall in
their revenue but due to their effective business functioning they have been maintain positive
turnover and net profit throughout the time. Therefore, it could be inferred that TESCO company
has damaged its business throughout the time and lost its brand image in market (Ehrhardt, and
Brigham, 2016).
Descripti
on
Formula TESCO PLC
Industr
y
averag
Quick Ratio
Current assets-
Inventory/curren
t liabilities 0.49 0.56 0.45 0.63 0.68
.70
Quick ratio- This ratio shows company’s extreme abilities to pay of its short term and
long term debts through quick assets. However, TESCO plc throughout these five years it has
increased its quick ratio to .68 in 2017. Nonetheless, industry average of company is .70 which is
2 points higher. This has shown that other companies such as ALDI, ASDA and Morrison are
maintaining stronger quick ratio (Gitman, Juchau, and Flanagan, 2015)
Profitability ratio
These ratio reflects how well TESCO plc has been earning through its business
functioning. The Tesco plc has decreased its profitability ratio due to sluggish market condition.
It is evaluate that return on equity of company has gone down by 44% points as compared to last
five years data. However, average industry data of Morrison, ASDA, ALDI have shown that
positive return on equity which is negative indicators for TESO. Return on assets of company
was .007 in 2013 which went down to -.0063 in 2017. Nonetheless, TESCO plc has increased its
assets turnover ratio by 1 % in these five years. However, at the same time, earning per share of
company has gone negative which reflects that company has damaged its business value and
invested capital. On the other hand, ALDI, Morrison and ASDA have also faced this downfall in
their revenue but due to their effective business functioning they have been maintain positive
turnover and net profit throughout the time. Therefore, it could be inferred that TESCO company
has damaged its business throughout the time and lost its brand image in market (Ehrhardt, and
Brigham, 2016).
Descripti
on
Formula TESCO PLC
Industr
y
averag
⊘ This is a preview!⊘
Do you want full access?
Subscribe today to unlock all pages.
Trusted by 1+ million students worldwide
Financial analysis of TESCO plc 7
e
2013 2014 2015
Profitabil
ity
Return on
equity
Net
profit/reven
ues
0.001912
8
0.01532
48
-
0.0921
75
0.0009
80049
0.00098004
9
0.000980
049
Re
turn on
assets
Net
profit/Equit
y
0.
0074506
0
.066191
-
0.8119
08
0.0107
27969
0.01
0727969
0.010727
969
Fi
nancial
leverage
EBI
T / EBIT -
Interest
1.
2553069
1
.204670
3
0
.92068
03
2
.028
2.02
8
2.
028
As
set
turnover
total
assets /
total sales
*365
2
82.24917
2
88.0856
6
2
59.105
23
0
.33216
6608
0.33
2166608
0.
33216660
8
Ea
rkings per
share
Net
income -
pref div /
shares
0.
0074506
0
.066191
-
0.8119
08
0
.01072
7969
0.01
0727969
0.
01072796
9
Paraphrase This Document
Need a fresh take? Get an instant paraphrase of this document with our AI Paraphraser
Financial analysis of TESCO plc 8
outstanding
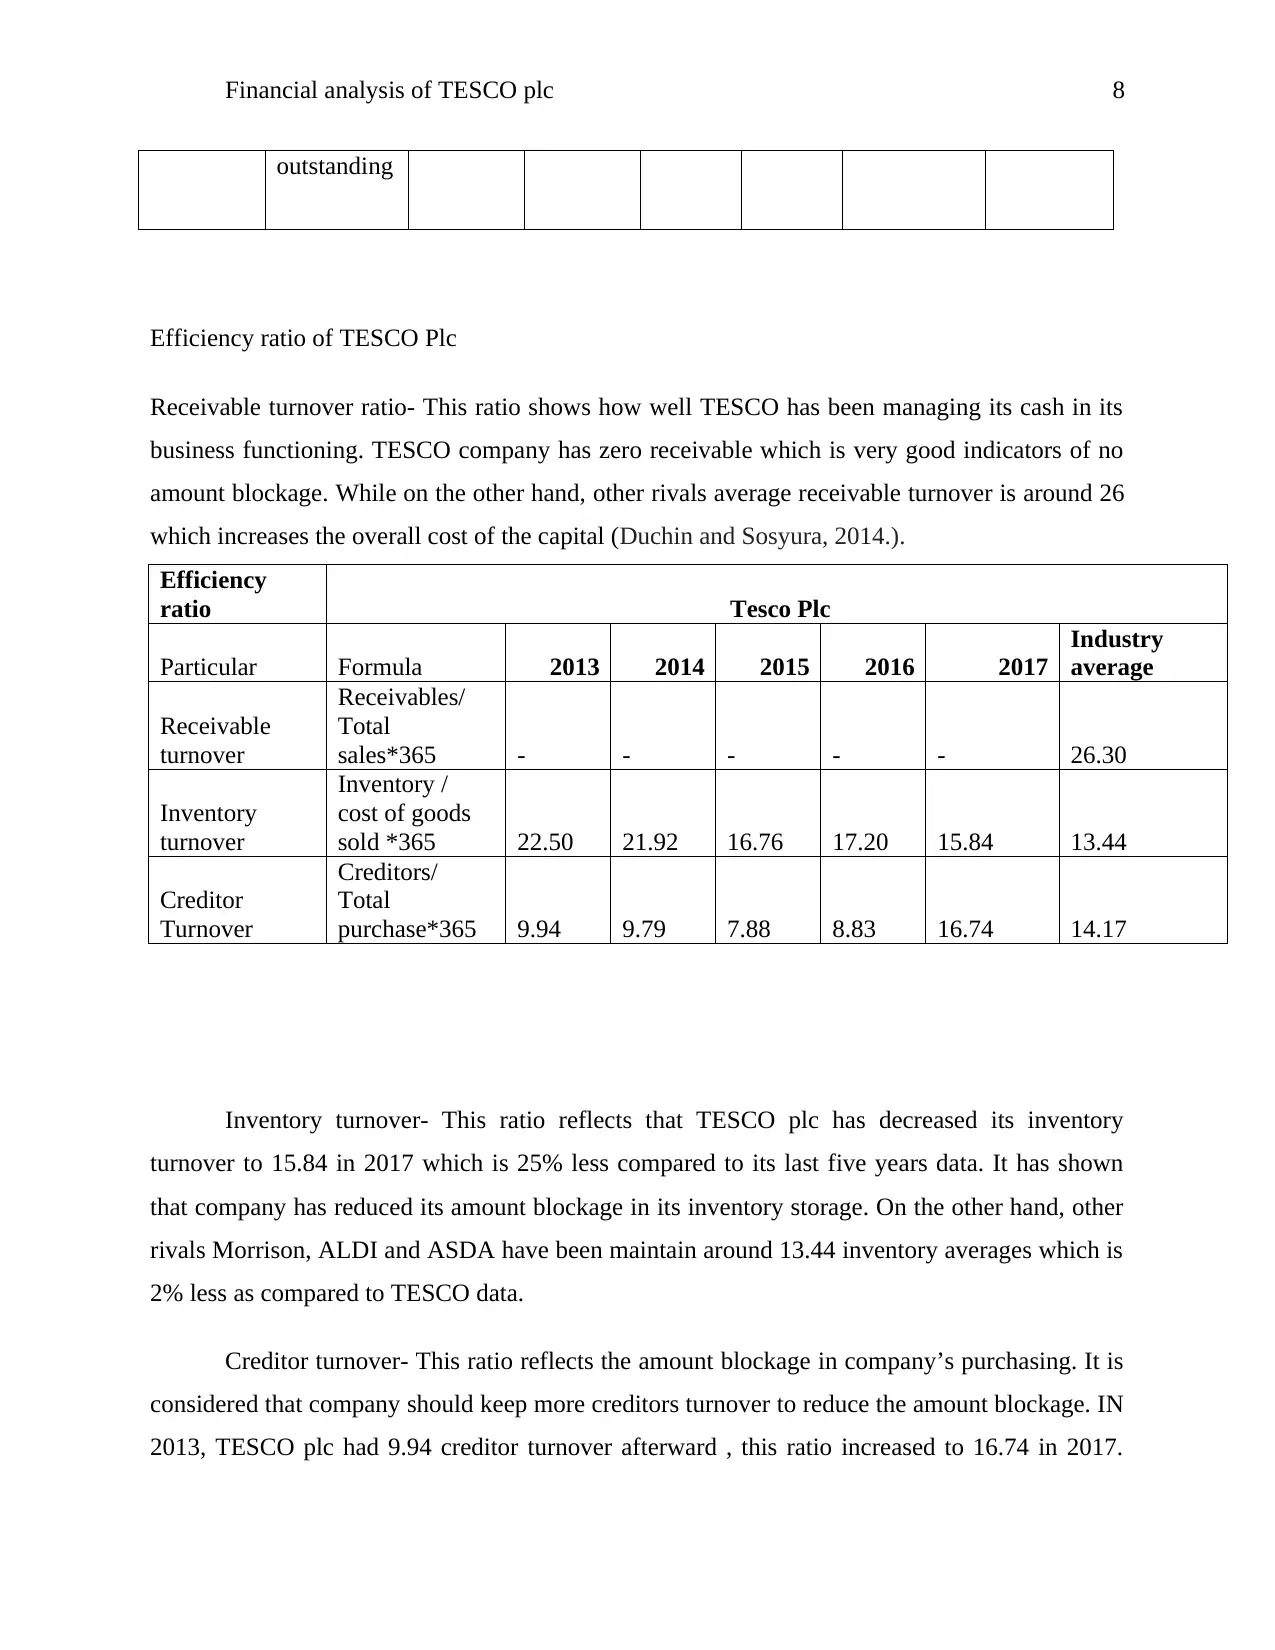
Efficiency ratio of TESCO Plc
Receivable turnover ratio- This ratio shows how well TESCO has been managing its cash in its
business functioning. TESCO company has zero receivable which is very good indicators of no
amount blockage. While on the other hand, other rivals average receivable turnover is around 26
which increases the overall cost of the capital (Duchin and Sosyura, 2014.).
Efficiency
ratio Tesco Plc
Particular Formula 2013 2014 2015 2016 2017
Industry
average
Receivable
turnover
Receivables/
Total
sales*365 - - - - - 26.30
Inventory
turnover
Inventory /
cost of goods
sold *365 22.50 21.92 16.76 17.20 15.84 13.44
Creditor
Turnover
Creditors/
Total
purchase*365 9.94 9.79 7.88 8.83 16.74 14.17
Inventory turnover- This ratio reflects that TESCO plc has decreased its inventory
turnover to 15.84 in 2017 which is 25% less compared to its last five years data. It has shown
that company has reduced its amount blockage in its inventory storage. On the other hand, other
rivals Morrison, ALDI and ASDA have been maintain around 13.44 inventory averages which is
2% less as compared to TESCO data.
Creditor turnover- This ratio reflects the amount blockage in company’s purchasing. It is
considered that company should keep more creditors turnover to reduce the amount blockage. IN
2013, TESCO plc had 9.94 creditor turnover afterward , this ratio increased to 16.74 in 2017.
outstanding
Efficiency ratio of TESCO Plc
Receivable turnover ratio- This ratio shows how well TESCO has been managing its cash in its
business functioning. TESCO company has zero receivable which is very good indicators of no
amount blockage. While on the other hand, other rivals average receivable turnover is around 26
which increases the overall cost of the capital (Duchin and Sosyura, 2014.).
Efficiency
ratio Tesco Plc
Particular Formula 2013 2014 2015 2016 2017
Industry
average
Receivable
turnover
Receivables/
Total
sales*365 - - - - - 26.30
Inventory
turnover
Inventory /
cost of goods
sold *365 22.50 21.92 16.76 17.20 15.84 13.44
Creditor
Turnover
Creditors/
Total
purchase*365 9.94 9.79 7.88 8.83 16.74 14.17
Inventory turnover- This ratio reflects that TESCO plc has decreased its inventory
turnover to 15.84 in 2017 which is 25% less compared to its last five years data. It has shown
that company has reduced its amount blockage in its inventory storage. On the other hand, other
rivals Morrison, ALDI and ASDA have been maintain around 13.44 inventory averages which is
2% less as compared to TESCO data.
Creditor turnover- This ratio reflects the amount blockage in company’s purchasing. It is
considered that company should keep more creditors turnover to reduce the amount blockage. IN
2013, TESCO plc had 9.94 creditor turnover afterward , this ratio increased to 16.74 in 2017.
Financial analysis of TESCO plc 9
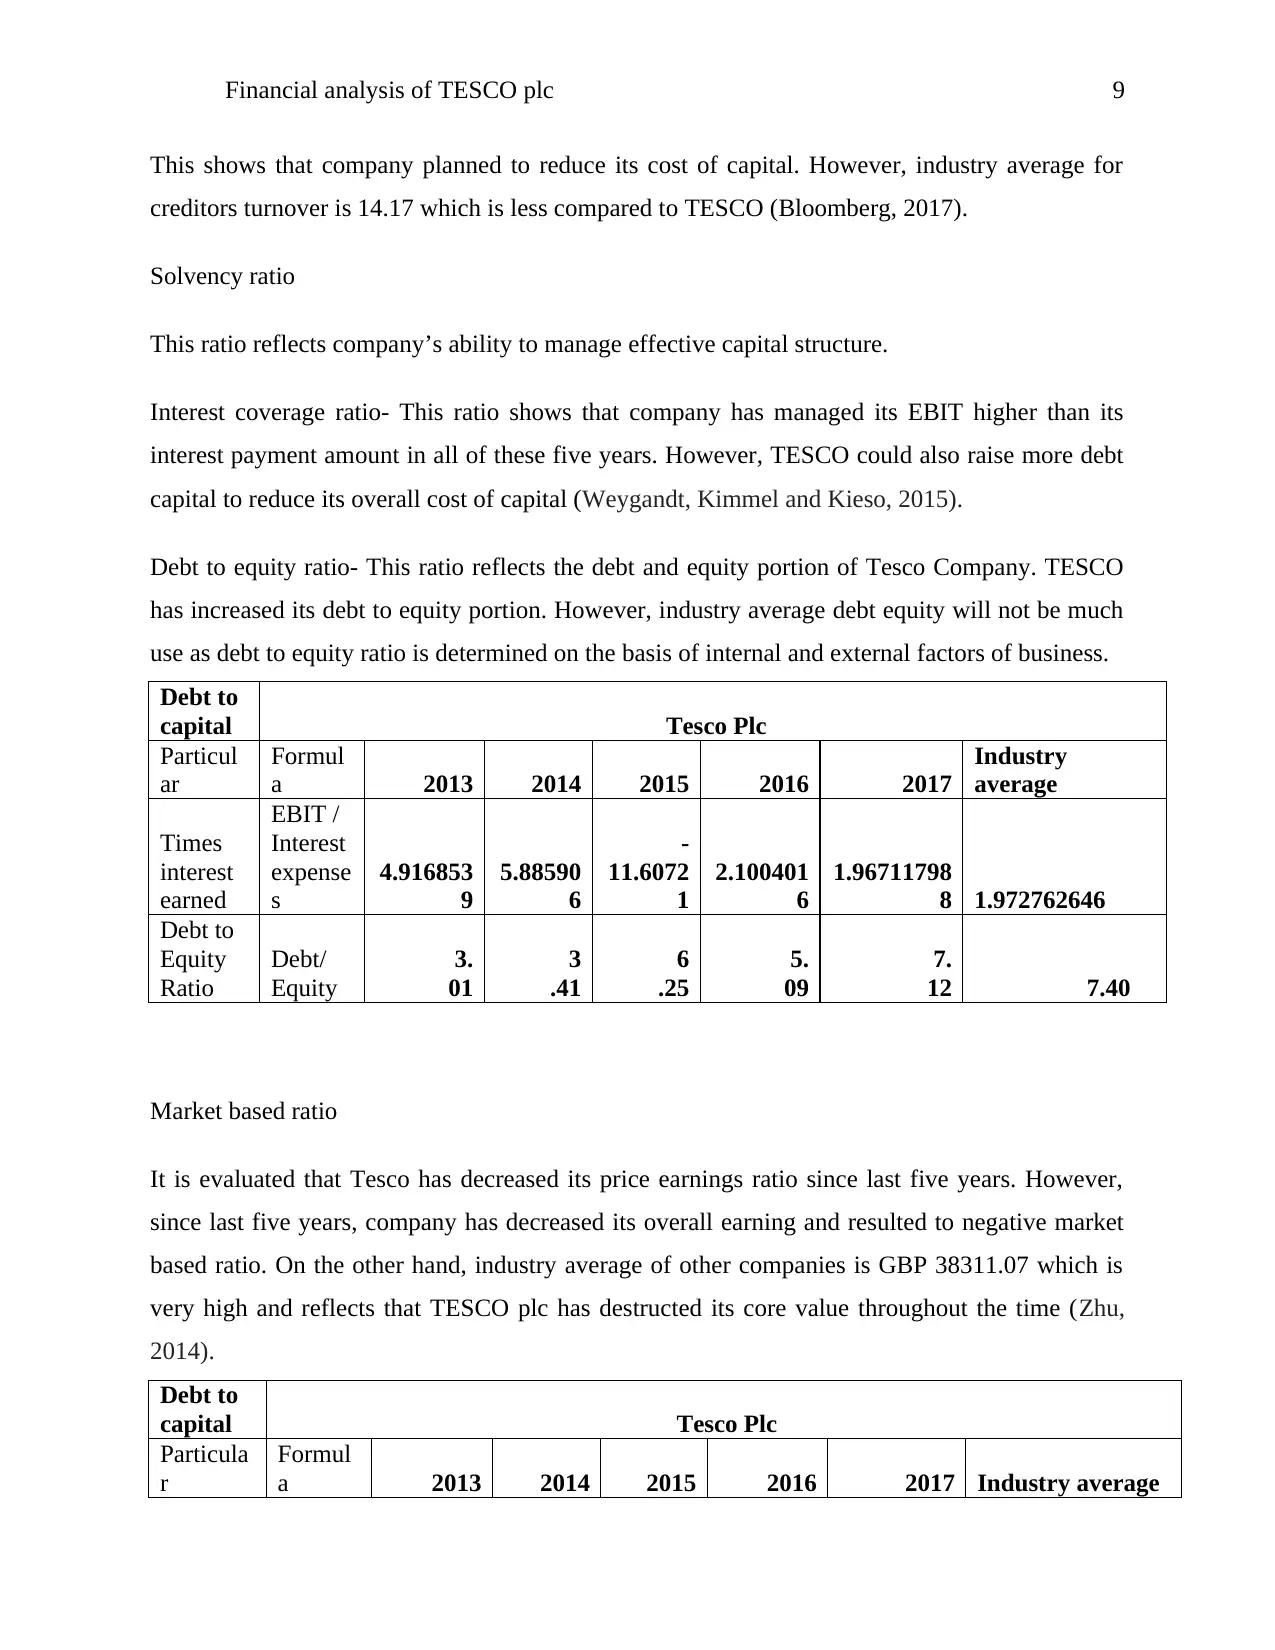
This shows that company planned to reduce its cost of capital. However, industry average for
creditors turnover is 14.17 which is less compared to TESCO (Bloomberg, 2017).
Solvency ratio
This ratio reflects company’s ability to manage effective capital structure.
Interest coverage ratio- This ratio shows that company has managed its EBIT higher than its
interest payment amount in all of these five years. However, TESCO could also raise more debt
capital to reduce its overall cost of capital (Weygandt, Kimmel and Kieso, 2015).
Debt to equity ratio- This ratio reflects the debt and equity portion of Tesco Company. TESCO
has increased its debt to equity portion. However, industry average debt equity will not be much
use as debt to equity ratio is determined on the basis of internal and external factors of business.
Debt to
capital Tesco Plc
Particul
ar
Formul
a 2013 2014 2015 2016 2017
Industry
average
Times
interest
earned
EBIT /
Interest
expense
s
4.916853
9
5.88590
6
-
11.6072
1
2.100401
6
1.96711798
8 1.972762646
Debt to
Equity
Ratio
Debt/
Equity
3.
01
3
.41
6
.25
5.
09
7.
12 7.40
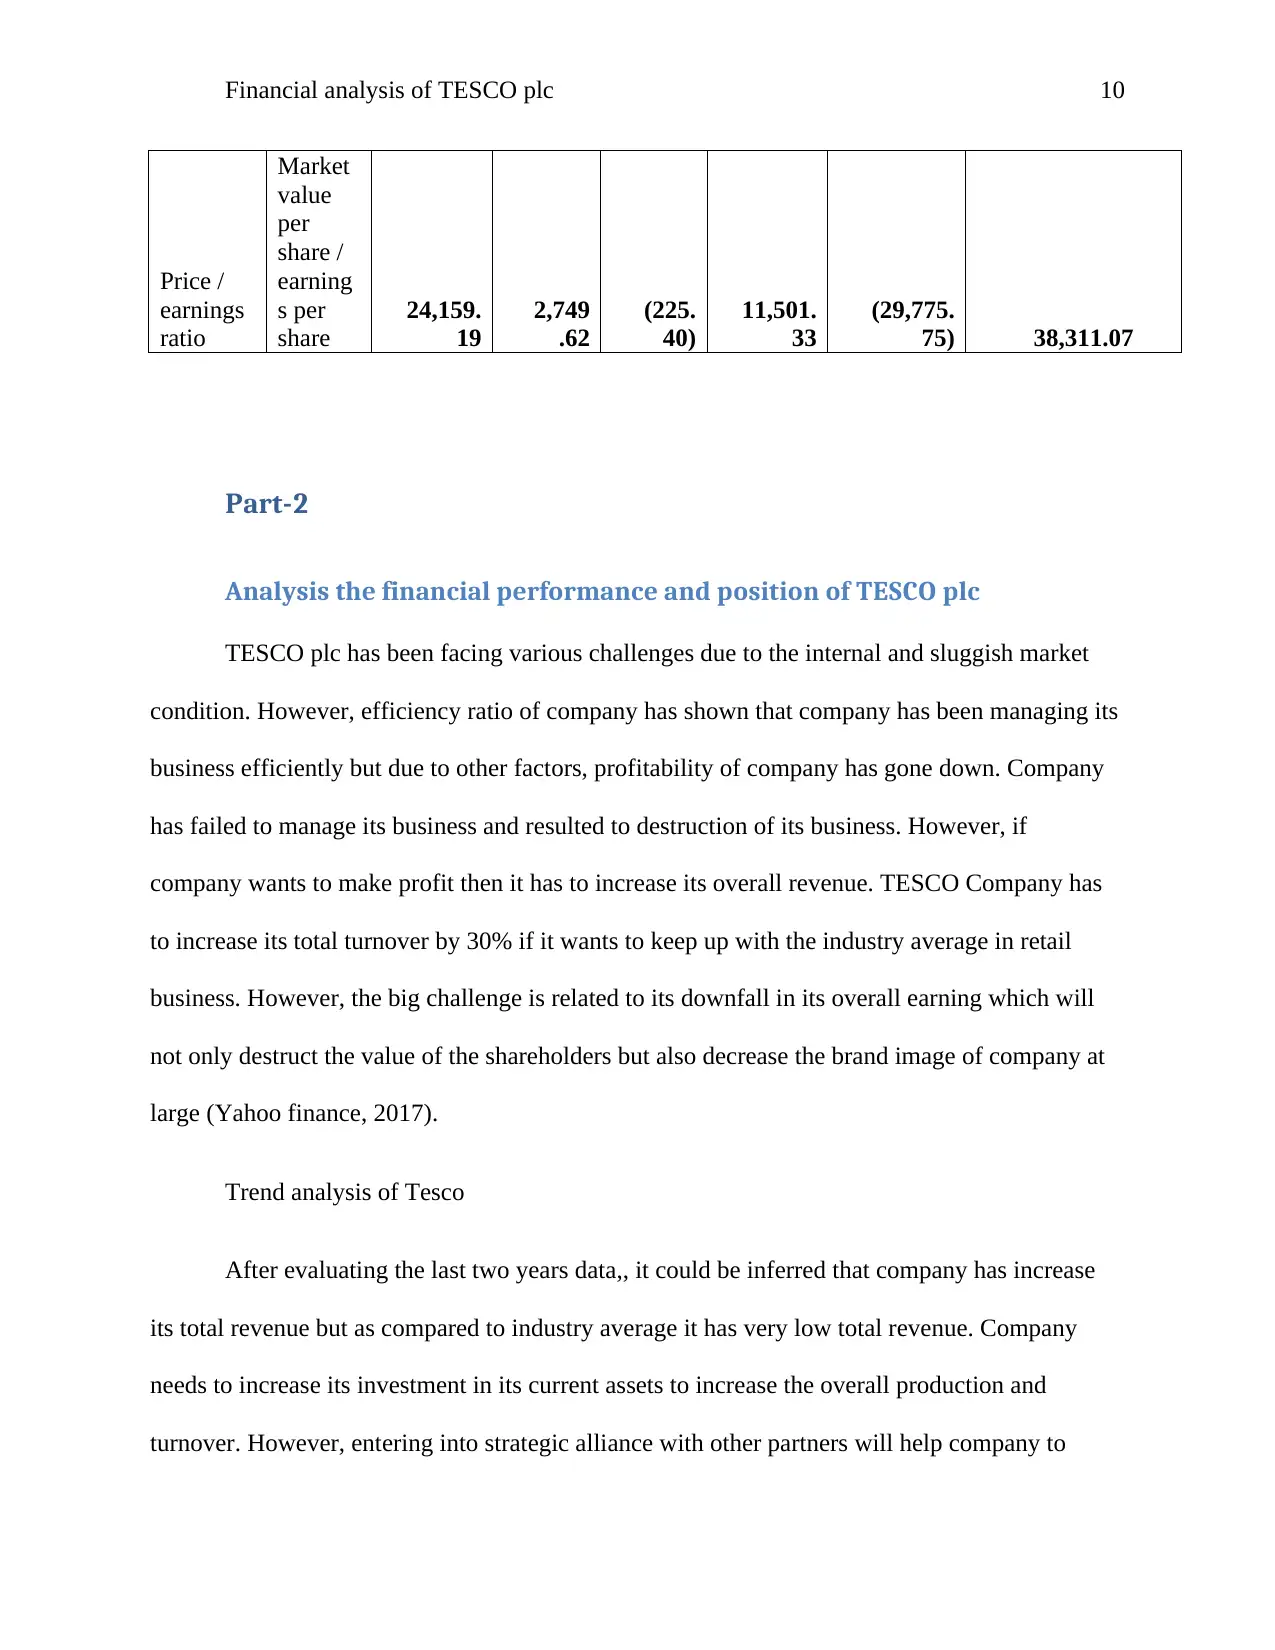
Market based ratio
It is evaluated that Tesco has decreased its price earnings ratio since last five years. However,
since last five years, company has decreased its overall earning and resulted to negative market
based ratio. On the other hand, industry average of other companies is GBP 38311.07 which is
very high and reflects that TESCO plc has destructed its core value throughout the time (Zhu,
2014).
Debt to
capital Tesco Plc
Particula
r
Formul
a 2013 2014 2015 2016 2017 Industry average
This shows that company planned to reduce its cost of capital. However, industry average for
creditors turnover is 14.17 which is less compared to TESCO (Bloomberg, 2017).
Solvency ratio
This ratio reflects company’s ability to manage effective capital structure.
Interest coverage ratio- This ratio shows that company has managed its EBIT higher than its
interest payment amount in all of these five years. However, TESCO could also raise more debt
capital to reduce its overall cost of capital (Weygandt, Kimmel and Kieso, 2015).
Debt to equity ratio- This ratio reflects the debt and equity portion of Tesco Company. TESCO
has increased its debt to equity portion. However, industry average debt equity will not be much
use as debt to equity ratio is determined on the basis of internal and external factors of business.
Debt to
capital Tesco Plc
Particul
ar
Formul
a 2013 2014 2015 2016 2017
Industry
average
Times
interest
earned
EBIT /
Interest
expense
s
4.916853
9
5.88590
6
-
11.6072
1
2.100401
6
1.96711798
8 1.972762646
Debt to
Equity
Ratio
Debt/
Equity
3.
01
3
.41
6
.25
5.
09
7.
12 7.40
Market based ratio
It is evaluated that Tesco has decreased its price earnings ratio since last five years. However,
since last five years, company has decreased its overall earning and resulted to negative market
based ratio. On the other hand, industry average of other companies is GBP 38311.07 which is
very high and reflects that TESCO plc has destructed its core value throughout the time (Zhu,
2014).
Debt to
capital Tesco Plc
Particula
r
Formul
a 2013 2014 2015 2016 2017 Industry average
⊘ This is a preview!⊘
Do you want full access?
Subscribe today to unlock all pages.
Trusted by 1+ million students worldwide
Financial analysis of TESCO plc 10
Price /
earnings
ratio
Market
value
per
share /
earning
s per
share
24,159.
19
2,749
.62
(225.
40)
11,501.
33
(29,775.
75) 38,311.07
Part-2
Analysis the financial performance and position of TESCO plc
TESCO plc has been facing various challenges due to the internal and sluggish market
condition. However, efficiency ratio of company has shown that company has been managing its
business efficiently but due to other factors, profitability of company has gone down. Company
has failed to manage its business and resulted to destruction of its business. However, if
company wants to make profit then it has to increase its overall revenue. TESCO Company has
to increase its total turnover by 30% if it wants to keep up with the industry average in retail
business. However, the big challenge is related to its downfall in its overall earning which will
not only destruct the value of the shareholders but also decrease the brand image of company at
large (Yahoo finance, 2017).
Trend analysis of Tesco
After evaluating the last two years data,, it could be inferred that company has increase
its total revenue but as compared to industry average it has very low total revenue. Company
needs to increase its investment in its current assets to increase the overall production and
turnover. However, entering into strategic alliance with other partners will help company to
Paraphrase This Document
Need a fresh take? Get an instant paraphrase of this document with our AI Paraphraser
Financial analysis of TESCO plc 11
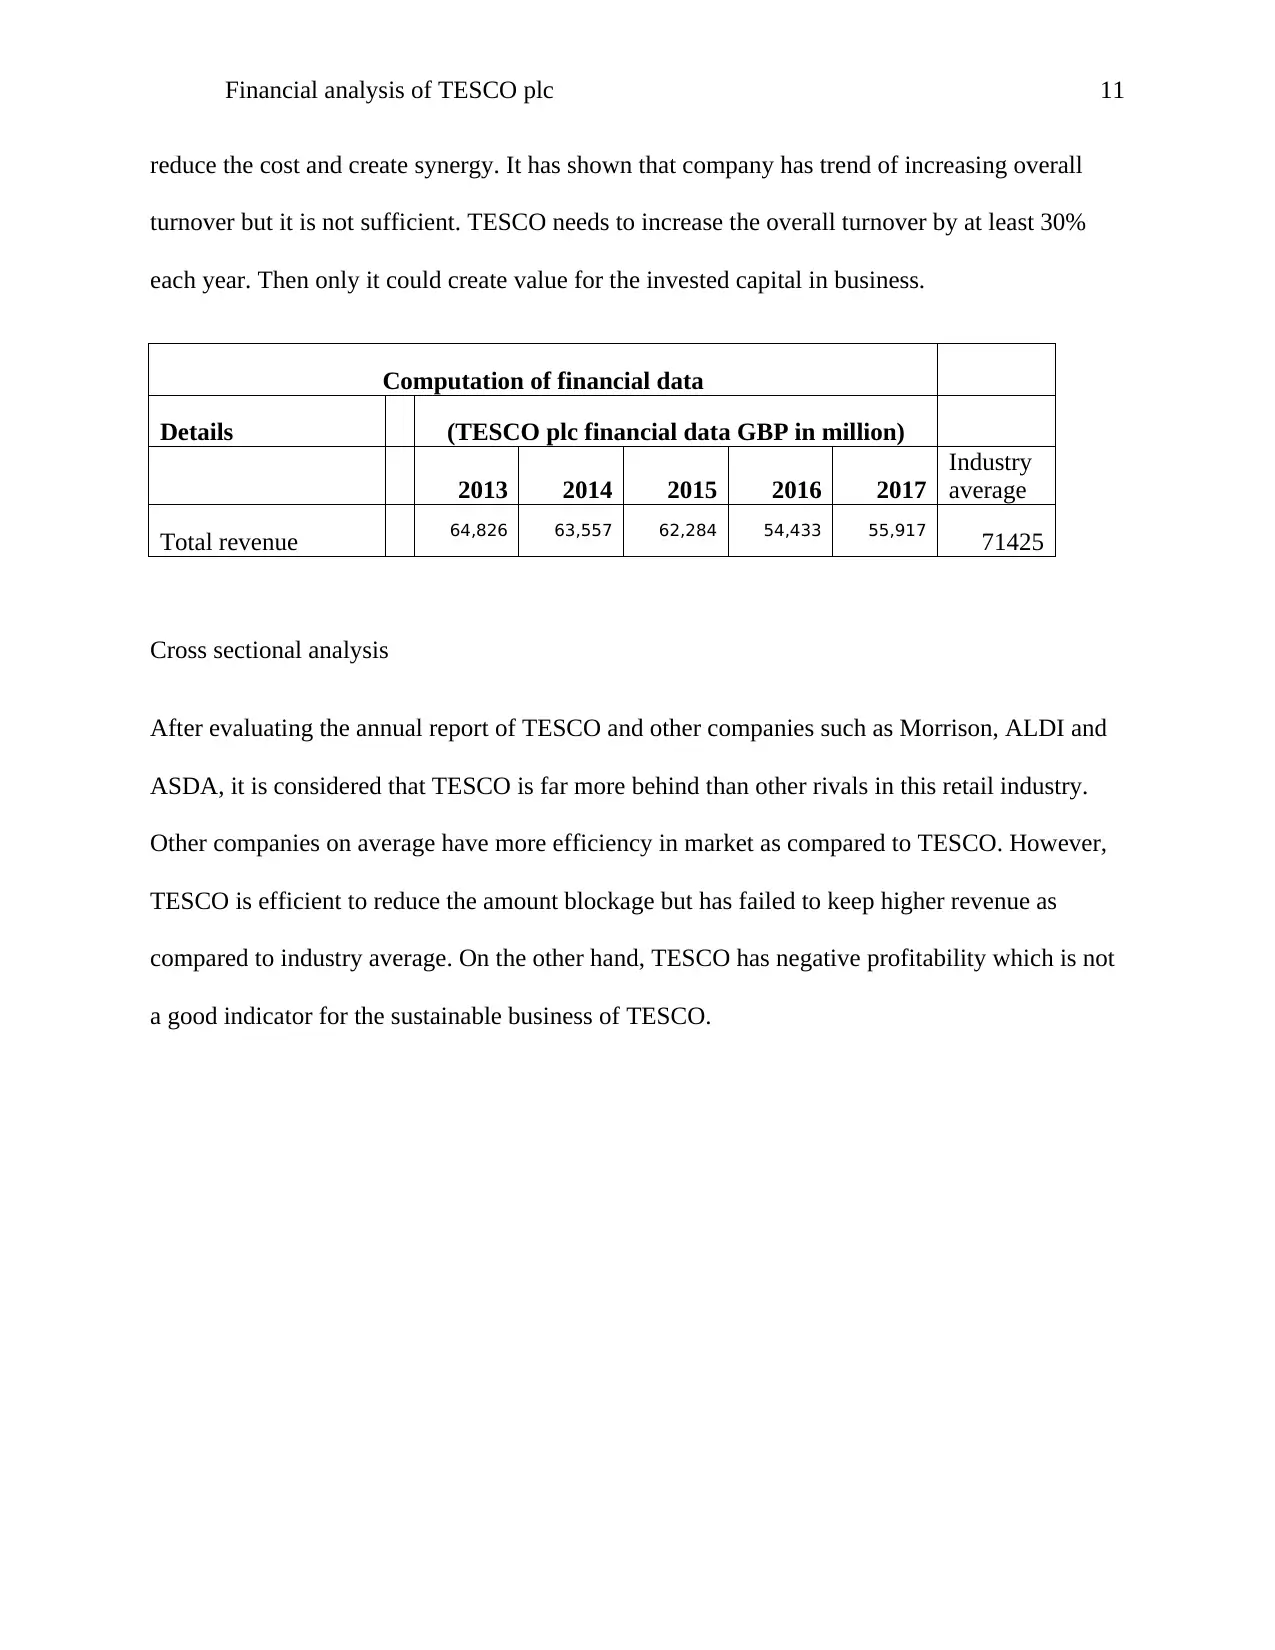
reduce the cost and create synergy. It has shown that company has trend of increasing overall
turnover but it is not sufficient. TESCO needs to increase the overall turnover by at least 30%
each year. Then only it could create value for the invested capital in business.
Computation of financial data
Details (TESCO plc financial data GBP in million)
2013 2014 2015 2016 2017
Industry
average
Total revenue 64,826 63,557 62,284 54,433 55,917 71425
Cross sectional analysis
After evaluating the annual report of TESCO and other companies such as Morrison, ALDI and
ASDA, it is considered that TESCO is far more behind than other rivals in this retail industry.
Other companies on average have more efficiency in market as compared to TESCO. However,
TESCO is efficient to reduce the amount blockage but has failed to keep higher revenue as
compared to industry average. On the other hand, TESCO has negative profitability which is not
a good indicator for the sustainable business of TESCO.
Financial analysis of TESCO plc 12
Part-3
This report has reflected that TESCO needs to increase its overall turnover and keep
profitable business if it wants to grow In this report, all the details and data have been collected
by using annual report of Tesco company and industry average have been taken from the
Bloomberg, Yahoo finance and Morningstar. These sites have provided all the reliable data
which have been gauged by comparing all the data with each other sites. Tesco Company has
followed International financial accounting standards and UK accounting rules for preparing and
reporting of its financial statement. This company has also complied with other accounting rules
and conventions with a view to harmonize its domestic and international reporting standards. The
main problem which arises while implementing financial analysis is related to collecting industry
average data. In this data, only three companies’ average data have been taken i.e. Morrison,
ALDI, ASDA which are good indictors for evaluating the financial performance of TESCO. This
company needs to make several improvements in its financial performance and first is related to
increasing its turnover and profitability at large (Bloomberg, 2017).
⊘ This is a preview!⊘
Do you want full access?
Subscribe today to unlock all pages.
Trusted by 1+ million students worldwide
1 out of 15
Related Documents


Your All-in-One AI-Powered Toolkit for Academic Success.
+13062052269
info@desklib.com
Available 24*7 on WhatsApp / Email
![[object Object]](/_next/static/media/star-bottom.7253800d.svg)
Unlock your academic potential
Copyright © 2020–2025 A2Z Services. All Rights Reserved. Developed and managed by ZUCOL.