Financial Analysis Sample Assignment
VerifiedAdded on 2021/06/15
|21
|3623
|80
AI Summary
Contribute Materials
Your contribution can guide someone’s learning journey. Share your
documents today.
Running Head: Valuation method and investment decision
0
Valuation method and investment decision
0
Valuation method and investment decision
Secure Best Marks with AI Grader
Need help grading? Try our AI Grader for instant feedback on your assignments.

Financial Analysis of the Companies 1
Executive Summary
With the increasing number of the companies in the market, investors have to analysis
financial performance risk factor and return offered by the companies to investors. Investor
needs to use different valuation methods such as ratio analysis, share price analysis, and
dividend discount model to value the shares of the companies. It is observed that Dividend
discount model and Price earnings are the main methods which are used by the investors to
determine the future sustainability and share price of company.
Financial Analysis of the Companies 2
Table of Contents
Executive Summary...............................................................................................................................1
Introduction...........................................................................................................................................3
Task 1....................................................................................................................................................4
Answer to question no-1........................................................................................................................4
Use of equity valuation method.........................................................................................................4
Computation of the Return on equity of the companies...............................................................4
Computation of the market price of Shares by using Dividend Discount Model...................................5
Computation of the Price earnings Ratio...............................................................................................7
Rank the ten investments in order of desirability..................................................................................8
Which investment of the ten would you select................................................................................10
Why the investment option selected................................................................................................10
Task-2..................................................................................................................................................10
Research and summaries some interesting facts about Warren Buffet.................................................10
Task 3..................................................................................................................................................13
Compare Warren Buffet’s approach to share valuation and the share valuation methodology............13
Share valuation Methodology..........................................................................................................14
Conclusion...........................................................................................................................................14
References...........................................................................................................................................15
Appendix.............................................................................................................................................19
Financial Analysis of the Companies 3
Introduction
Investors are the persons who invest capital in business. It is observed that investment
decision for investing capital in particular stocks depends upon the several factors such as
risk associated, beta, Stock return and opportunities available in market. In this report, 10
companies have been selected from the three different business sectors to identify which
value of stocks will offer good return as compared to others. After that in the end, Warren
Buffet valuation method is used to compare the share value and offered return available on
the invested capital. In the end, comparison between the valuation methods and Warren
Buffet logical share valuation method has been used.
Secure Best Marks with AI Grader
Need help grading? Try our AI Grader for instant feedback on your assignments.
Financial Analysis of the Companies 4
Task 1
Answer to question no-1
Use of equity valuation method
There are 10 listed companies that have been selected from the three different
industries.
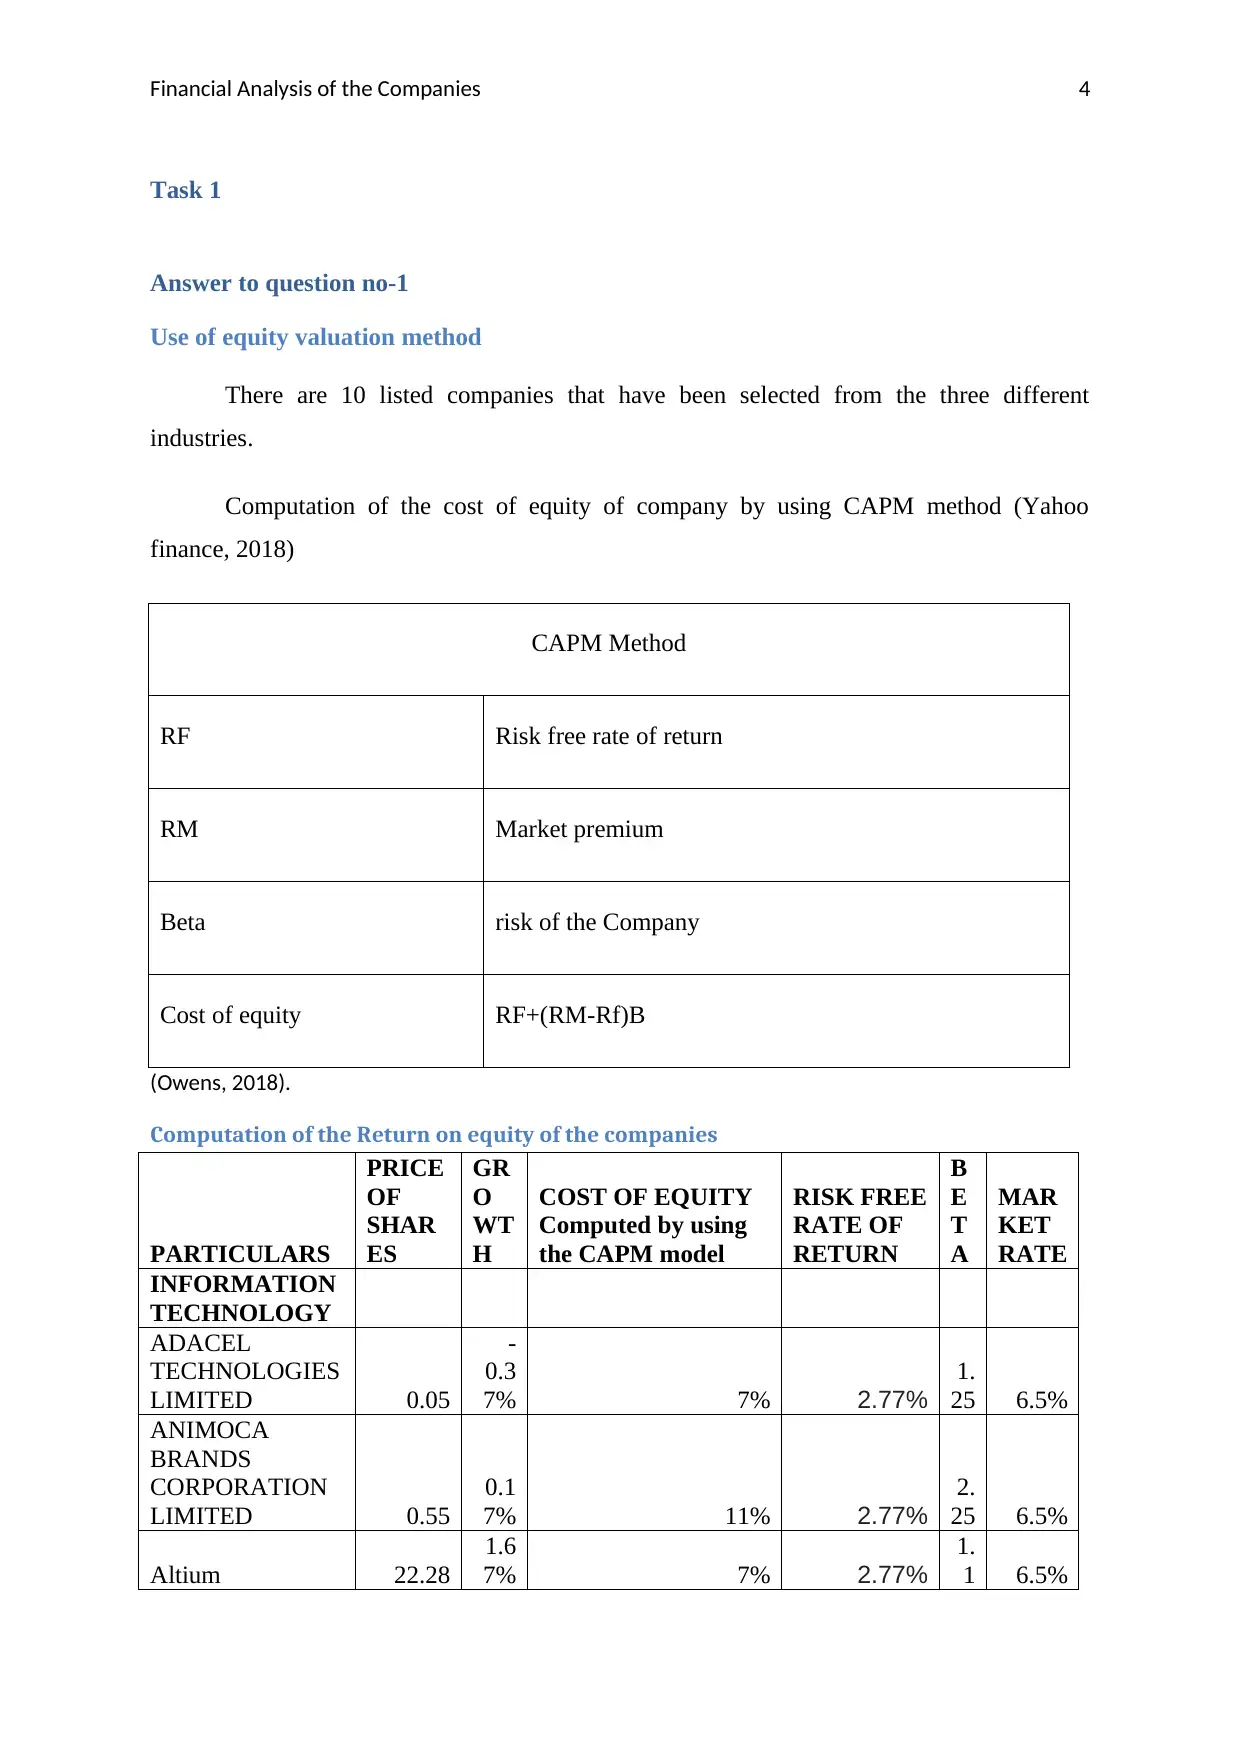
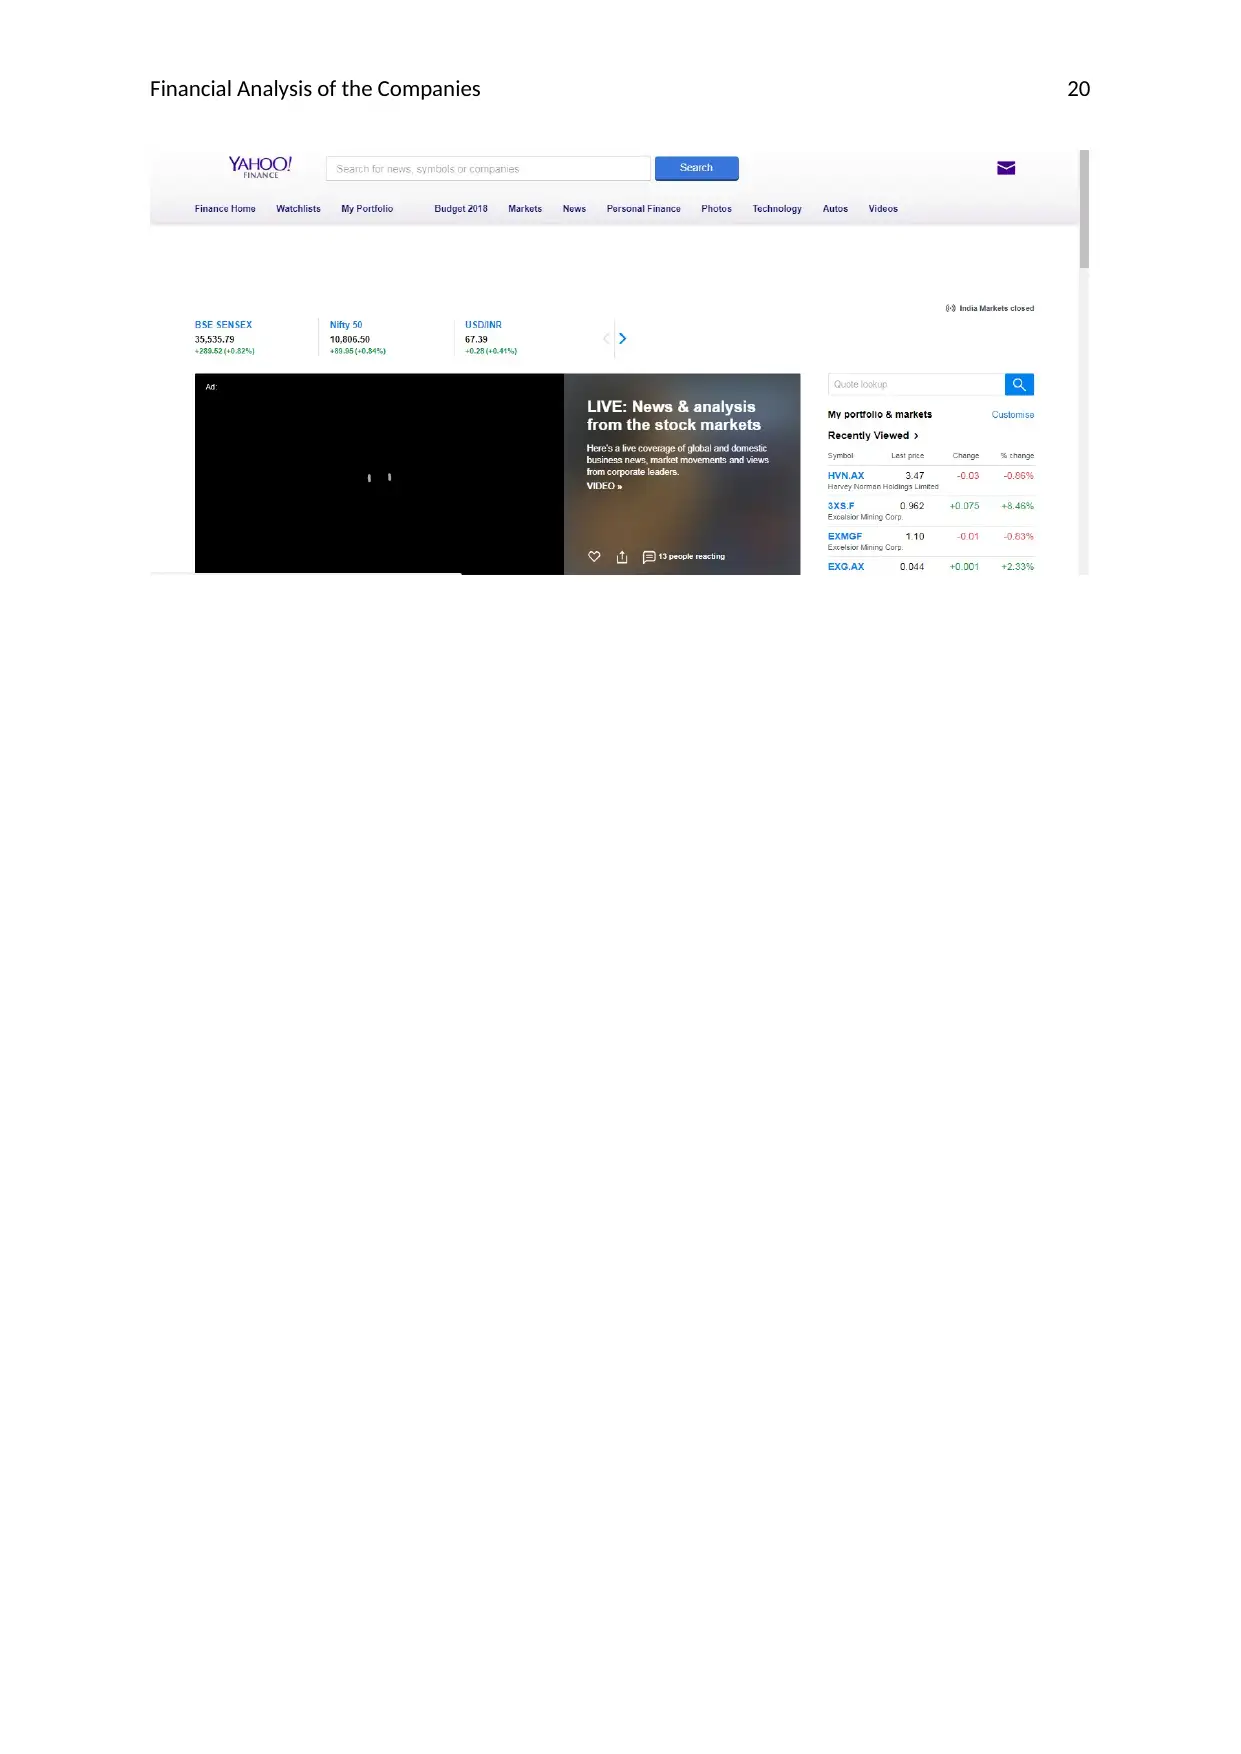
Computation of the cost of equity of company by using CAPM method (Yahoo
finance, 2018)
CAPM Method
RF Risk free rate of return
RM Market premium
Beta risk of the Company
Cost of equity RF+(RM-Rf)B
(Owens, 2018).
Computation of the Return on equity of the companies
PARTICULARS
PRICE
OF
SHAR
ES
GR
O
WT
H
COST OF EQUITY
Computed by using
the CAPM model
RISK FREE
RATE OF
RETURN
B
E
T
A
MAR
KET
RATE
INFORMATION
TECHNOLOGY
ADACEL
TECHNOLOGIES
LIMITED 0.05
-
0.3
7% 7% 2.77%
1.
25 6.5%
ANIMOCA
BRANDS
CORPORATION
LIMITED 0.55
0.1
7% 11% 2.77%
2.
25 6.5%
Altium 22.28
1.6
7% 7% 2.77%
1.
1 6.5%
Task 1
Answer to question no-1
Use of equity valuation method
There are 10 listed companies that have been selected from the three different
industries.
Computation of the cost of equity of company by using CAPM method (Yahoo
finance, 2018)
CAPM Method
RF Risk free rate of return
RM Market premium
Beta risk of the Company
Cost of equity RF+(RM-Rf)B
(Owens, 2018).
Computation of the Return on equity of the companies
PARTICULARS
PRICE
OF
SHAR
ES
GR
O
WT
H
COST OF EQUITY
Computed by using
the CAPM model
RISK FREE
RATE OF
RETURN
B
E
T
A
MAR
KET
RATE
INFORMATION
TECHNOLOGY
ADACEL
TECHNOLOGIES
LIMITED 0.05
-
0.3
7% 7% 2.77%
1.
25 6.5%
ANIMOCA
BRANDS
CORPORATION
LIMITED 0.55
0.1
7% 11% 2.77%
2.
25 6.5%
Altium 22.28
1.6
7% 7% 2.77%
1.
1 6.5%
Financial Analysis of the Companies 5
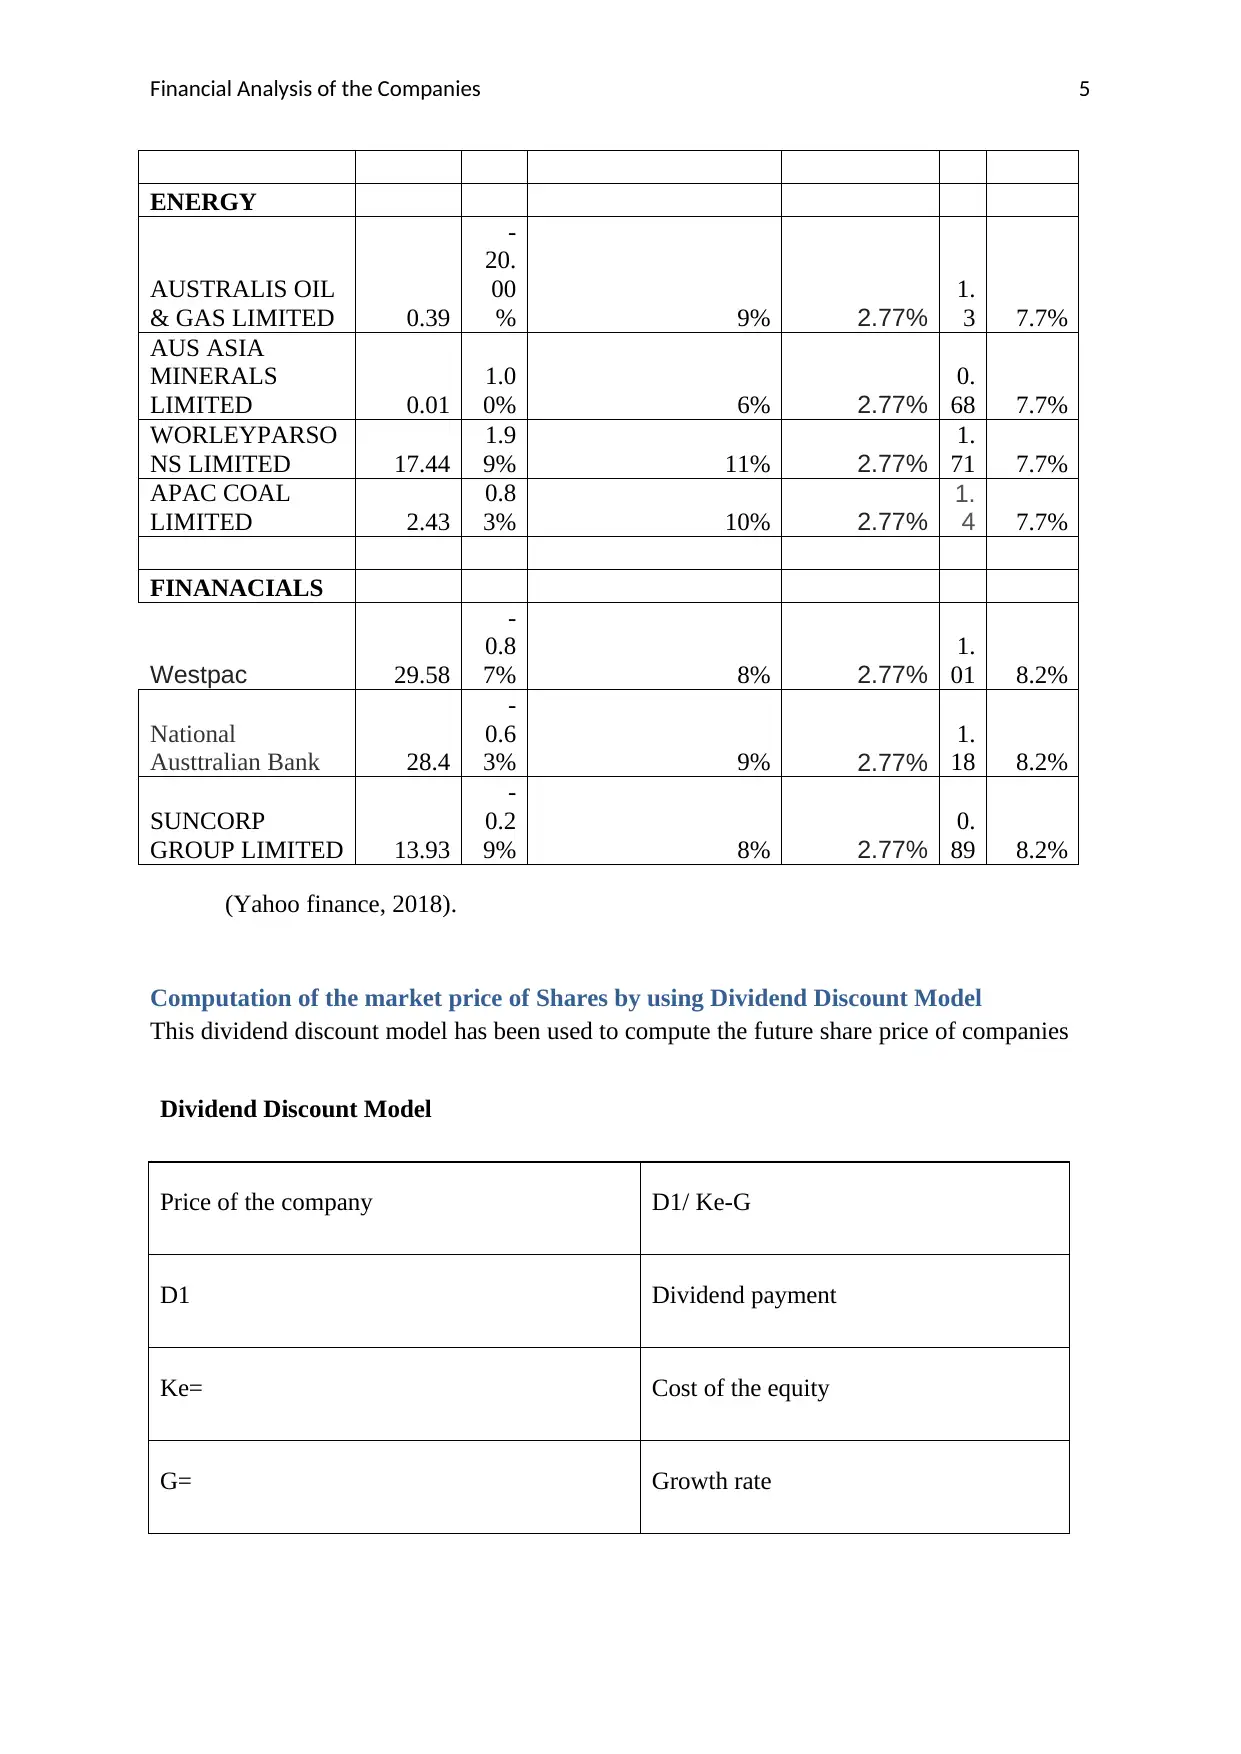
ENERGY
AUSTRALIS OIL
& GAS LIMITED 0.39
-
20.
00
% 9% 2.77%
1.
3 7.7%
AUS ASIA
MINERALS
LIMITED 0.01
1.0
0% 6% 2.77%
0.
68 7.7%
WORLEYPARSO
NS LIMITED 17.44
1.9
9% 11% 2.77%
1.
71 7.7%
APAC COAL
LIMITED 2.43
0.8
3% 10% 2.77%
1.
4 7.7%
FINANACIALS
Westpac 29.58
-
0.8
7% 8% 2.77%
1.
01 8.2%
National
Austtralian Bank 28.4
-
0.6
3% 9% 2.77%
1.
18 8.2%
SUNCORP
GROUP LIMITED 13.93
-
0.2
9% 8% 2.77%
0.
89 8.2%
(Yahoo finance, 2018).
Computation of the market price of Shares by using Dividend Discount Model
This dividend discount model has been used to compute the future share price of companies
Dividend Discount Model
Price of the company D1/ Ke-G
D1 Dividend payment
Ke= Cost of the equity
G= Growth rate
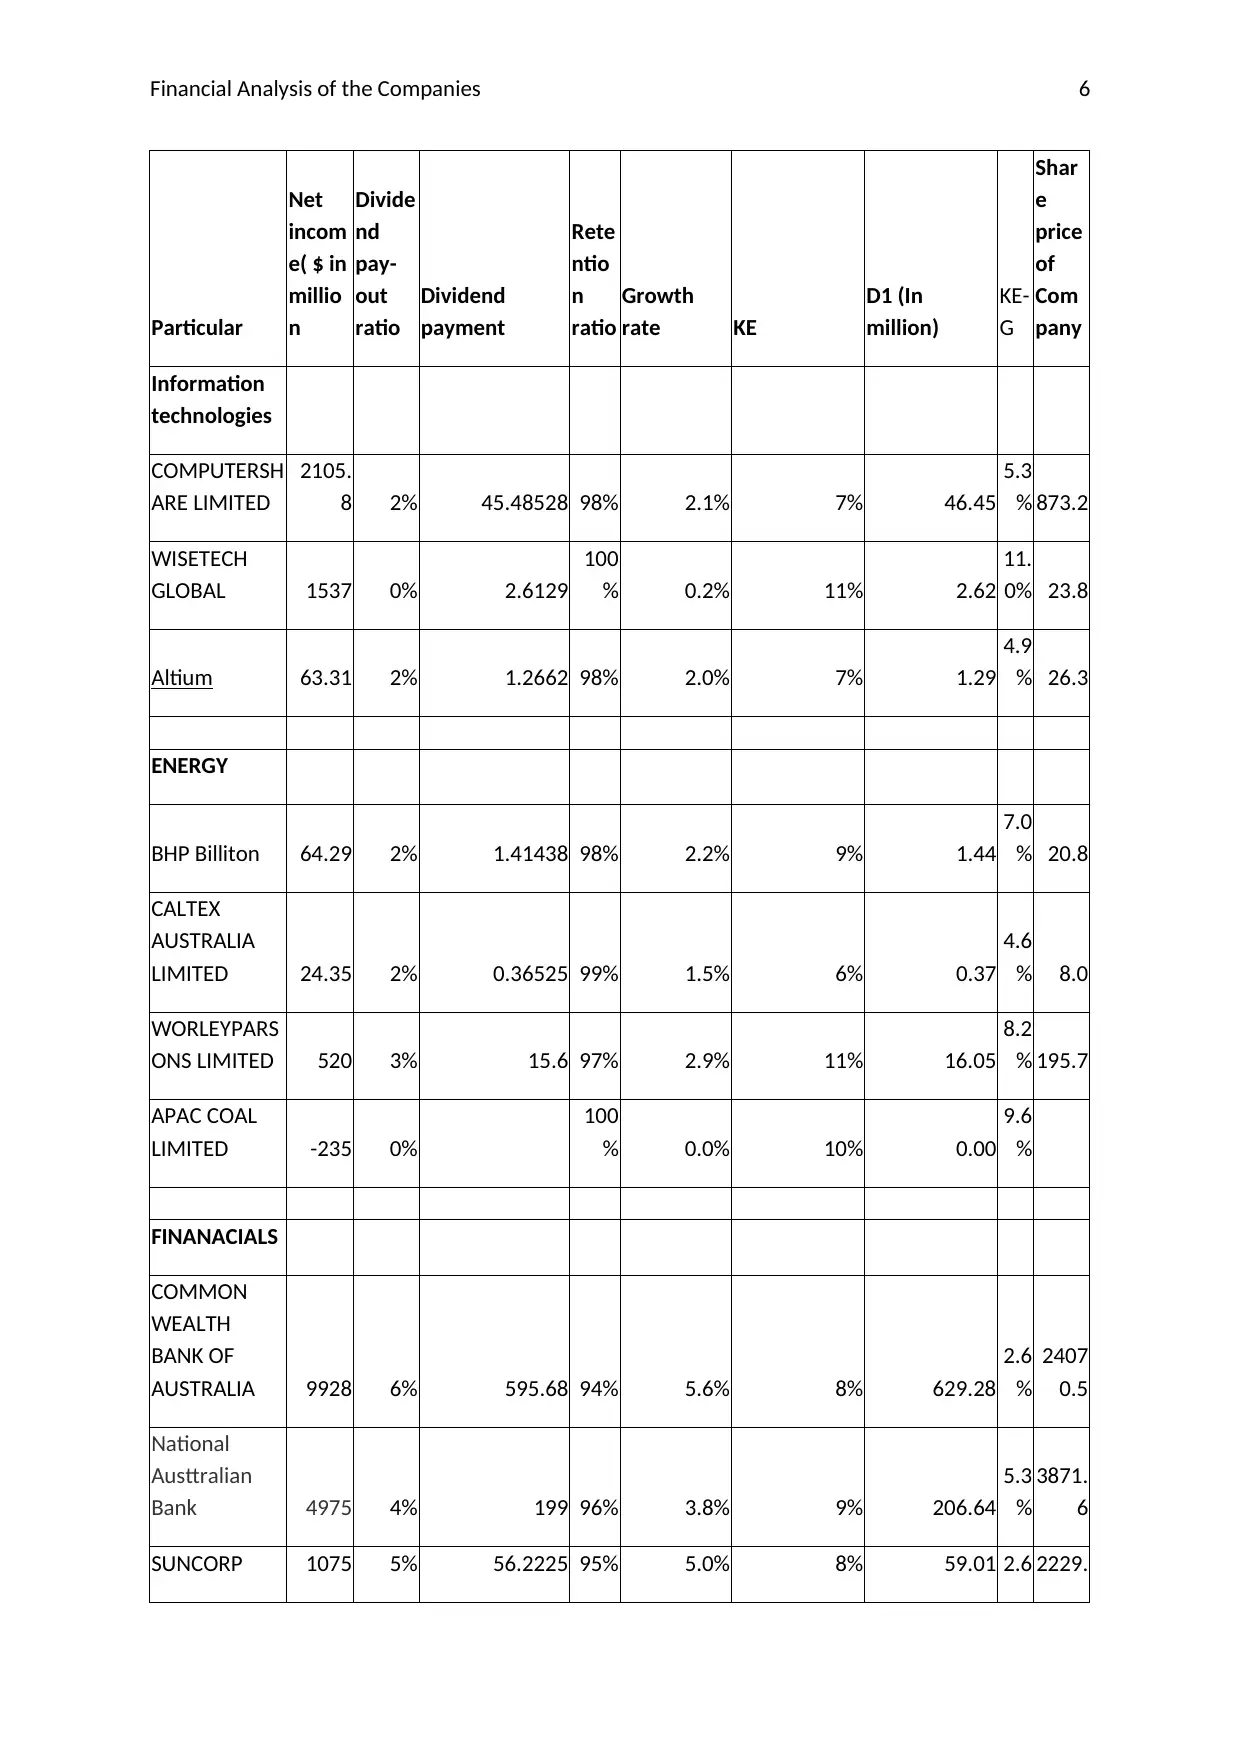
Financial Analysis of the Companies 6
Particular
Net
incom
e( $ in
millio
n
Divide
nd
pay-
out
ratio
Dividend
payment
Rete
ntio
n
ratio
Growth
rate KE
D1 (In
million)
KE-
G
Shar
e
price
of
Com
pany
Information
technologies
COMPUTERSH
ARE LIMITED
2105.
8 2% 45.48528 98% 2.1% 7% 46.45
5.3
% 873.2
WISETECH
GLOBAL 1537 0% 2.6129
100
% 0.2% 11% 2.62
11.
0% 23.8
Altium 63.31 2% 1.2662 98% 2.0% 7% 1.29
4.9
% 26.3
ENERGY
BHP Billiton 64.29 2% 1.41438 98% 2.2% 9% 1.44
7.0
% 20.8
CALTEX
AUSTRALIA
LIMITED 24.35 2% 0.36525 99% 1.5% 6% 0.37
4.6
% 8.0
WORLEYPARS
ONS LIMITED 520 3% 15.6 97% 2.9% 11% 16.05
8.2
% 195.7
APAC COAL
LIMITED -235 0%
100
% 0.0% 10% 0.00
9.6
%
FINANACIALS
COMMON
WEALTH
BANK OF
AUSTRALIA 9928 6% 595.68 94% 5.6% 8% 629.28
2.6
%
2407
0.5
National
Austtralian
Bank 4975 4% 199 96% 3.8% 9% 206.64
5.3
%
3871.
6
SUNCORP 1075 5% 56.2225 95% 5.0% 8% 59.01 2.6 2229.
Paraphrase This Document
Need a fresh take? Get an instant paraphrase of this document with our AI Paraphraser
Financial Analysis of the Companies 7
GROUP
LIMITED % 9
(ASX. 2018).
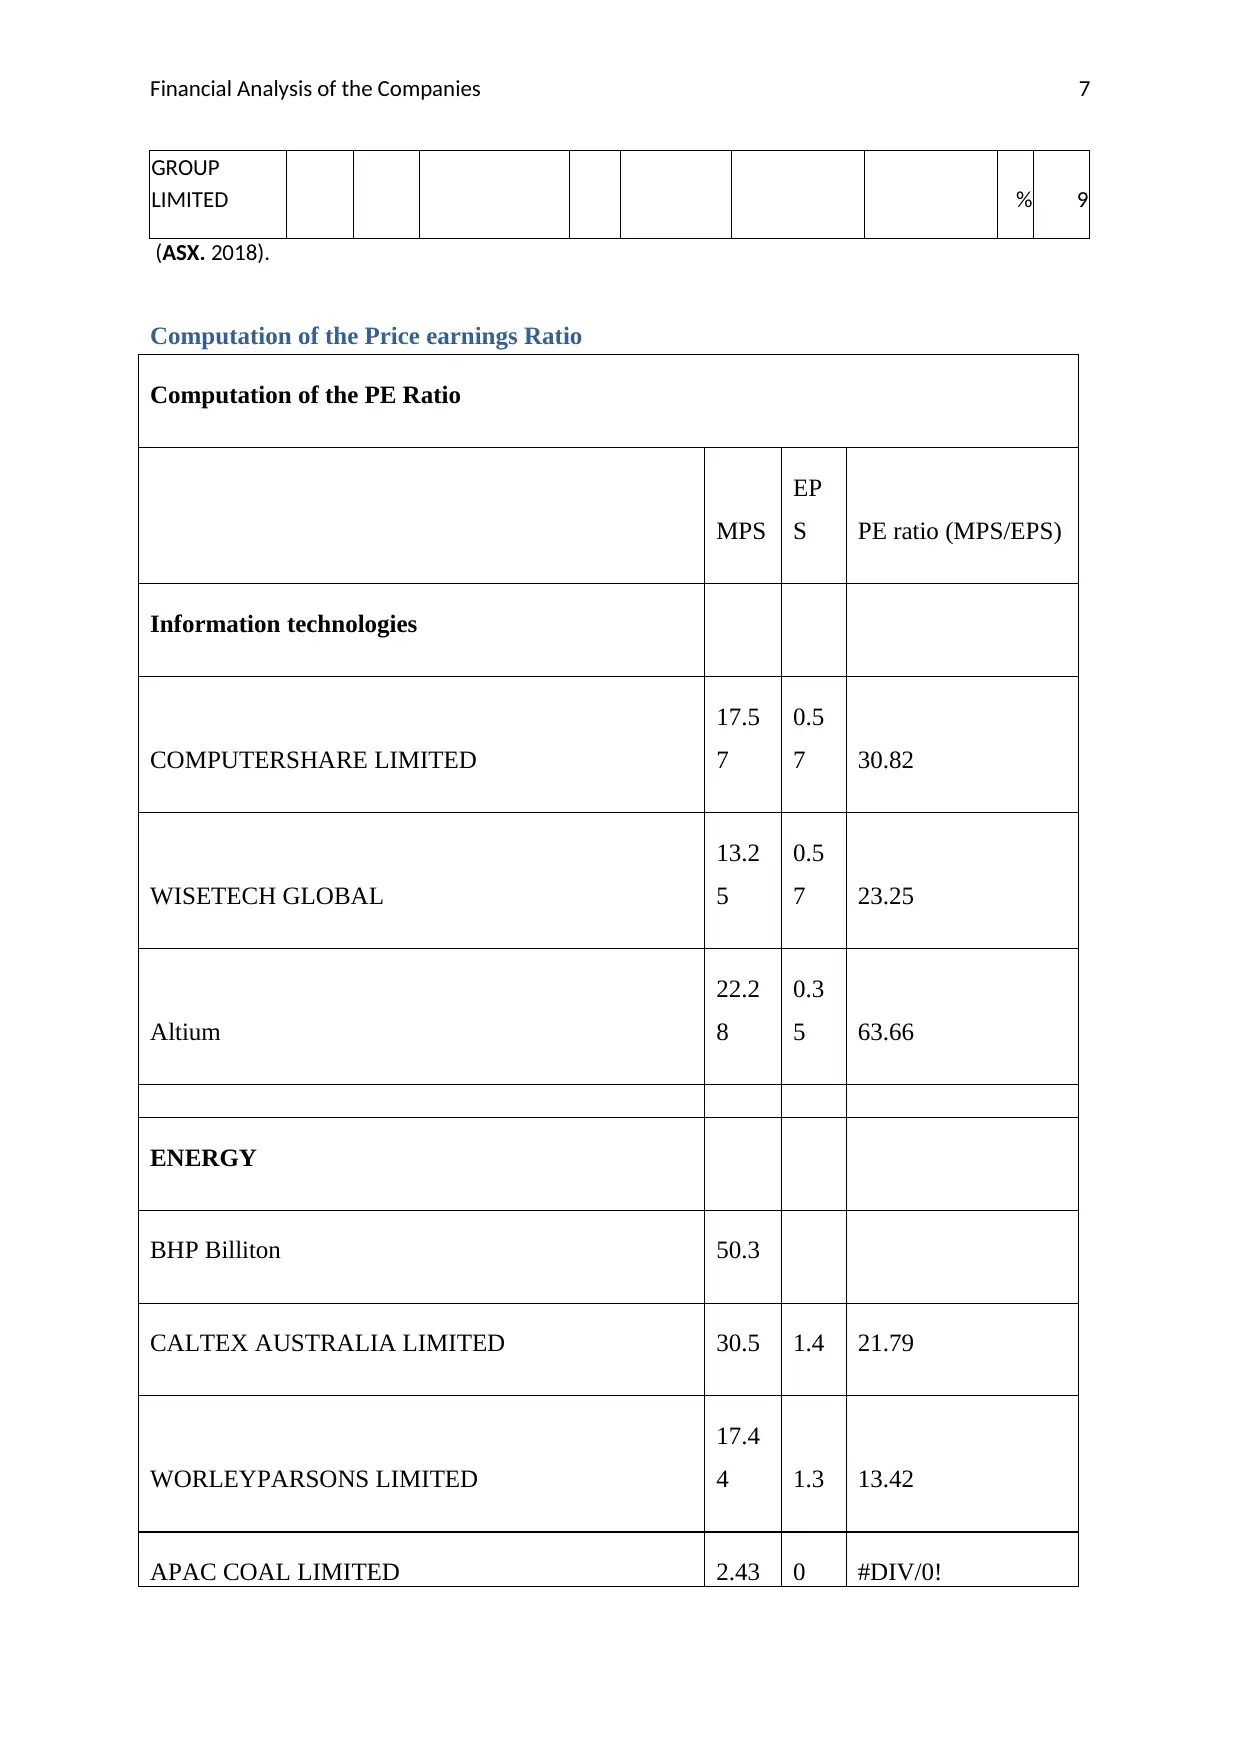
Computation of the Price earnings Ratio
Computation of the PE Ratio
MPS
EP
S PE ratio (MPS/EPS)
Information technologies
COMPUTERSHARE LIMITED
17.5
7
0.5
7 30.82
WISETECH GLOBAL
13.2
5
0.5
7 23.25
Altium
22.2
8
0.3
5 63.66
ENERGY
BHP Billiton 50.3
CALTEX AUSTRALIA LIMITED 30.5 1.4 21.79
WORLEYPARSONS LIMITED
17.4
4 1.3 13.42
APAC COAL LIMITED 2.43 0 #DIV/0!
GROUP
LIMITED % 9
(ASX. 2018).
Computation of the Price earnings Ratio
Computation of the PE Ratio
MPS
EP
S PE ratio (MPS/EPS)
Information technologies
COMPUTERSHARE LIMITED
17.5
7
0.5
7 30.82
WISETECH GLOBAL
13.2
5
0.5
7 23.25
Altium
22.2
8
0.3
5 63.66
ENERGY
BHP Billiton 50.3
CALTEX AUSTRALIA LIMITED 30.5 1.4 21.79
WORLEYPARSONS LIMITED
17.4
4 1.3 13.42
APAC COAL LIMITED 2.43 0 #DIV/0!
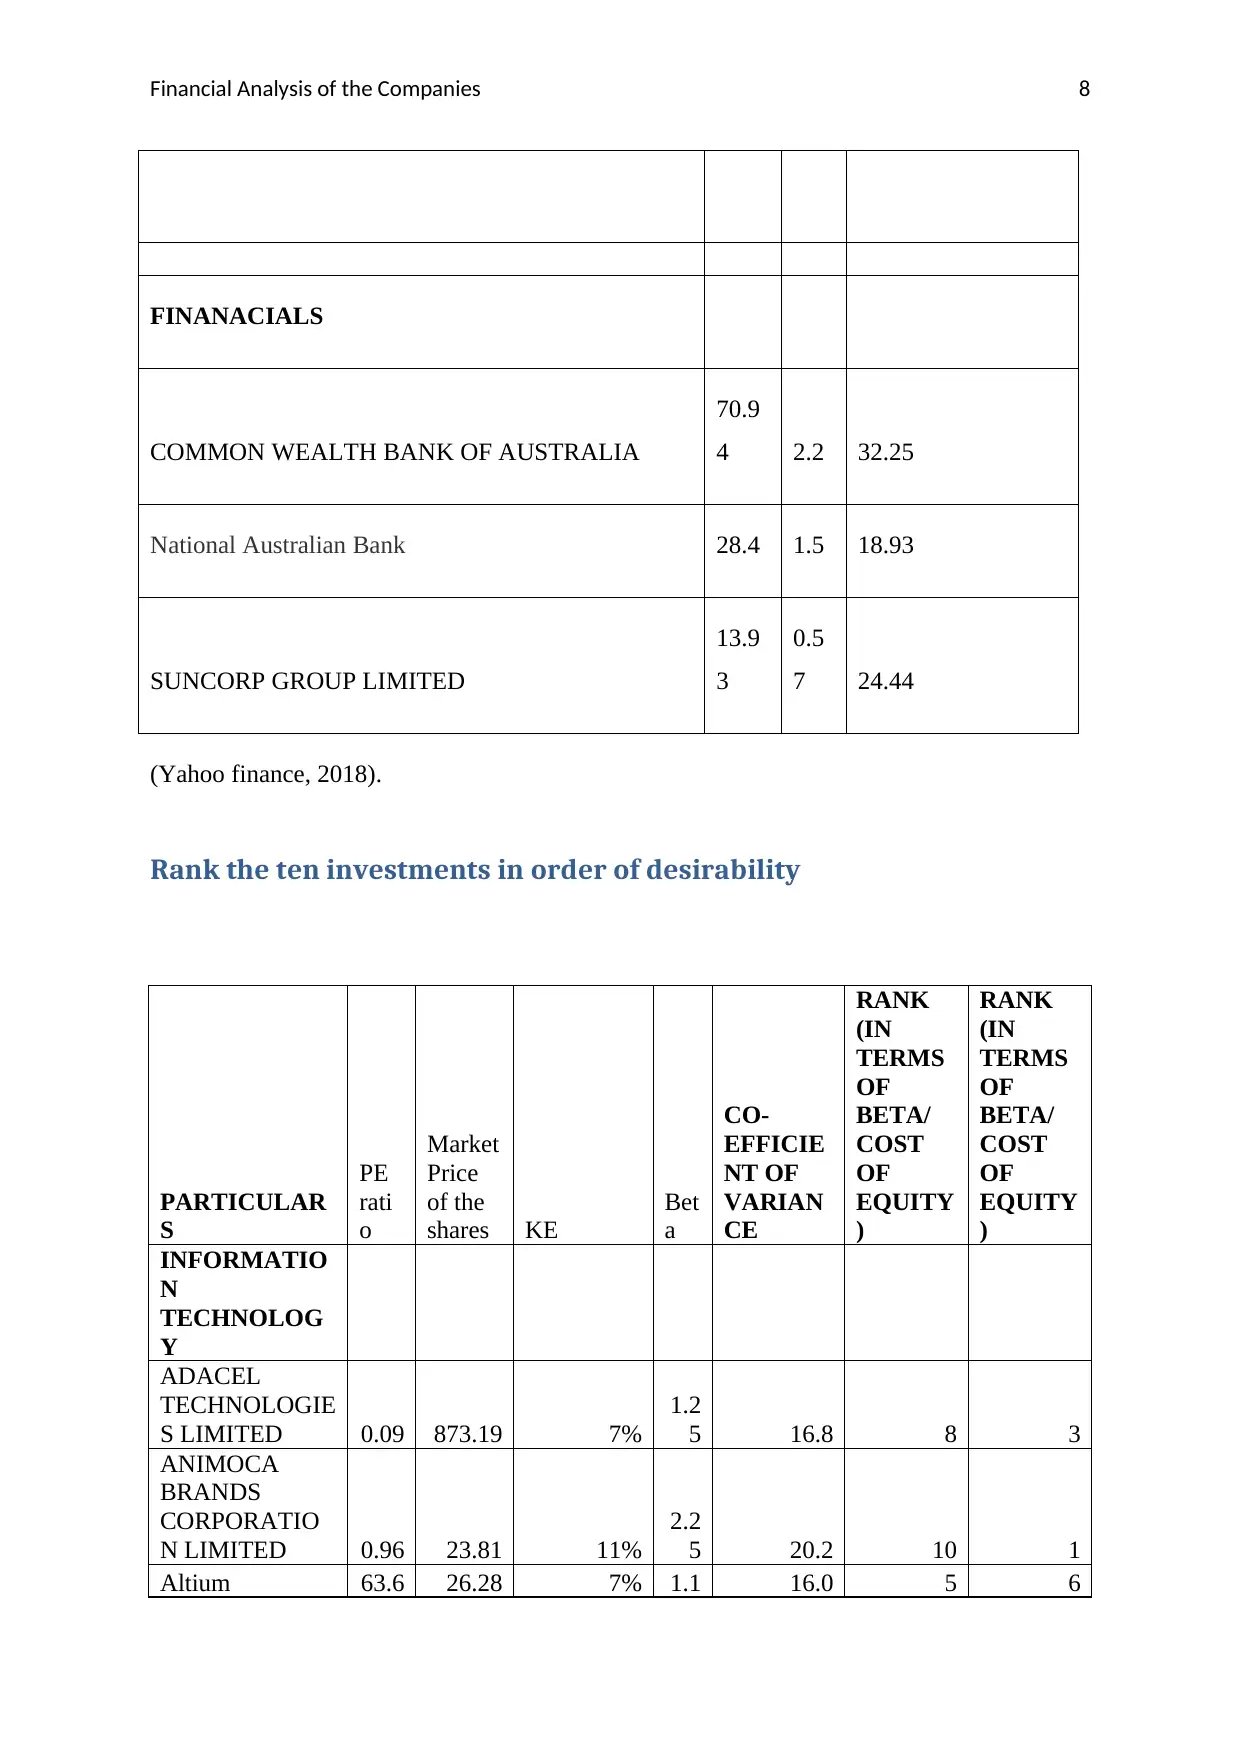
Financial Analysis of the Companies 8
FINANACIALS
COMMON WEALTH BANK OF AUSTRALIA
70.9
4 2.2 32.25
National Australian Bank 28.4 1.5 18.93
SUNCORP GROUP LIMITED
13.9
3
0.5
7 24.44
(Yahoo finance, 2018).
Rank the ten investments in order of desirability
PARTICULAR
S
PE
rati
o
Market
Price
of the
shares KE
Bet
a
CO-
EFFICIE
NT OF
VARIAN
CE
RANK
(IN
TERMS
OF
BETA/
COST
OF
EQUITY
)
RANK
(IN
TERMS
OF
BETA/
COST
OF
EQUITY
)
INFORMATIO
N
TECHNOLOG
Y
ADACEL
TECHNOLOGIE
S LIMITED 0.09 873.19 7%
1.2
5 16.8 8 3
ANIMOCA
BRANDS
CORPORATIO
N LIMITED 0.96 23.81 11%
2.2
5 20.2 10 1
Altium 63.6 26.28 7% 1.1 16.0 5 6
Financial Analysis of the Companies 9
6
ENERGY 20.75 9% 1.3 14.3 6 5
AUSTRALIS
OIL & GAS
LIMITED 0.01 8.04 6%
0.6
8 11.2 1 8
AUS ASIA
MINERALS
LIMITED
13.4
2 195.67 11%
1.7
1 15.4 7 4
WORLEYPARS
ONS LIMITED 10% 1.4 14.6 9 2
APAC COAL
LIMITED
FINANACIALS
Westpac
13.4
5
24070.
55 8%
1.0
1 12.2 3 9
National
Australian Bank
18.9
3
3871.5
8 9%
1.1
8 12.9 4 7
SUNCORP
GROUP
LIMITED
24.4
4
2229.9
3 8%
0.8
9 11.7 2 10
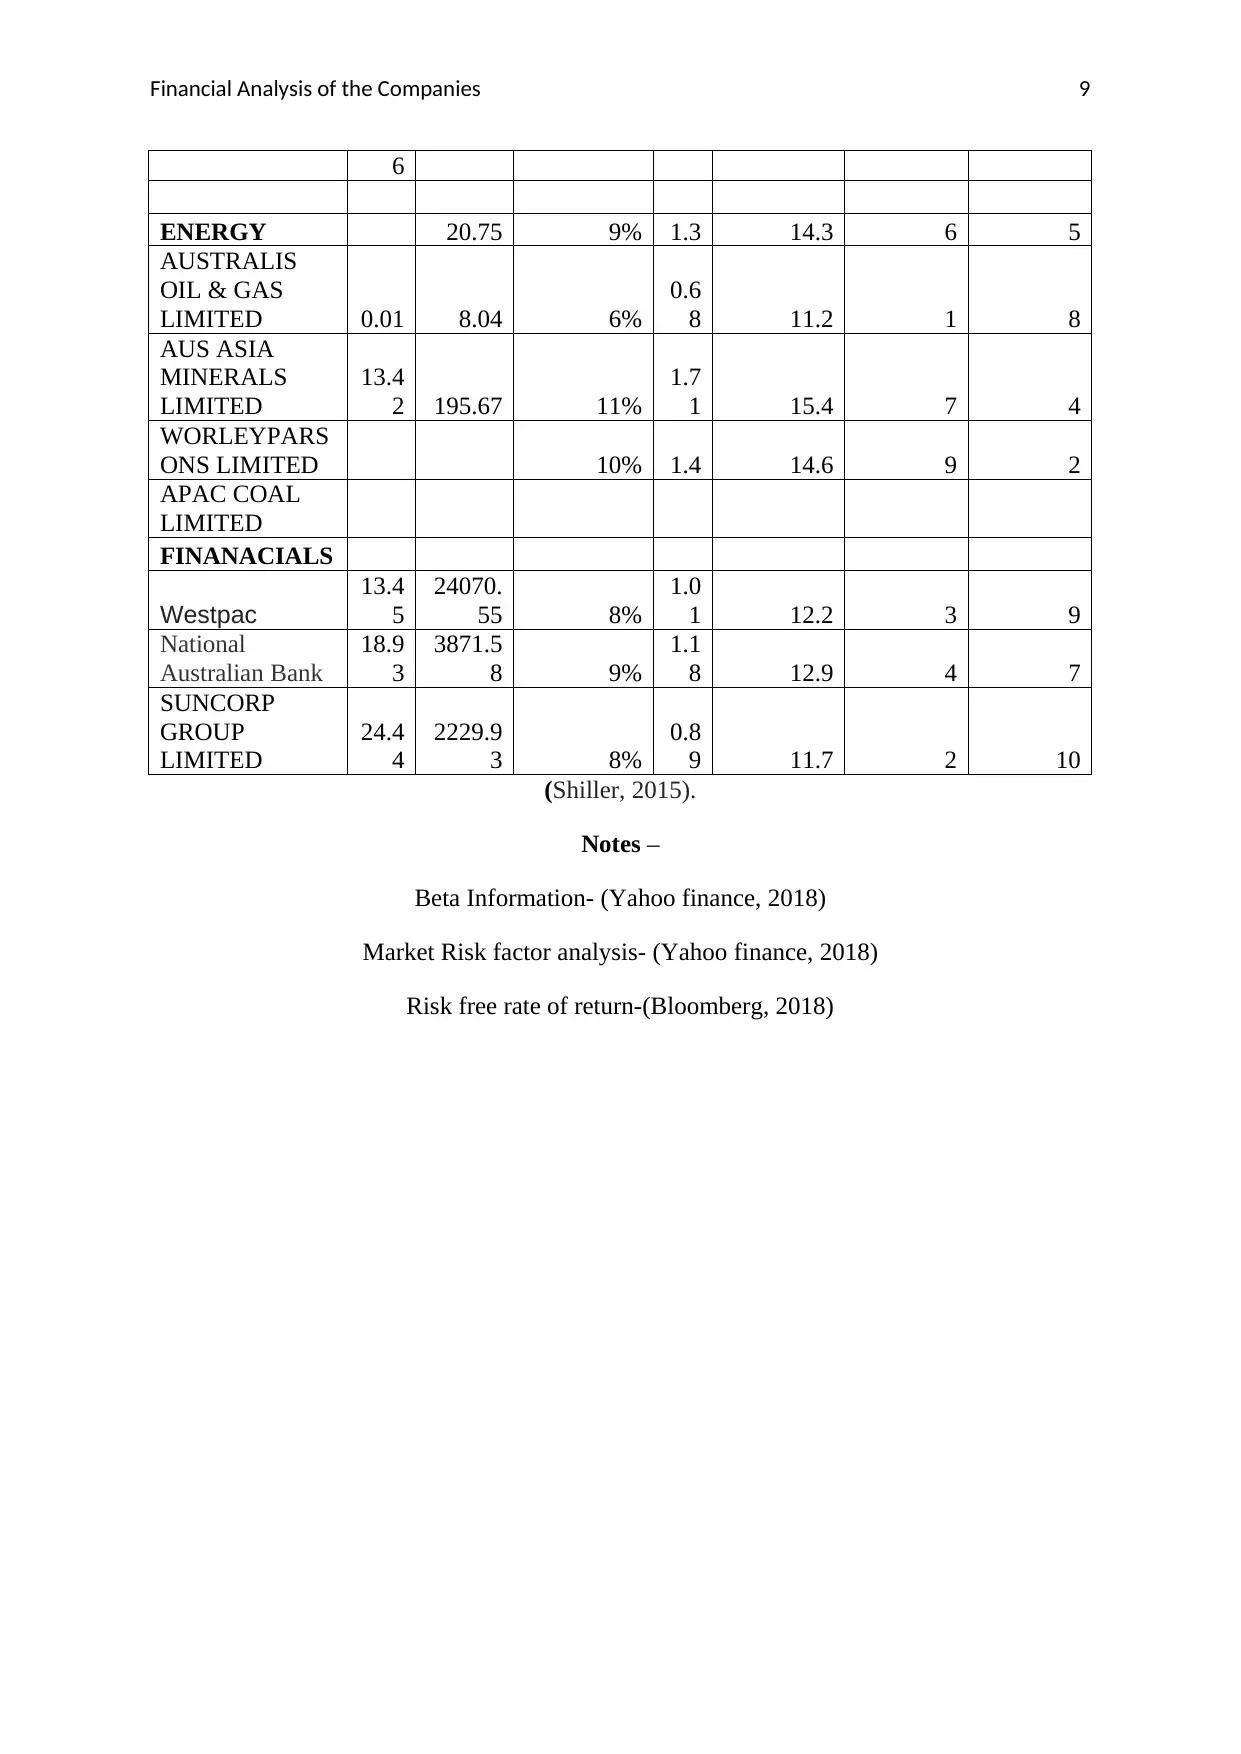
(Shiller, 2015).
Notes –
Beta Information- (Yahoo finance, 2018)
Market Risk factor analysis- (Yahoo finance, 2018)
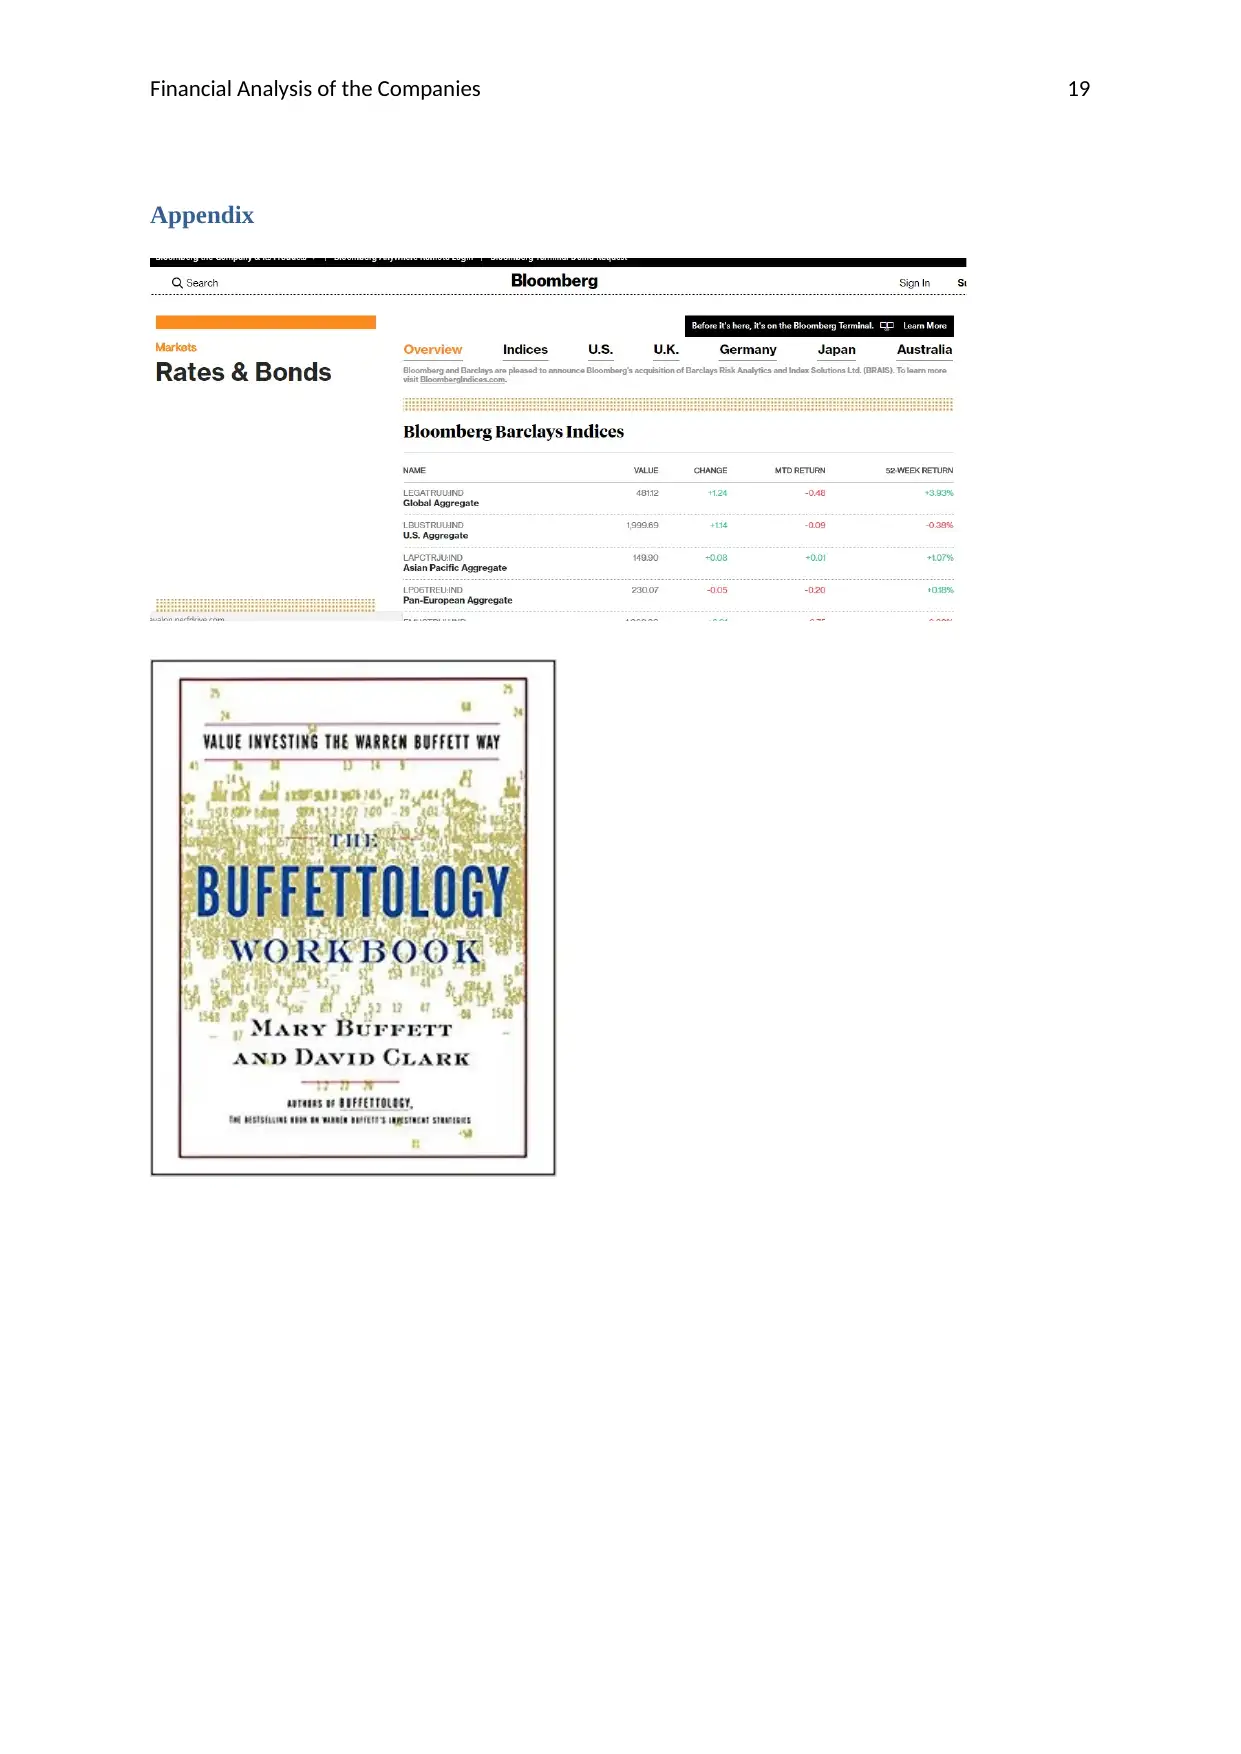
Risk free rate of return-(Bloomberg, 2018)
6
ENERGY 20.75 9% 1.3 14.3 6 5
AUSTRALIS
OIL & GAS
LIMITED 0.01 8.04 6%
0.6
8 11.2 1 8
AUS ASIA
MINERALS
LIMITED
13.4
2 195.67 11%
1.7
1 15.4 7 4
WORLEYPARS
ONS LIMITED 10% 1.4 14.6 9 2
APAC COAL
LIMITED
FINANACIALS
Westpac
13.4
5
24070.
55 8%
1.0
1 12.2 3 9
National
Australian Bank
18.9
3
3871.5
8 9%
1.1
8 12.9 4 7
SUNCORP
GROUP
LIMITED
24.4
4
2229.9
3 8%
0.8
9 11.7 2 10
(Shiller, 2015).
Notes –
Beta Information- (Yahoo finance, 2018)
Market Risk factor analysis- (Yahoo finance, 2018)
Risk free rate of return-(Bloomberg, 2018)
Secure Best Marks with AI Grader
Need help grading? Try our AI Grader for instant feedback on your assignments.
Financial Analysis of the Companies 10
Which investment of the ten would you select
After evaluating risk, return, growth rate and dividend payment, it could be inferred that if
investors invest their capital In Australian Oil and Gas Company then they will have good
amount of return (Beatson, & Chen, 2018). This investment option will give higher return
and less risk (Please see the attached excel file (Shiller, 2015).
Why the investment option selected
There are several reasons of selecting this investment option such as risk, return and
future market price of Australian Oil and Gas Company. Furthermore, the cost of capital of
company is also very low i.e. 6% which shows positive outlook for the increased return on
capital employed (Diba, & Grossman, 2018).
Task-2
Research and summaries some interesting facts about Warren Buffet
It is considered that Warren Buffet is the biggest investors who endeavoured towards
investing capital in several stocks on the basis of several factors such as profitability, return
on capital employed, risk associated with the investment and market outlook. He before
investing capital in particular stocks analysis several factors which helps him to identify
whether the stock will give good amount of return on investment or not. He has been the
biggest investors and has been appointed as CEO of Bershire Hathway (Barbu, D’Amico, &
De Blasis, 2017).
He takes investment decisions on the basis of several factors such as profitability,
return on capital employed, and risk associated with the investment and market outlook
(Christofi, 2017).
Financial Analysis of the Companies 11
There are several notes which Warren Buffet has considered before investing capital
in different companies (Shiller, & Beltratti, 2015).
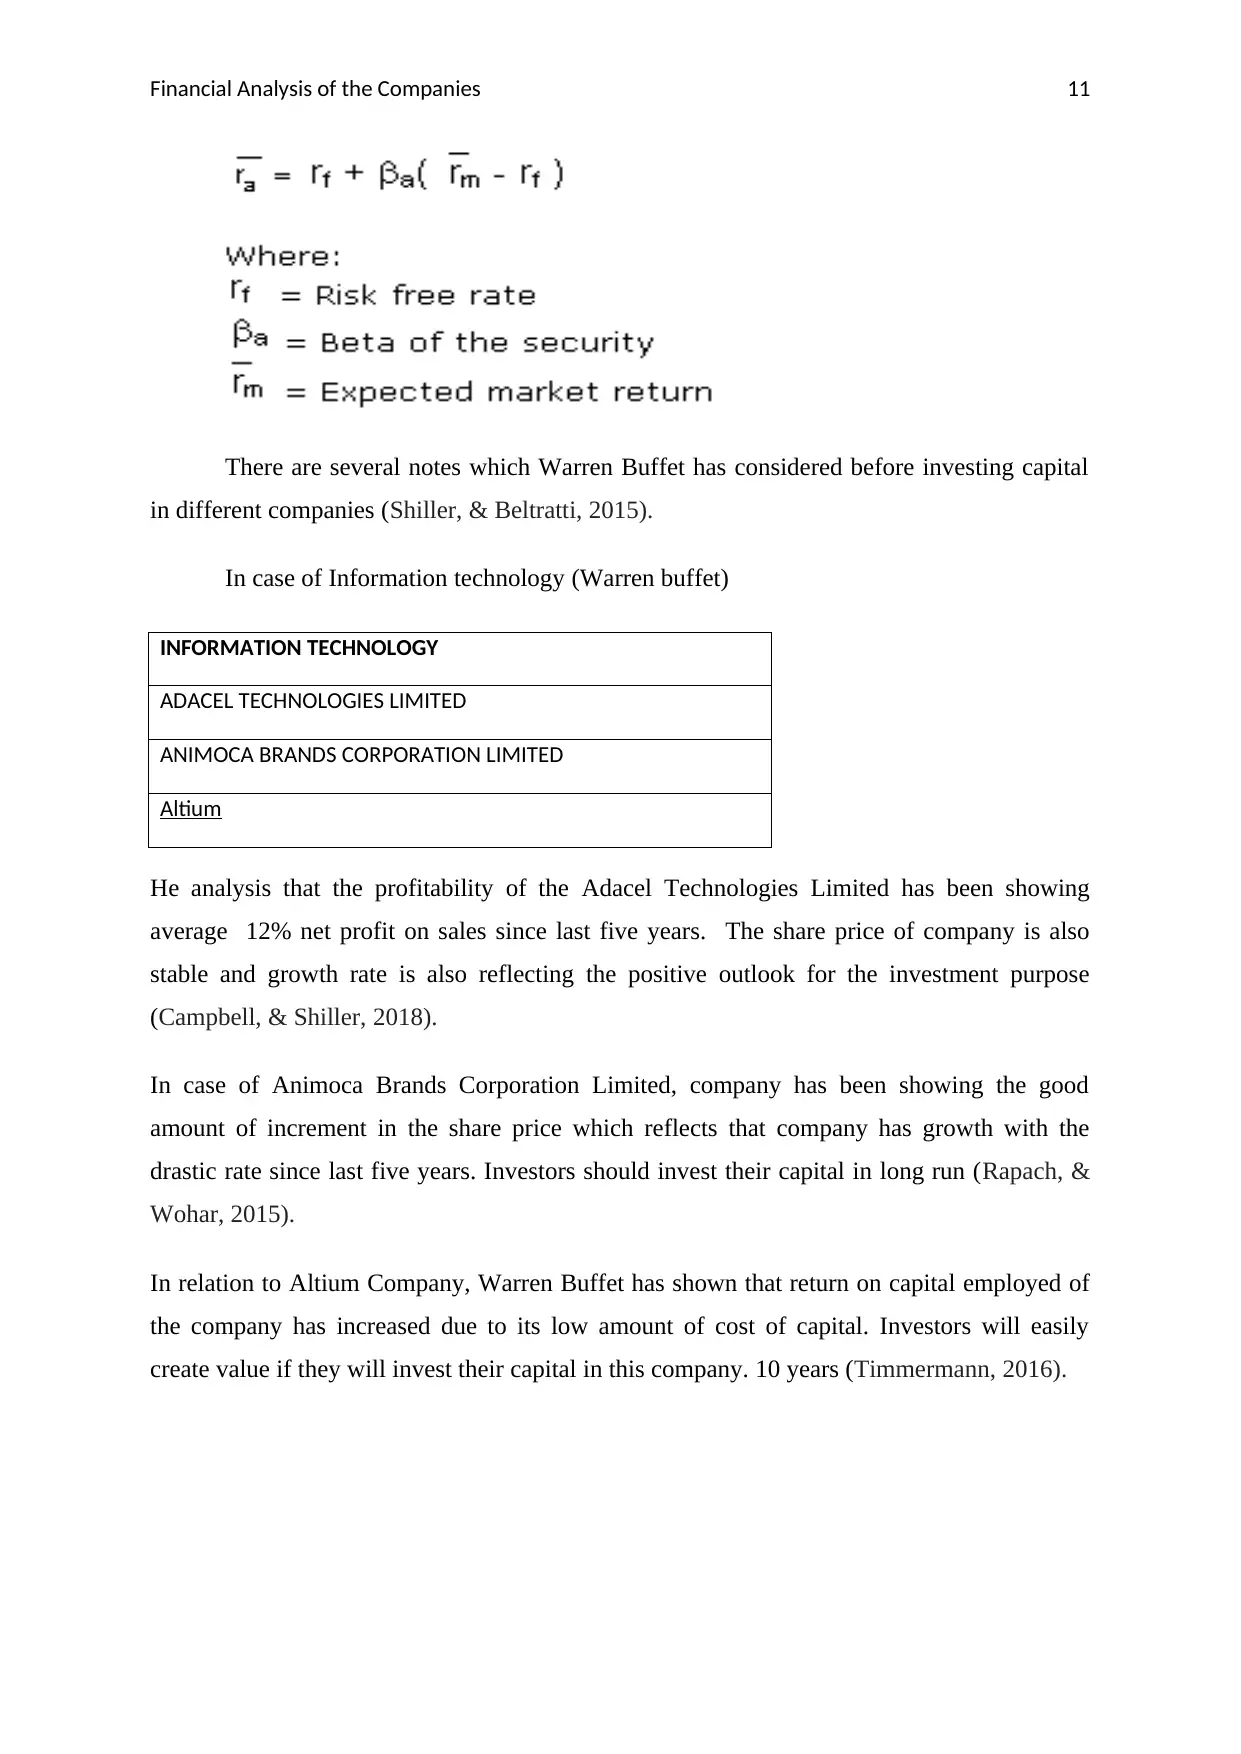
In case of Information technology (Warren buffet)
INFORMATION TECHNOLOGY
ADACEL TECHNOLOGIES LIMITED
ANIMOCA BRANDS CORPORATION LIMITED
Altium
He analysis that the profitability of the Adacel Technologies Limited has been showing
average 12% net profit on sales since last five years. The share price of company is also
stable and growth rate is also reflecting the positive outlook for the investment purpose
(Campbell, & Shiller, 2018).
In case of Animoca Brands Corporation Limited, company has been showing the good
amount of increment in the share price which reflects that company has growth with the
drastic rate since last five years. Investors should invest their capital in long run (Rapach, &
Wohar, 2015).
In relation to Altium Company, Warren Buffet has shown that return on capital employed of
the company has increased due to its low amount of cost of capital. Investors will easily
create value if they will invest their capital in this company. 10 years (Timmermann, 2016).
There are several notes which Warren Buffet has considered before investing capital
in different companies (Shiller, & Beltratti, 2015).
In case of Information technology (Warren buffet)
INFORMATION TECHNOLOGY
ADACEL TECHNOLOGIES LIMITED
ANIMOCA BRANDS CORPORATION LIMITED
Altium
He analysis that the profitability of the Adacel Technologies Limited has been showing
average 12% net profit on sales since last five years. The share price of company is also
stable and growth rate is also reflecting the positive outlook for the investment purpose
(Campbell, & Shiller, 2018).
In case of Animoca Brands Corporation Limited, company has been showing the good
amount of increment in the share price which reflects that company has growth with the
drastic rate since last five years. Investors should invest their capital in long run (Rapach, &
Wohar, 2015).
In relation to Altium Company, Warren Buffet has shown that return on capital employed of
the company has increased due to its low amount of cost of capital. Investors will easily
create value if they will invest their capital in this company. 10 years (Timmermann, 2016).
Financial Analysis of the Companies 12
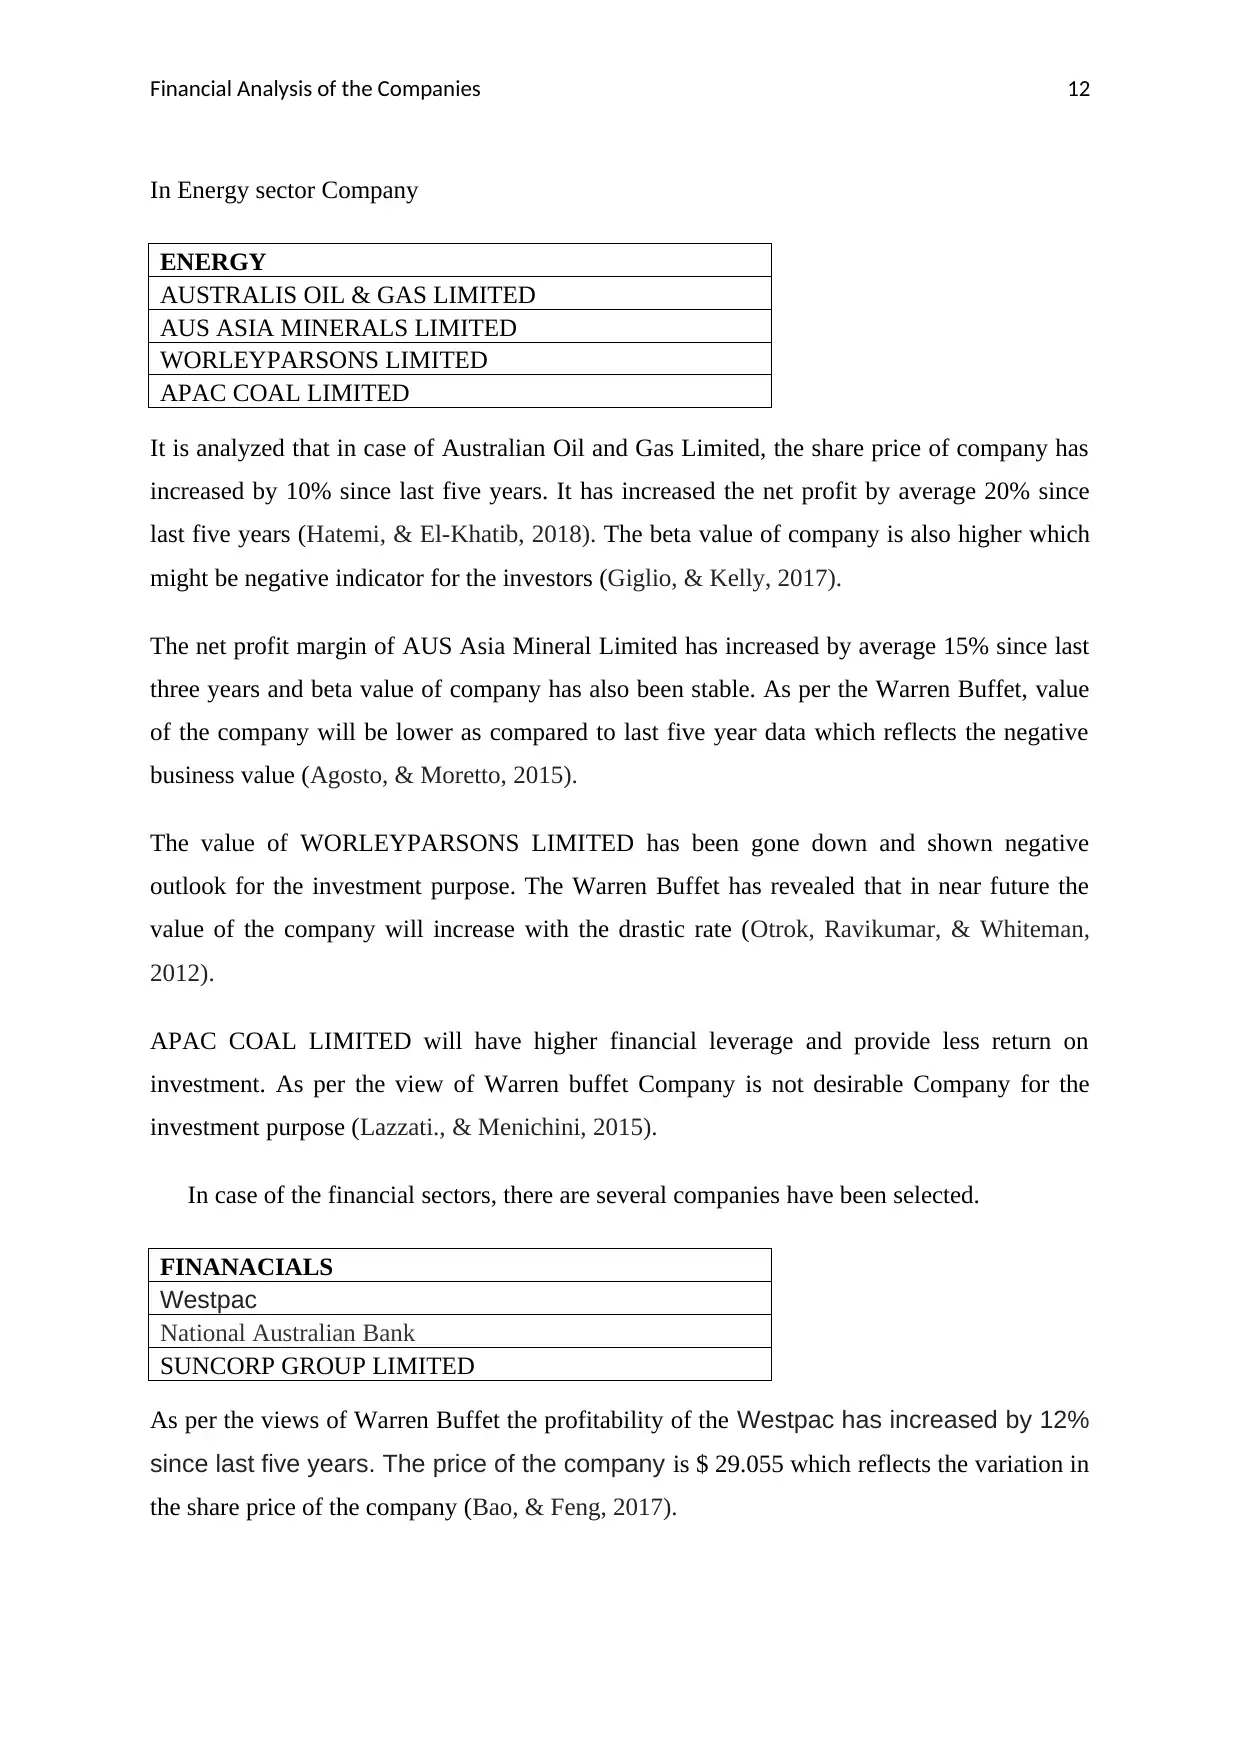
In Energy sector Company
ENERGY
AUSTRALIS OIL & GAS LIMITED
AUS ASIA MINERALS LIMITED
WORLEYPARSONS LIMITED
APAC COAL LIMITED
It is analyzed that in case of Australian Oil and Gas Limited, the share price of company has
increased by 10% since last five years. It has increased the net profit by average 20% since
last five years (Hatemi, & El-Khatib, 2018). The beta value of company is also higher which
might be negative indicator for the investors (Giglio, & Kelly, 2017).
The net profit margin of AUS Asia Mineral Limited has increased by average 15% since last
three years and beta value of company has also been stable. As per the Warren Buffet, value
of the company will be lower as compared to last five year data which reflects the negative
business value (Agosto, & Moretto, 2015).
The value of WORLEYPARSONS LIMITED has been gone down and shown negative
outlook for the investment purpose. The Warren Buffet has revealed that in near future the
value of the company will increase with the drastic rate (Otrok, Ravikumar, & Whiteman,
2012).
APAC COAL LIMITED will have higher financial leverage and provide less return on
investment. As per the view of Warren buffet Company is not desirable Company for the
investment purpose (Lazzati., & Menichini, 2015).
In case of the financial sectors, there are several companies have been selected.
FINANACIALS
Westpac
National Australian Bank
SUNCORP GROUP LIMITED
As per the views of Warren Buffet the profitability of the Westpac has increased by 12%
since last five years. The price of the company is $ 29.055 which reflects the variation in
the share price of the company (Bao, & Feng, 2017).
Paraphrase This Document
Need a fresh take? Get an instant paraphrase of this document with our AI Paraphraser
Financial Analysis of the Companies 13
National Australian Bank is having $ 28 share price which have increased by 18% since last
two years (McMillan, 2018). The higher profitability and increased return on investment has
shown positive outlook for the investment purpose as per the views of the Warren Buffet
(Zuzik, et al. 2018).
In context with the Sun Corp, Warren Buffet has maintained lower profitability and increased
return on investment. The invested capital for the long run will be value creation in this
company as per the views of the Warren Buffet (Yahoo finance, 2018).
Task 3
Compare Warren Buffet’s approach to share valuation and the share valuation
methodology
It is observed that as per the views of the Warren Buffet the share price of the
company and its business outlook in future is based on the several factors such as
profitability, return on capital employed, risk associated with the investment and market
outlook. If these factors are positive then it will help investors to create value on the
investment. There is other factor which needs to be considered by the investors before
investing capital (McMillan, 2018).
In terms of the Return on equity
Investors needs to analysis whether the company has higher return on capital
employed and higher return on equity (Montani, Perrini, Gervasio, & Pulcini, 2017).
Financial leverage of company
The high level of financial leverage in particular company may be risky factors for the
investment purpose (Yahoo finance, 2018).
Profitability of the business
The profitability of the business is the major factors for the increasing growth of the
business (Fama, 2017).
Nature of the organization and legal compliance
Financial Analysis of the Companies 14
Legal compliance, nature of business and less complexity reflects that company has
low level of business outlooks (Levine, & Zervos, 2017).
Share valuation Methodology
Warren Buffet follows main two-column Valuation Methodology to identify the market
value and intrinsic value of company (Lee, & Heo, 2016).
These all models are used to evaluate the share price of company (Tsai, 2018).
Relative Valuation method
In this method, PE ratio is calculated on the basis of MPS and EPS of the company. After
that, it is used to give ranking to the particular stocks. (Andersson, et al. 2018).
Dividend Discount Model
The cost of equity, offered dividend, return on investment are used to compute the
share price of company (Chan, et al. 2018).
Discounted Cash Flow Model
This model is ideally used when the company has been offering zero amount of
dividend to its shareholders (Yahoo finance, 2018).
After evaluating these factors, it could be inferred that investors should all these
factors before investing capital in particular company. It helps them to analysis all the
negative and positive factors of the selected stocks for the investment purpose (Andalib,
Tavakolan, & Gatmiri, 2018).
Conclusion
After evaluating the methods or theories given by Warren Buffet and the methods
available to identify the share price, it could be inferred that Investors needs to evaluated all
the factors such as profitability, return on capital employed, risk associated with the
investment and market outlook before investing in particular company.
Financial Analysis of the Companies 15
References
Agosto, A., & Moretto, E. (2015). Variance matters (in stochastic dividend discount
models). Annals of Finance, 11(2), 283-295.
Andalib, M. S., Tavakolan, M., & Gatmiri, B. (2018). Modeling managerial behavior in real
options valuation for project-based environments. International Journal of Project
Management, 36(4), 600-611.
Andersson, H., Hultkrantz, L., Lindberg, G., & Nilsson, J. E. (2018). Economic Analysis and
Investment Priorities in Sweden’s Transport Sector. Journal of Benefit-Cost Analysis,
1-27.
ASX. (2018, may 09). ASX. Retrieved from ASX LIMITED:
https://www.asx.com.au/prices/company-information.htm
Bao, G., & Feng, G. (2017). Testing the Dividend Discount Model in Housing Markets: the
Role of Risk. The Journal of Real Estate Finance and Economics, 1-25.
Barbu, V. S., D’Amico, G., & De Blasis, R. (2017). Novel advancements in the Markov
chain stock model: analysis and inference. Annals of Finance, 13(2), 125-152.
Beatson, S. A., & Chen, J. (2018). Foreign investment, corporate governance and
performance in the Chinese listed a share companies. Journal of Chinese Economic
and Business Studies, 16(1), 59-93.
Bloomberg, 2018, Treasury Government bonds rates, retrieved on 12th May, 2018, from
https://www.google.co.in/search?
q=Bloomberg+govermentn+bond+rate&oq=Bloomberg+govermentn+bond+rate&aqs
=chrome..69i57j0l5.5915j0j9&sourceid=chrome&ie=UTF-8
Campbell, J. Y., & Shiller, R. J. (2018). Stock prices, earnings, and expected dividends. The
Journal of Finance, 43(3), 661-676.
Chan, K. F., Powell, J. G., Shi, J., & Smith, T. (2018). Dividend persistence and dividend
behaviour. Accounting & Finance, 58(1), 127-147.
Christofi, A. (2017). Stock Valuation and the Implied Growth Rate.
Secure Best Marks with AI Grader
Need help grading? Try our AI Grader for instant feedback on your assignments.
Financial Analysis of the Companies 16
Diba, B. T., & Grossman, H. I. (2018). Explosive rational bubbles in stock prices?. The
American Economic Review, 78(3), 520-530.
Fama, E. F. (2017). Finance at the University of Chicago. Journal of Political
Economy, 125(6), 1790-1799.
Giglio, S., & Kelly, B. (2017). Excess volatility: Beyond discount rates. The Quarterly
Journal of Economics, 133(1), 71-127.
Hatemi-J, A., & El-Khatib, Y. (2018). The Dividend Discount Model with Multiple Growth
Rates of Any Order for Stock Evaluation. arXiv preprint arXiv:1802.08987.
Lazzati, N., & Menichini, A. A. (2015). A dynamic approach to the dividend discount
model. Review of Pacific Basin Financial Markets and Policies, 18(03), 1550018.
Lee, C. Y., & Heo, H. (2016). Estimating willingness to pay for renewable energy in South
Korea using the contingent valuation method. Energy Policy, 94, 150-156.
McMillan, D. G. (2018). Where Does Returns and Cash-Flow Predictability Occur? Evidence
from Stock Prices, Earnings, Dividends and Cointegration. In Predicting Stock
Returns (pp. 9-26). Palgrave Pivot, Cham.
Montani, D., Perrini, F., Gervasio, D., & Pulcini, A. (2017). The Importance of
“Contextualisation” in Small and Medium-Sized Firms Valuation: Evidences from an
Italian Case Study. International Journal of Business and Management, 13(1), 70.
Otrok, C., Ravikumar, B., & Whiteman, C. H. (2012). Habit formation: a resolution of the
equity premium puzzle?. Journal of Monetary Economics, 49(6), 1261-1288.
Owens, D. (2018). Simply Wall ST. Retrieved from https://simplywall.st/stocks/au/banks/asx-
ben/bendigo-and-adelaide-bank-shares/news/what-makes-bendigo-and-adelaide-bank-
limited-asxben-a-great-dividend-stock/
Rapach, D. E., & Wohar, M. E. (2015). Valuation ratios and long‐horizon stock price
predictability. Journal of Applied Econometrics, 20(3), 327-344.
Shiller, R. J. (2015). Do stock prices move too much to be justified by subsequent changes in
dividends?.
Financial Analysis of the Companies 17
Shiller, R. J., & Beltratti, A. E. (2015). Stock prices and bond yields: Can their comovements
be explained in terms of present value models?. Journal of Monetary
Economics, 30(1), 25-46.
Timmermann, A. (2016). Excess volatility and predictability of stock prices in autoregressive
dividend models with learning. The Review of Economic Studies, 63(4), 523-557.
Yahoo finance, 2018, Altium, retrieved on 12th May, 2018, from
https://in.finance.yahoo.com/
Yahoo finance, 2018, APAC COAL LIMITED, retrieved on 12th May, 2018, from
https://in.finance.yahoo.com/
Yahoo finance, 2018, BHP Billiton, retrieved on 12th May, 2018, from
https://in.finance.yahoo.com/
Yahoo finance, 2018, CALTEX AUSTRALIA LIMITED, retrieved on 12th May, 2018, from
https://in.finance.yahoo.com/
Yahoo finance, 2018, COMMON WEALTH BANK OF AUSTRALIA, retrieved on 12th
May, 2018, from https://in.finance.yahoo.com/
Yahoo finance, 2018, COMPUTERSHARE LIMITED, retrieved on 12th May, 2018, from
https://in.finance.yahoo.com/
Yahoo finance, 2018, National Australian Bank, retrieved on 12th May, 2018, from
https://in.finance.yahoo.com/
Yahoo finance, 2018, SUNCORP GROUP LIMITED, retrieved on 12th May, 2018, from
https://in.finance.yahoo.com/
Yahoo finance, 2018, WISETECH GLOBAL, retrieved on 12th May, 2018, from
https://in.finance.yahoo.com/
Yahoo finance, 2018, WORLEYPARSONS LIMITED, retrieved on 12th May, 2018, from
https://in.finance.yahoo.com/
Zuzik, J., Mixtaj, L., Weiss, E., Weiss, R., & Laskovský, V. (2018). Quality of business
valuation methods in Slovakian mining industry.

Financial Analysis of the Companies 18
.
.
Paraphrase This Document
Need a fresh take? Get an instant paraphrase of this document with our AI Paraphraser
Financial Analysis of the Companies 19
Appendix
Appendix
Financial Analysis of the Companies 20
1 out of 21
Related Documents


![[pdf] Financial Analysis of a Selected Company](/_next/image/?url=https%3A%2F%2Fdesklib.com%2Fmedia%2Fimages%2Fmn%2Ff4ded8323f8e41c98478fe2ab2333033.jpg&w=256&q=75)


Your All-in-One AI-Powered Toolkit for Academic Success.
+13062052269
info@desklib.com
Available 24*7 on WhatsApp / Email
![[object Object]](/_next/static/media/star-bottom.7253800d.svg)
Unlock your academic potential
© 2024 | Zucol Services PVT LTD | All rights reserved.