MBA Financial Analysis Report: Dutch Lady Milk Industries Berhad
VerifiedAdded on 2022/08/12
|25
|4270
|32
Report
AI Summary
This report presents a comprehensive financial analysis of Dutch Lady Milk Industries Berhad, a prominent dairy company in Malaysia. It begins with an introduction to financial analysis and its significance in business decision-making, followed by a detailed profile of Dutch Lady, including its history, product offerings, and strategic analysis based on internal and external factors. The report then assesses industry attractiveness and conducts a PEST analysis to understand the political, economic, social, and technological factors influencing the company. A crucial part of the report involves a four-year financial performance analysis, utilizing profitability, liquidity, and efficiency ratios to evaluate the company's financial health and trends. The report also includes a cash flow analysis and concludes with suggestions for further research and improvements, providing valuable insights for understanding the company's financial performance and strategic positioning in the market. This report follows the assignment brief from an MBA module in Financial Analysis and Management.
Running Head: ACCOUNTING FINNACIAL ANALYSIS REPORT
ACCOUNTING FINANCIAL ANALYSIS REPORT
Name of the Student
Name of the University
Author Note
ACCOUNTING FINANCIAL ANALYSIS REPORT
Name of the Student
Name of the University
Author Note
Paraphrase This Document
Need a fresh take? Get an instant paraphrase of this document with our AI Paraphraser
1ACCOUNTING FINANCIAL ANALYSIS REPORT
Table of Contents
Introduction................................................................................................................................2
Profiling Information.................................................................................................................2
Industry Attractiveness...............................................................................................................4
PEST Analysis...........................................................................................................................5
Financial Performance Analysis................................................................................................6
Cash Flow Analysis..................................................................................................................17
Scope for Further Research......................................................................................................20
Reference..................................................................................................................................22
2ACCOUNTING FINANCIAL ANALYSIS REPORT
Introduction
Financial analysis examines the financial information for reaching the decisions of
business. It involves using the financial data for assessing performance of company and
making recommendations regarding the way it can be improved. Financial health of company
is the best indicator of analyzing potential of business for the long-term growth (AMOAH
2016). Hence, this report aims to evaluate key drivers, which have affected group and
industry as whole. Further, financial analysis of “Dutch Lady Milk Industries Berhad” for
four consecutive year will be done and suggestions will be given based on prevailing trends.
Lastly, analysis of the cash flow statements will be done and suggestions will be given on
possible impacts of changing environment.
Profiling Information
“Dutch Lady Milk Industries Berhad” is the dairy company based in Malaysia. This
company operates through manufacturing as well as distribution of ranges of the dairy
products segments. The company manufacturers milk powder, sweetened condensed milk,
fruit juice drinks and dairy products. It established first as manufacturer of the sweetened
condensed milk in year 1960 in their own factory in Petaling Jaya and still when more than
fifty years have passed, it operates in same plant of production. The products of this entity
include “Friso Gold”, “Dutch Lady Purefarm UHT milk” and formulated milk powder for the
children “Dutch Lady Nutriplan with 5X DHA”. The distribution of these products are in
East Malaysia as well as Peninsular (Disclosure.bursamalaysia.com. 2020).
Strategic Analysis
⊘ This is a preview!⊘
Do you want full access?
Subscribe today to unlock all pages.
Trusted by 1+ million students worldwide
3ACCOUNTING FINANCIAL ANALYSIS REPORT
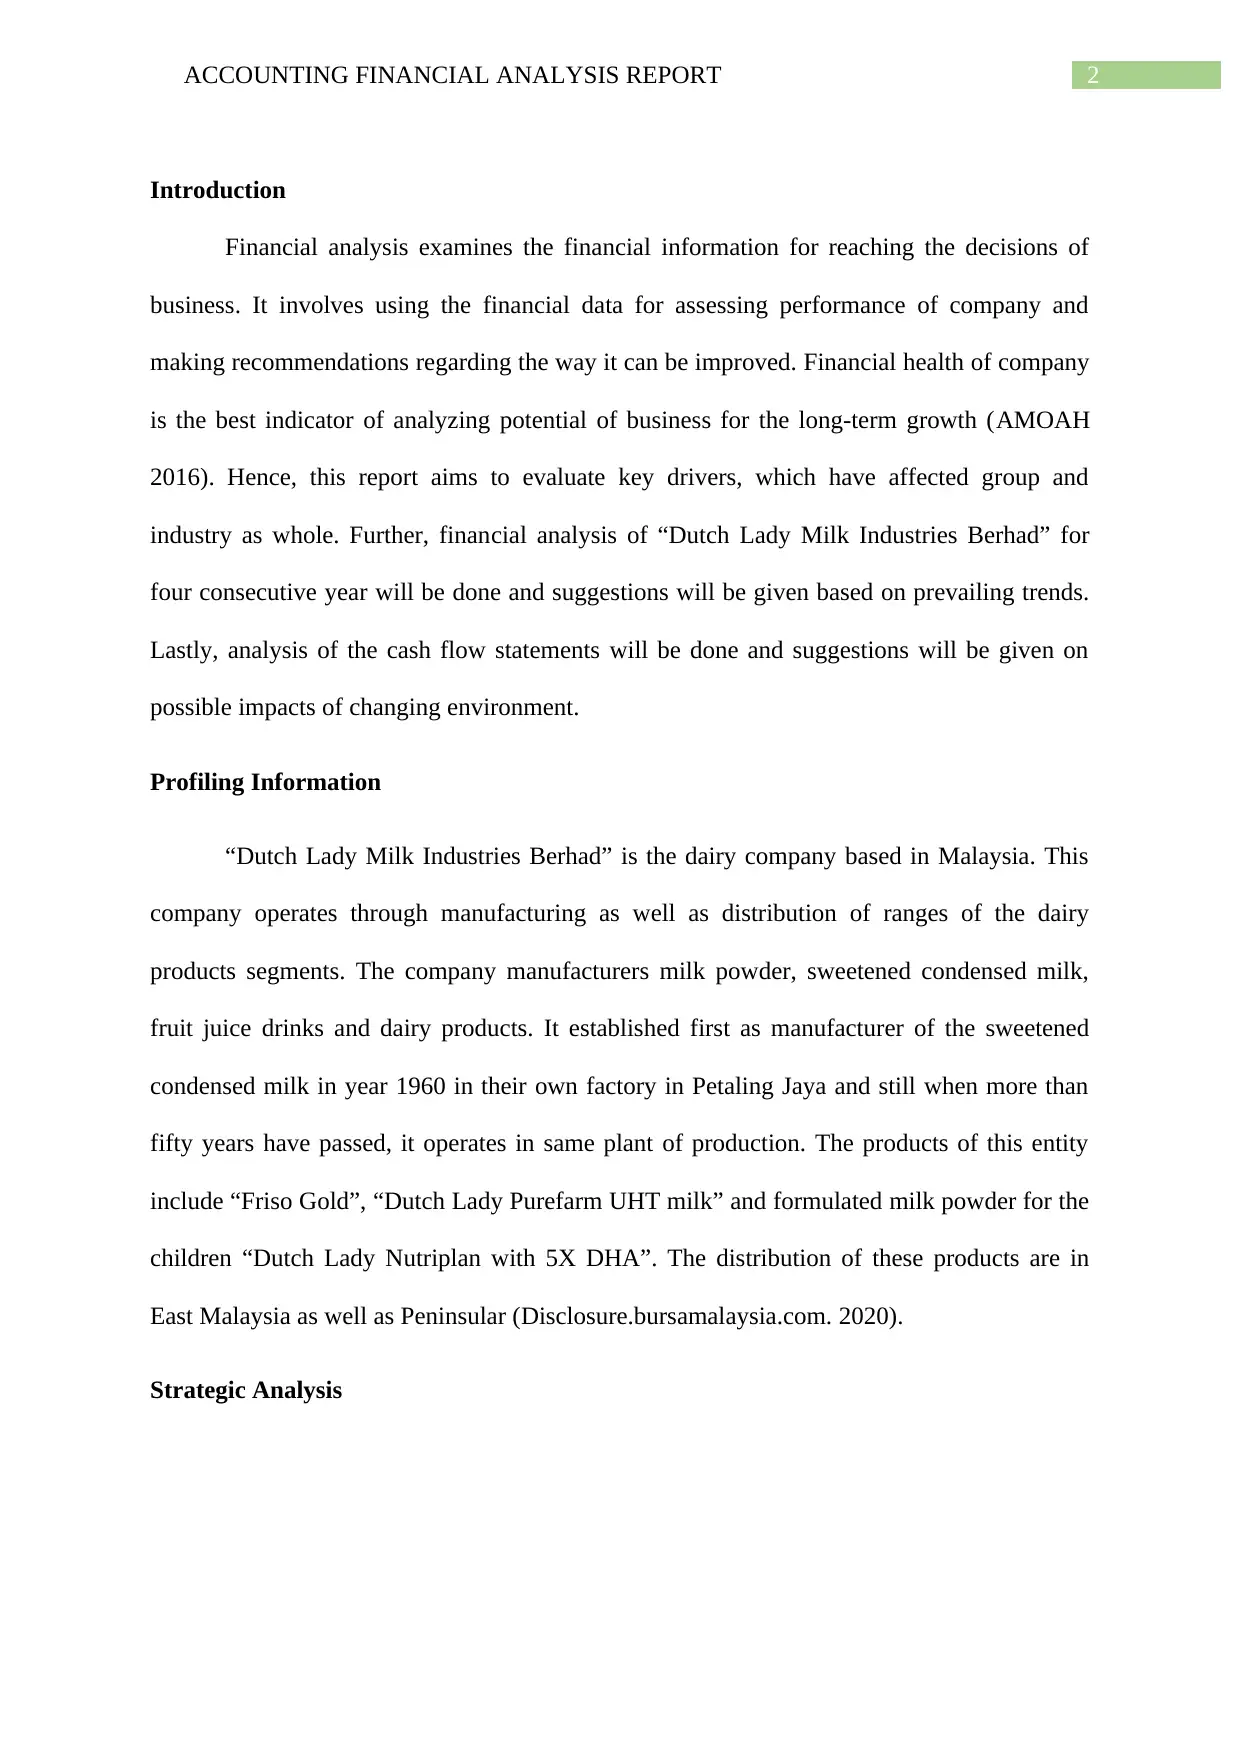
Table 1: Internal-External Matrix Analysis of Dutch Lady
“Dutch Lady Milk Industries” aims for achieving its mission to help the Malaysians
for moving forward in their life with the trusted dairy nutrition. The company constantly
looks for innovation to further strengthening its position as leading company of dairy. From
the analysis of internal and external factors environment of Dutch Lady Milk Industries,
overall weighted score of internal factors is 3.02 and the weighted score of external factors is
3.12. The cells I, II and IV are in growth and building strategies category. The cell I means
that internal and the external factors have stronger potential for optimizing competitive
advantages by different potential strategies for instance forward, backward integration,
diversification strategies, product development, market penetration and market development.
The cell IV and II implies average capability for creating competitive advantages, hence,
average potential strategies such as diversification, development and penetration strategies
(Guay, Samuels and Taylor 2016).
These strategies are having the capability for strengthening its current generic
competitive strategies. The generic competitive strategies at the Dutch Lady framework
strategy is hybrid of both the low-cost provider as well as broad differentiation. The company
has broad cross-sectional market that involves both adult and children. They put more
emphasis on the features of products for differentiating between rival’s products. They
Paraphrase This Document
Need a fresh take? Get an instant paraphrase of this document with our AI Paraphraser
4ACCOUNTING FINANCIAL ANALYSIS REPORT
continuously strives for reducing cost that help them in upgradation to robotic and automatic
line in power plant as well as relaunching of products with the new formulation. The
company have also customized packaging and the promotion for various target group for
instance, iconic animation for attracting kinds, smaller six for the school children and
economic pack for the families and many more (Disclosure.bursamalaysia.com. 2020).
Industry Attractiveness
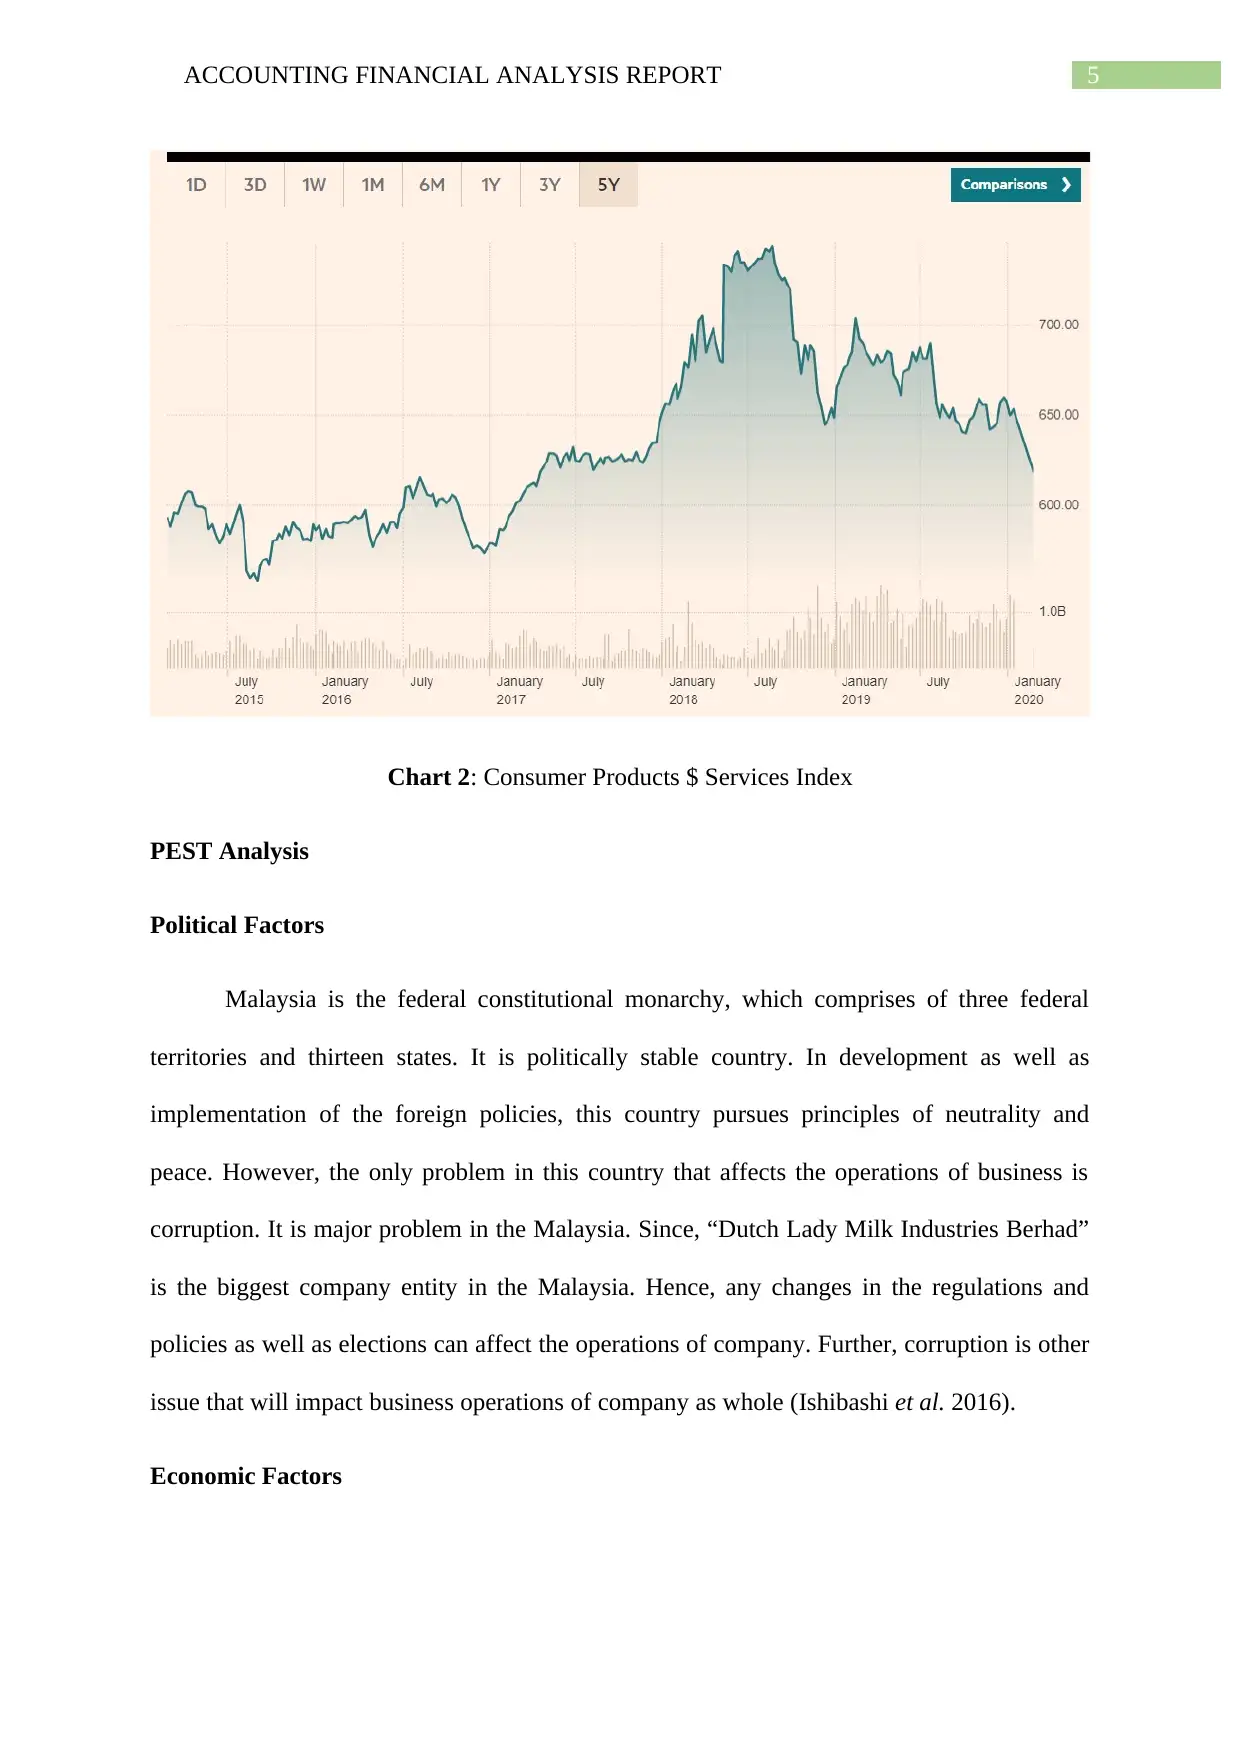
The company operates in the industry of consumer products & services. The
improvement in economic outlook and the growth data of job are expected to fuel the
spending of consumer globally. Further, several stocks of consumer on local bourse have
witnessed high valuations over past years, while consumer index of Bursa Malaysia has
outperformed FBM KLCI, right since start of year. The consumer index has PER of 29.8
times. The country’s recent performance of the consumer stocks has been influenced largely
by uncertainties in run-up to 14th general elections and post-election policies. Hence, in run-
up to election, the index of consumer rose 5.1% in comparison to FBM KLCI’s 2.8%.
However, after election, this index rose to 14.5%, while FBM KLCI fell by 2%. Moreover,
the five-year trend of consumer staples industry indicates high growth rate of industry over
the years (Popoola et al. 2014).
continuously strives for reducing cost that help them in upgradation to robotic and automatic
line in power plant as well as relaunching of products with the new formulation. The
company have also customized packaging and the promotion for various target group for
instance, iconic animation for attracting kinds, smaller six for the school children and
economic pack for the families and many more (Disclosure.bursamalaysia.com. 2020).
Industry Attractiveness
The company operates in the industry of consumer products & services. The
improvement in economic outlook and the growth data of job are expected to fuel the
spending of consumer globally. Further, several stocks of consumer on local bourse have
witnessed high valuations over past years, while consumer index of Bursa Malaysia has
outperformed FBM KLCI, right since start of year. The consumer index has PER of 29.8
times. The country’s recent performance of the consumer stocks has been influenced largely
by uncertainties in run-up to 14th general elections and post-election policies. Hence, in run-
up to election, the index of consumer rose 5.1% in comparison to FBM KLCI’s 2.8%.
However, after election, this index rose to 14.5%, while FBM KLCI fell by 2%. Moreover,
the five-year trend of consumer staples industry indicates high growth rate of industry over
the years (Popoola et al. 2014).
5ACCOUNTING FINANCIAL ANALYSIS REPORT
Chart 2: Consumer Products $ Services Index
PEST Analysis
Political Factors
Malaysia is the federal constitutional monarchy, which comprises of three federal
territories and thirteen states. It is politically stable country. In development as well as
implementation of the foreign policies, this country pursues principles of neutrality and
peace. However, the only problem in this country that affects the operations of business is
corruption. It is major problem in the Malaysia. Since, “Dutch Lady Milk Industries Berhad”
is the biggest company entity in the Malaysia. Hence, any changes in the regulations and
policies as well as elections can affect the operations of company. Further, corruption is other
issue that will impact business operations of company as whole (Ishibashi et al. 2016).
Economic Factors
⊘ This is a preview!⊘
Do you want full access?
Subscribe today to unlock all pages.
Trusted by 1+ million students worldwide
6ACCOUNTING FINANCIAL ANALYSIS REPORT
The projections by IMF states that Malaysia is ranks 37 in global GDP ranking. The
GDP of Malaysia is $358,579 million in 2018 and GDP per capital in same year was around
$11,072 that was quite higher than the previous years. Malaysia is having robust, healthy and
industrialized economy. The rate of unemployment in this country has benefitted from the
adoption of the cutting-edge technology. This economy growth rate of country has helped the
company to operate with greater efficiency and expand their operations. This company
influenced purchasing power of the potential customers.
Social Factors
Malaysia is the diverse ethically and it has rich cultural life. In this county, people live
their life much more affluent lifestyle in comparison to its various other upper-middle income
countries. Further, factors that contributes to this includes system of social welfare, low cost
of household, food and fuel products, almost free system of health care. “Dutch Lady Milk
Industries Berhad” is leading and oldest brand in the Malaysia and people of this country
stick to this brand, since its establishment because of the faith in brand.
Technological factors
Malaysia is the most digitally connected country around the world. Approx. eighty
percent of the residents of this country have access to the internet, especially through the
mobile networks. This country has been great place for the international technology-oriented
entities. Malaysia aims to become favorite destination for the high-tech investment by the end
of 2025. “Dutch Lady Milk Industries Berhad” is adaptive to technology. The company is up-
to-date with the change in technology. Hence, change in technology will not affect the
operations of company (Kulikova and Satdarova 2016).
Financial Performance Analysis
Profitability Ratio
Paraphrase This Document
Need a fresh take? Get an instant paraphrase of this document with our AI Paraphraser
7ACCOUNTING FINANCIAL ANALYSIS REPORT
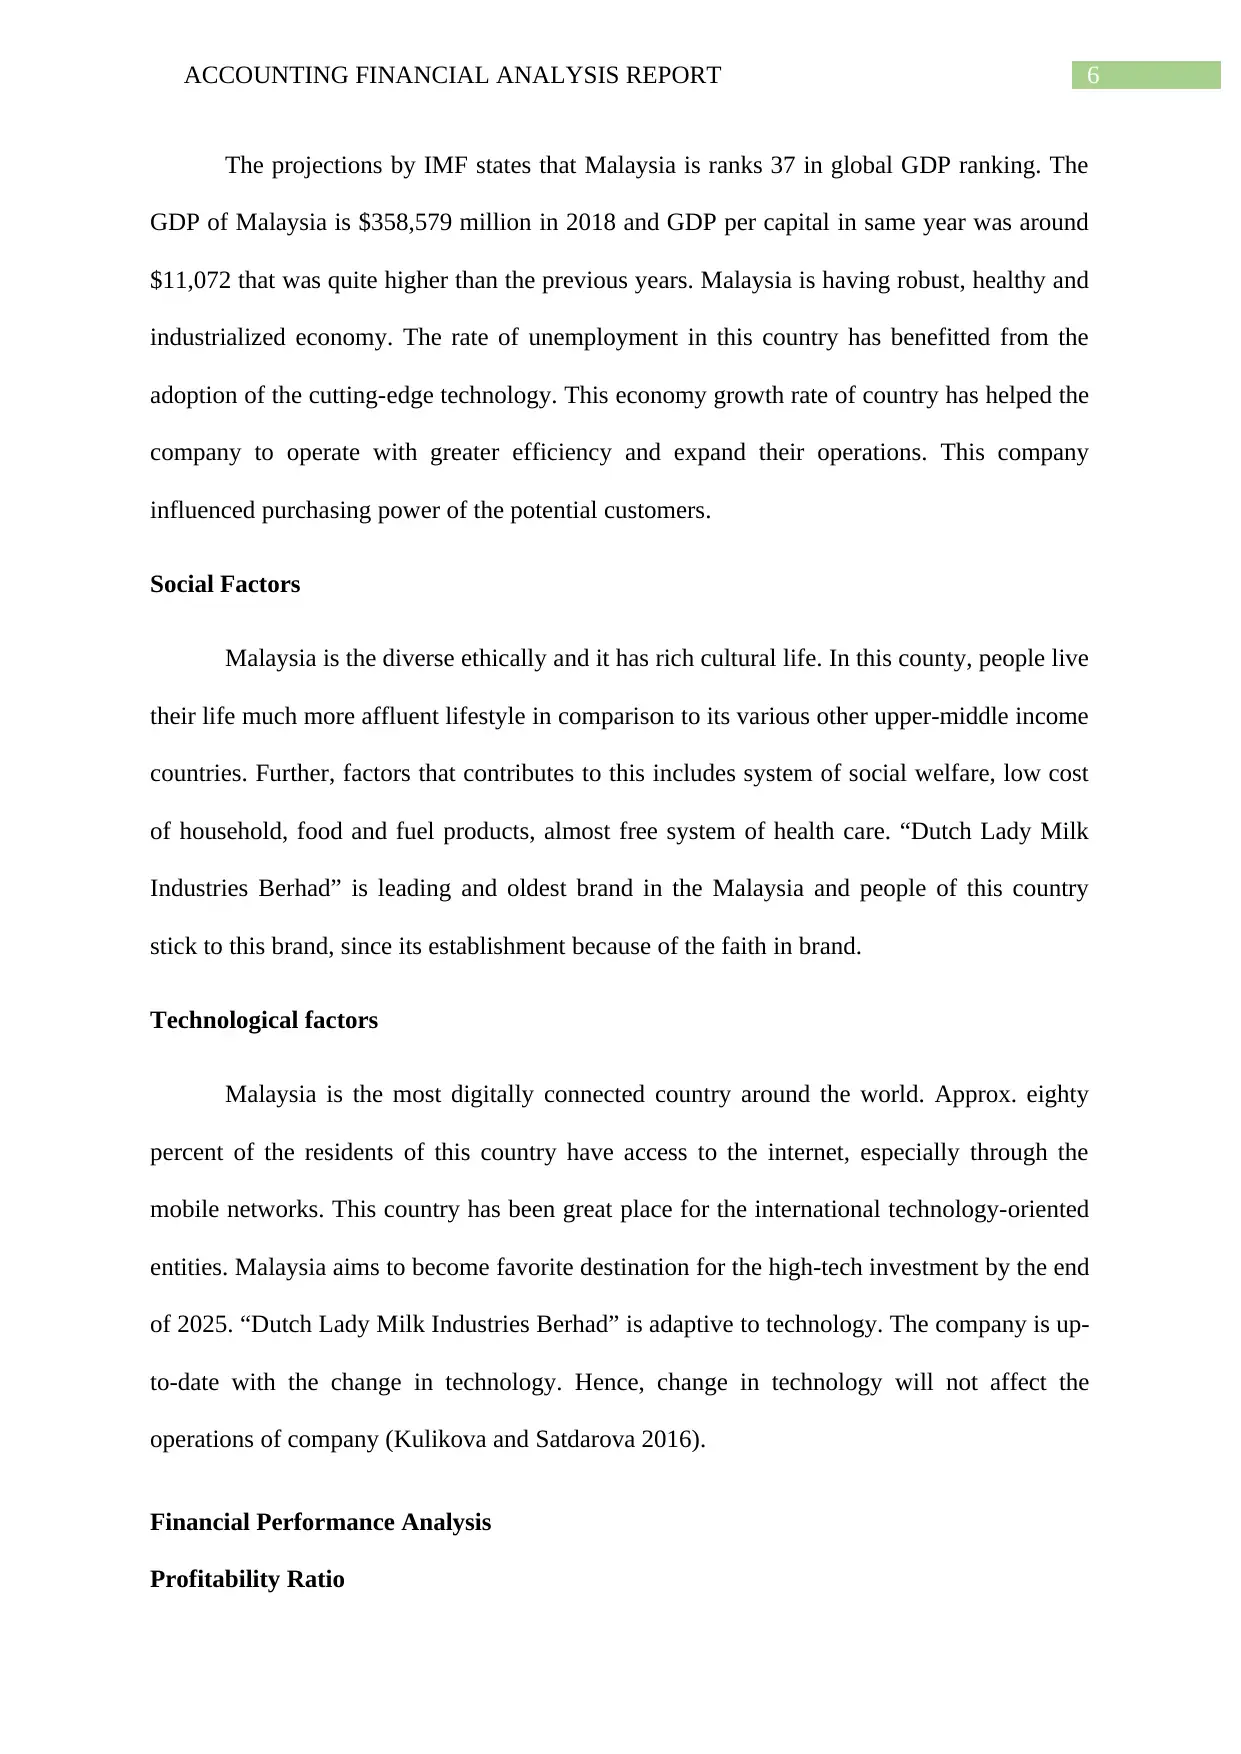
The profitability ratio are the financial metrics used for assessing the ability of
business for generating the earnings relative to operating costs, shareholders’ equity,
operating costs and revenue over time by using data from specified time-period. The gross
profit margin of company was 42% for 2015 and 2016 that decreased to 38% in 2017 and
then it increased to 40% in 2018. It means that the there was no change in margin from 2015-
2016, from 2016-2017, there the margin decreased by 4% and lastly, from 2017-2018, the
margin increased by 2%. Hence, the trend shows that in last four years, the company’s ability
in making profit after paying its cost of the goods sold has been declined over years.
However, the company is able to make profit from its revenue generated in 2018. Hence, it is
recommended to company’s management that it should try to reduce the cost of goods sold. If
it will be reduced that automatically profit will be increased (Dengler 2016).
Year 2015 Year 2016 Year 2017 Year 2018
36%
37%
38%
39%
40%
41%
42%
Gross Profit Margin
Chart 3: Gross Profit Margin of Dutch Lady
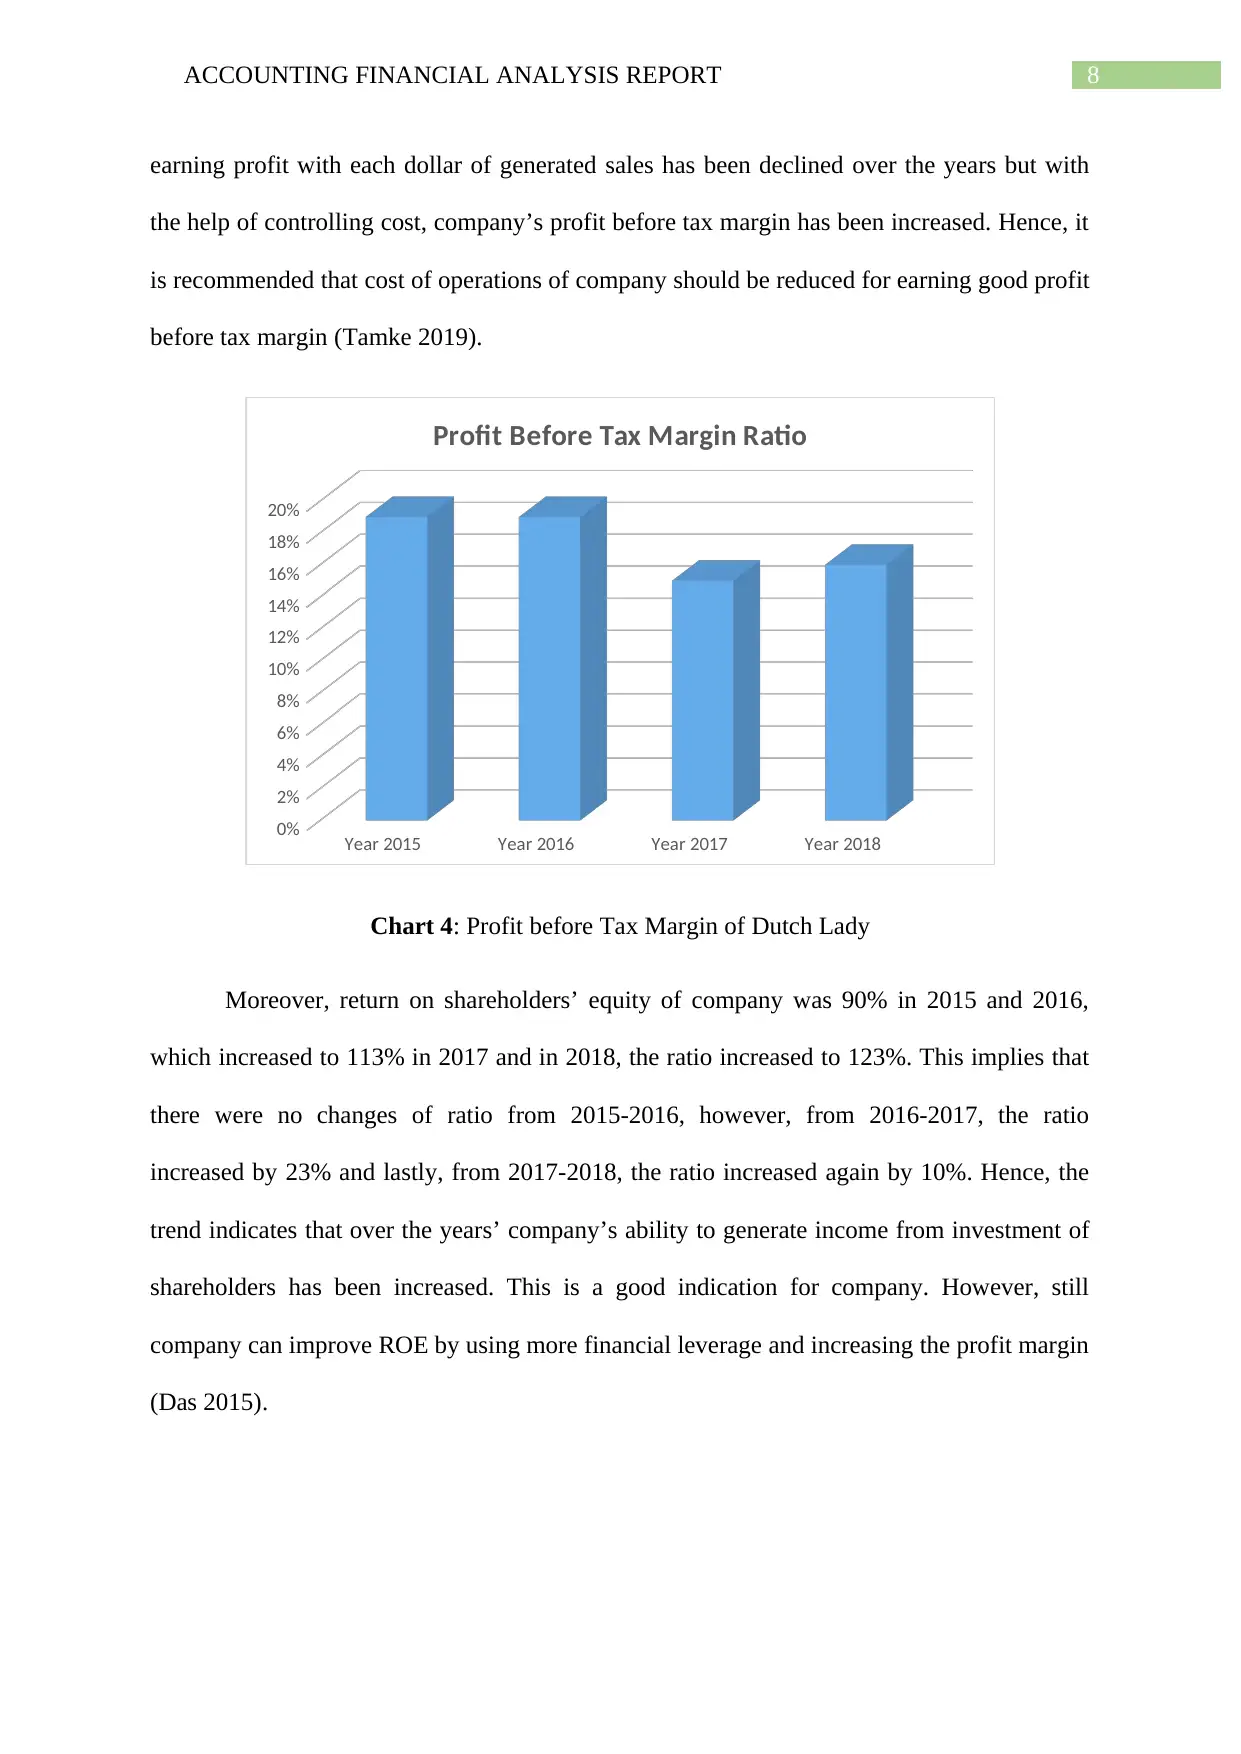
Further, the profit before tax margin ratio was 19% for 2015 and 2016, which
decreased to 15% in 2017 and increased to 16% in 2018. It implies that there were no change
in margin from 2015-2016, from 2016-2017, the margin decreased by 4% and lastly, from
2017-2018, the ratio increased by 1%. Hence, this trend shows that the ability of company in
The profitability ratio are the financial metrics used for assessing the ability of
business for generating the earnings relative to operating costs, shareholders’ equity,
operating costs and revenue over time by using data from specified time-period. The gross
profit margin of company was 42% for 2015 and 2016 that decreased to 38% in 2017 and
then it increased to 40% in 2018. It means that the there was no change in margin from 2015-
2016, from 2016-2017, there the margin decreased by 4% and lastly, from 2017-2018, the
margin increased by 2%. Hence, the trend shows that in last four years, the company’s ability
in making profit after paying its cost of the goods sold has been declined over years.
However, the company is able to make profit from its revenue generated in 2018. Hence, it is
recommended to company’s management that it should try to reduce the cost of goods sold. If
it will be reduced that automatically profit will be increased (Dengler 2016).
Year 2015 Year 2016 Year 2017 Year 2018
36%
37%
38%
39%
40%
41%
42%
Gross Profit Margin
Chart 3: Gross Profit Margin of Dutch Lady
Further, the profit before tax margin ratio was 19% for 2015 and 2016, which
decreased to 15% in 2017 and increased to 16% in 2018. It implies that there were no change
in margin from 2015-2016, from 2016-2017, the margin decreased by 4% and lastly, from
2017-2018, the ratio increased by 1%. Hence, this trend shows that the ability of company in
8ACCOUNTING FINANCIAL ANALYSIS REPORT
earning profit with each dollar of generated sales has been declined over the years but with
the help of controlling cost, company’s profit before tax margin has been increased. Hence, it
is recommended that cost of operations of company should be reduced for earning good profit
before tax margin (Tamke 2019).
Year 2015 Year 2016 Year 2017 Year 2018
0%
2%
4%
6%
8%
10%
12%
14%
16%
18%
20%
Profit Before Tax Margin Ratio
Chart 4: Profit before Tax Margin of Dutch Lady
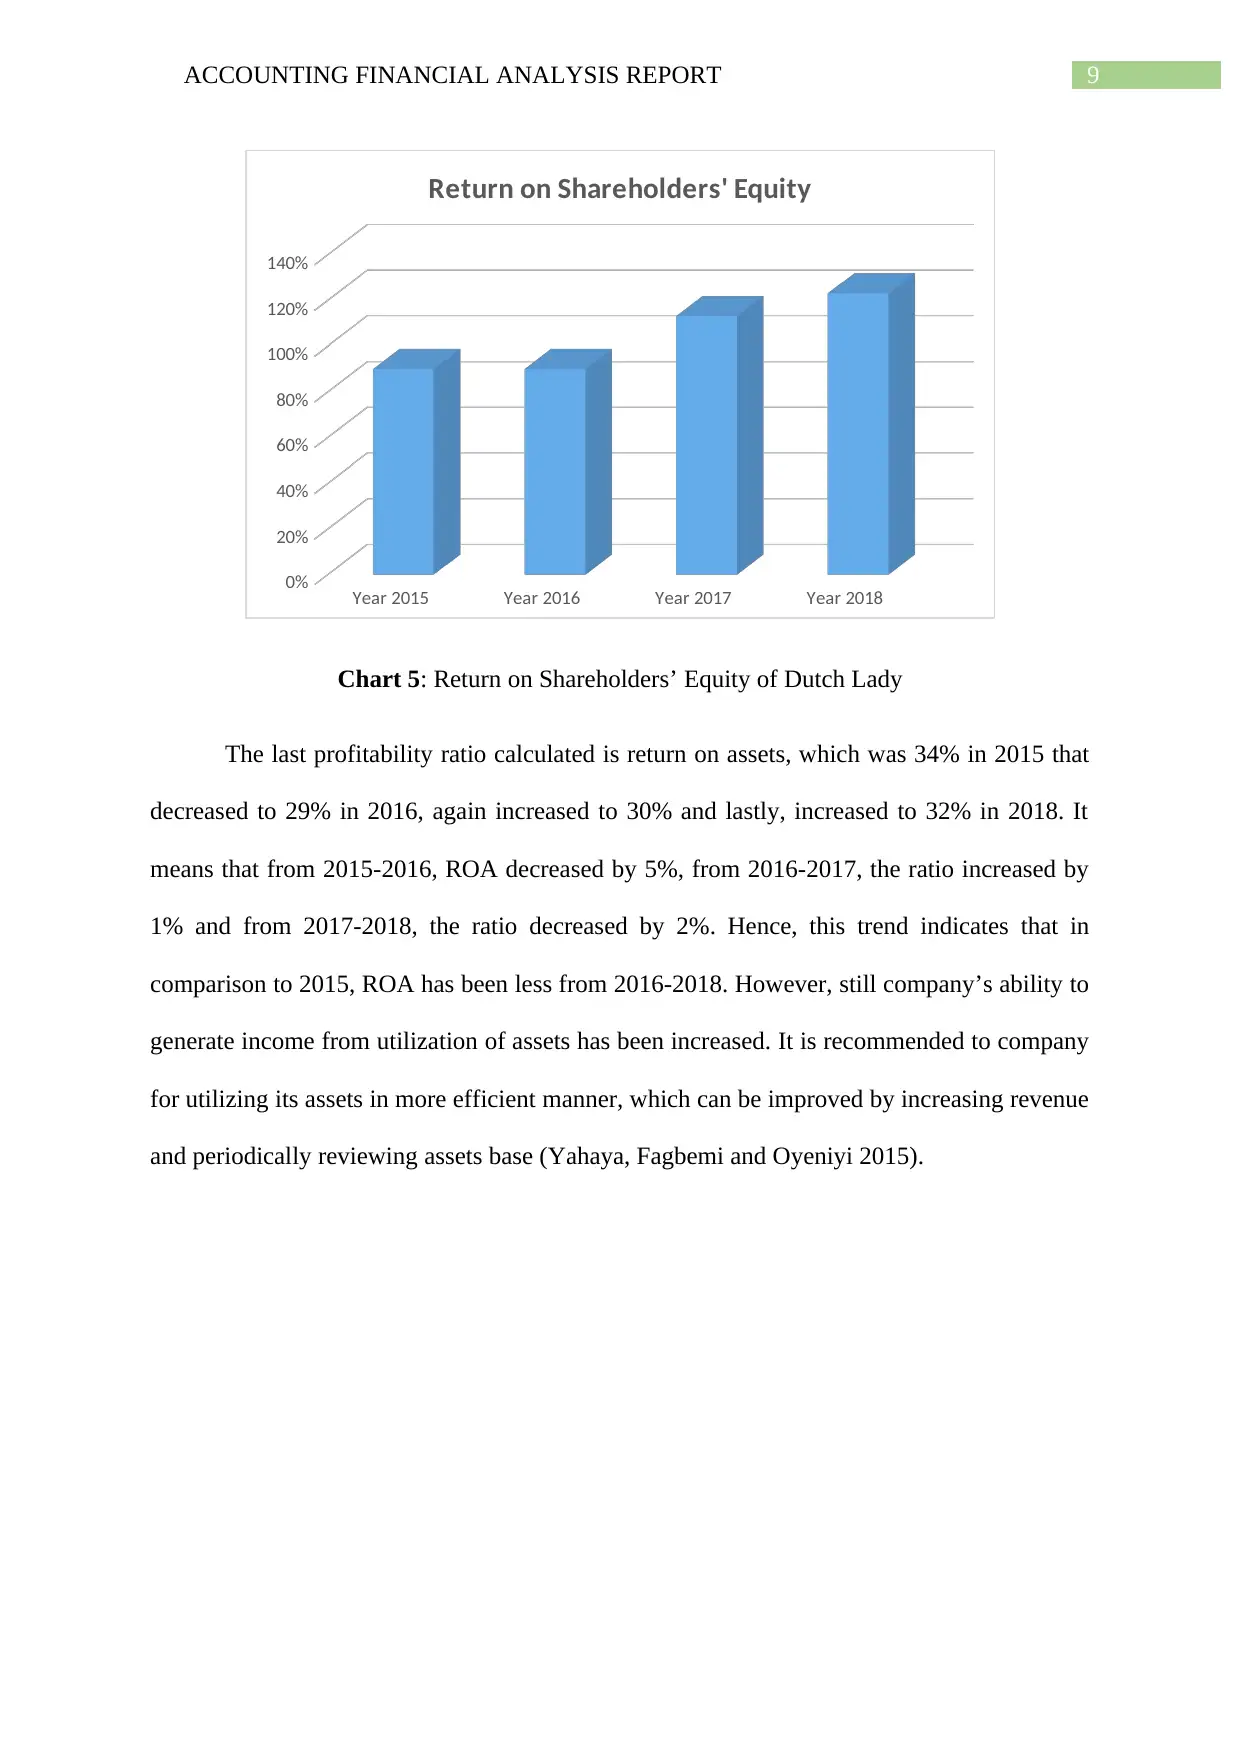
Moreover, return on shareholders’ equity of company was 90% in 2015 and 2016,
which increased to 113% in 2017 and in 2018, the ratio increased to 123%. This implies that
there were no changes of ratio from 2015-2016, however, from 2016-2017, the ratio
increased by 23% and lastly, from 2017-2018, the ratio increased again by 10%. Hence, the
trend indicates that over the years’ company’s ability to generate income from investment of
shareholders has been increased. This is a good indication for company. However, still
company can improve ROE by using more financial leverage and increasing the profit margin
(Das 2015).
earning profit with each dollar of generated sales has been declined over the years but with
the help of controlling cost, company’s profit before tax margin has been increased. Hence, it
is recommended that cost of operations of company should be reduced for earning good profit
before tax margin (Tamke 2019).
Year 2015 Year 2016 Year 2017 Year 2018
0%
2%
4%
6%
8%
10%
12%
14%
16%
18%
20%
Profit Before Tax Margin Ratio
Chart 4: Profit before Tax Margin of Dutch Lady
Moreover, return on shareholders’ equity of company was 90% in 2015 and 2016,
which increased to 113% in 2017 and in 2018, the ratio increased to 123%. This implies that
there were no changes of ratio from 2015-2016, however, from 2016-2017, the ratio
increased by 23% and lastly, from 2017-2018, the ratio increased again by 10%. Hence, the
trend indicates that over the years’ company’s ability to generate income from investment of
shareholders has been increased. This is a good indication for company. However, still
company can improve ROE by using more financial leverage and increasing the profit margin
(Das 2015).
⊘ This is a preview!⊘
Do you want full access?
Subscribe today to unlock all pages.
Trusted by 1+ million students worldwide
9ACCOUNTING FINANCIAL ANALYSIS REPORT
Year 2015 Year 2016 Year 2017 Year 2018
0%
20%
40%
60%
80%
100%
120%
140%
Return on Shareholders' Equity
Chart 5: Return on Shareholders’ Equity of Dutch Lady
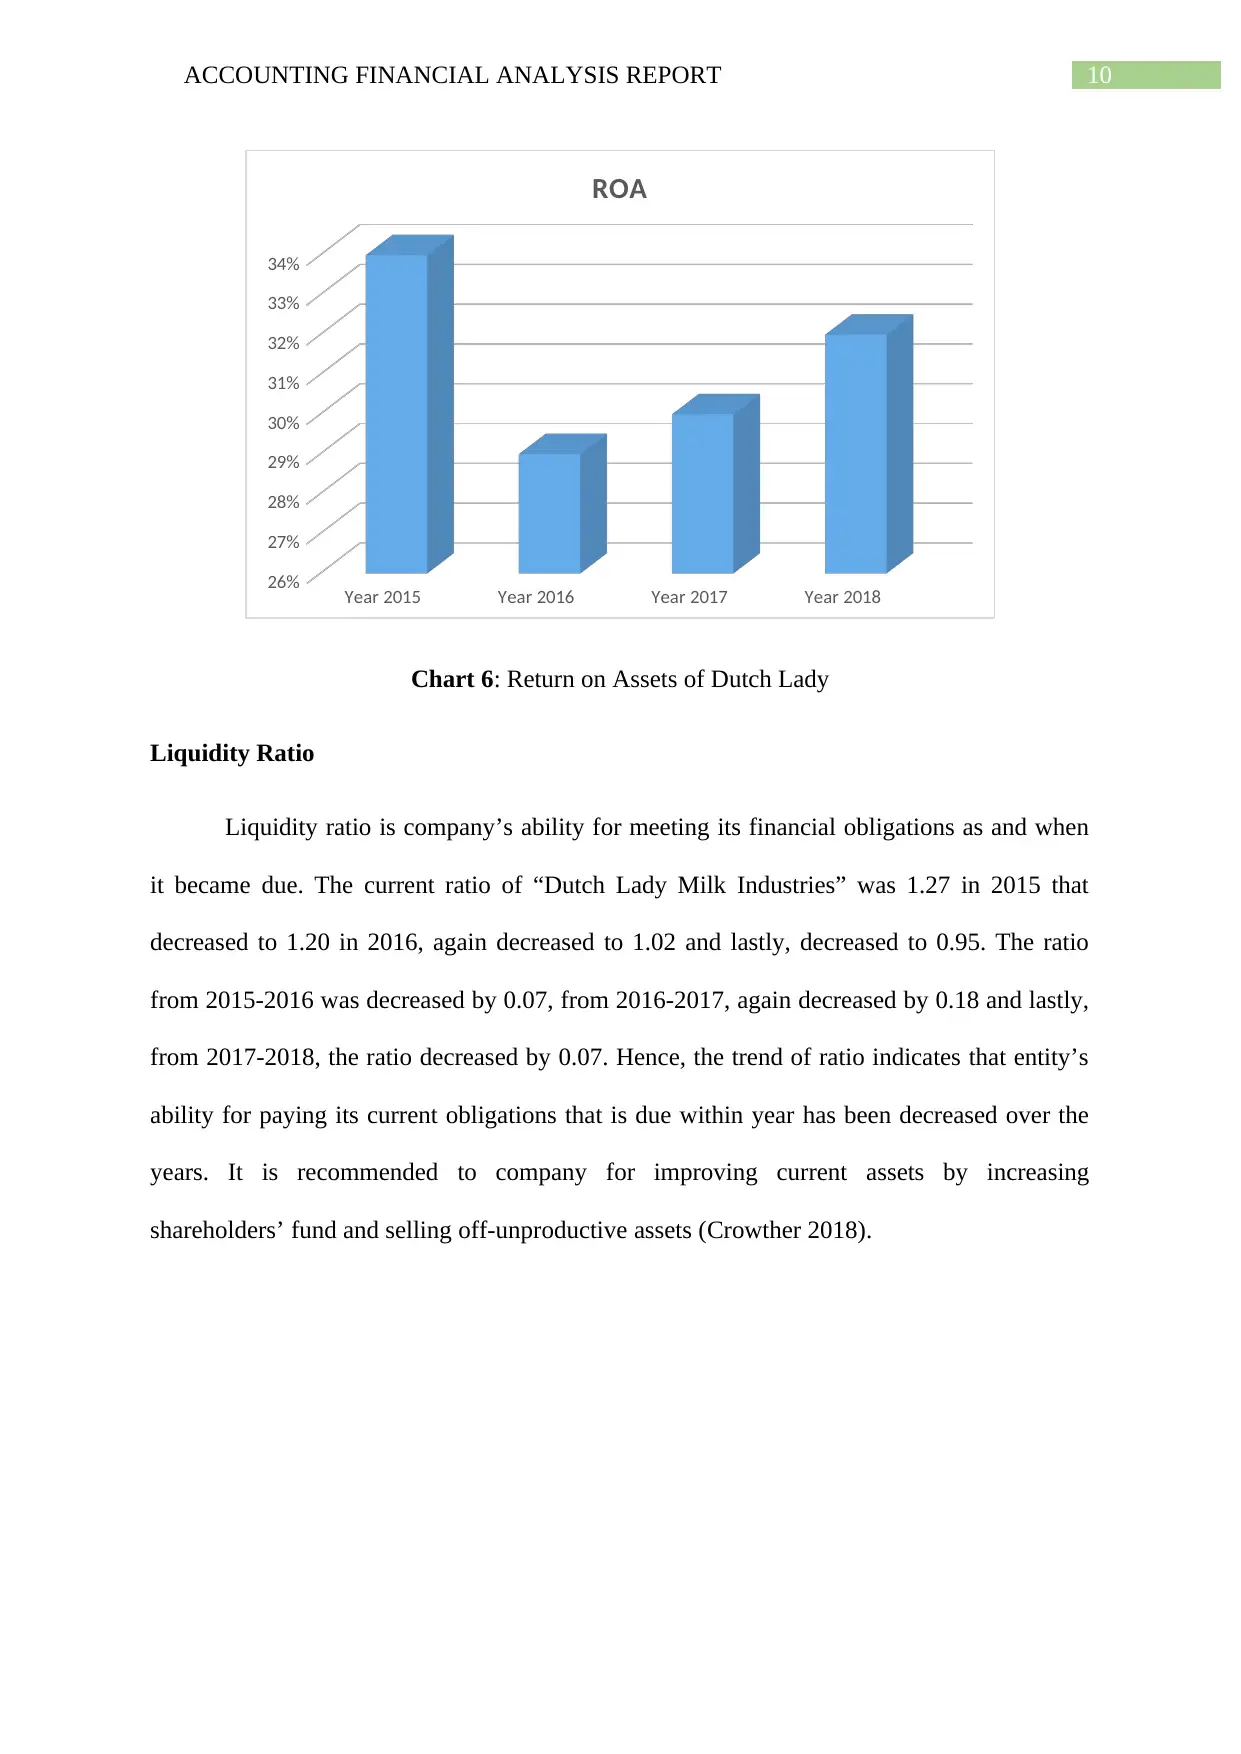
The last profitability ratio calculated is return on assets, which was 34% in 2015 that
decreased to 29% in 2016, again increased to 30% and lastly, increased to 32% in 2018. It
means that from 2015-2016, ROA decreased by 5%, from 2016-2017, the ratio increased by
1% and from 2017-2018, the ratio decreased by 2%. Hence, this trend indicates that in
comparison to 2015, ROA has been less from 2016-2018. However, still company’s ability to
generate income from utilization of assets has been increased. It is recommended to company
for utilizing its assets in more efficient manner, which can be improved by increasing revenue
and periodically reviewing assets base (Yahaya, Fagbemi and Oyeniyi 2015).
Year 2015 Year 2016 Year 2017 Year 2018
0%
20%
40%
60%
80%
100%
120%
140%
Return on Shareholders' Equity
Chart 5: Return on Shareholders’ Equity of Dutch Lady
The last profitability ratio calculated is return on assets, which was 34% in 2015 that
decreased to 29% in 2016, again increased to 30% and lastly, increased to 32% in 2018. It
means that from 2015-2016, ROA decreased by 5%, from 2016-2017, the ratio increased by
1% and from 2017-2018, the ratio decreased by 2%. Hence, this trend indicates that in
comparison to 2015, ROA has been less from 2016-2018. However, still company’s ability to
generate income from utilization of assets has been increased. It is recommended to company
for utilizing its assets in more efficient manner, which can be improved by increasing revenue
and periodically reviewing assets base (Yahaya, Fagbemi and Oyeniyi 2015).
Paraphrase This Document
Need a fresh take? Get an instant paraphrase of this document with our AI Paraphraser
10ACCOUNTING FINANCIAL ANALYSIS REPORT
Year 2015 Year 2016 Year 2017 Year 2018
26%
27%
28%
29%
30%
31%
32%
33%
34%
ROA
Chart 6: Return on Assets of Dutch Lady
Liquidity Ratio
Liquidity ratio is company’s ability for meeting its financial obligations as and when
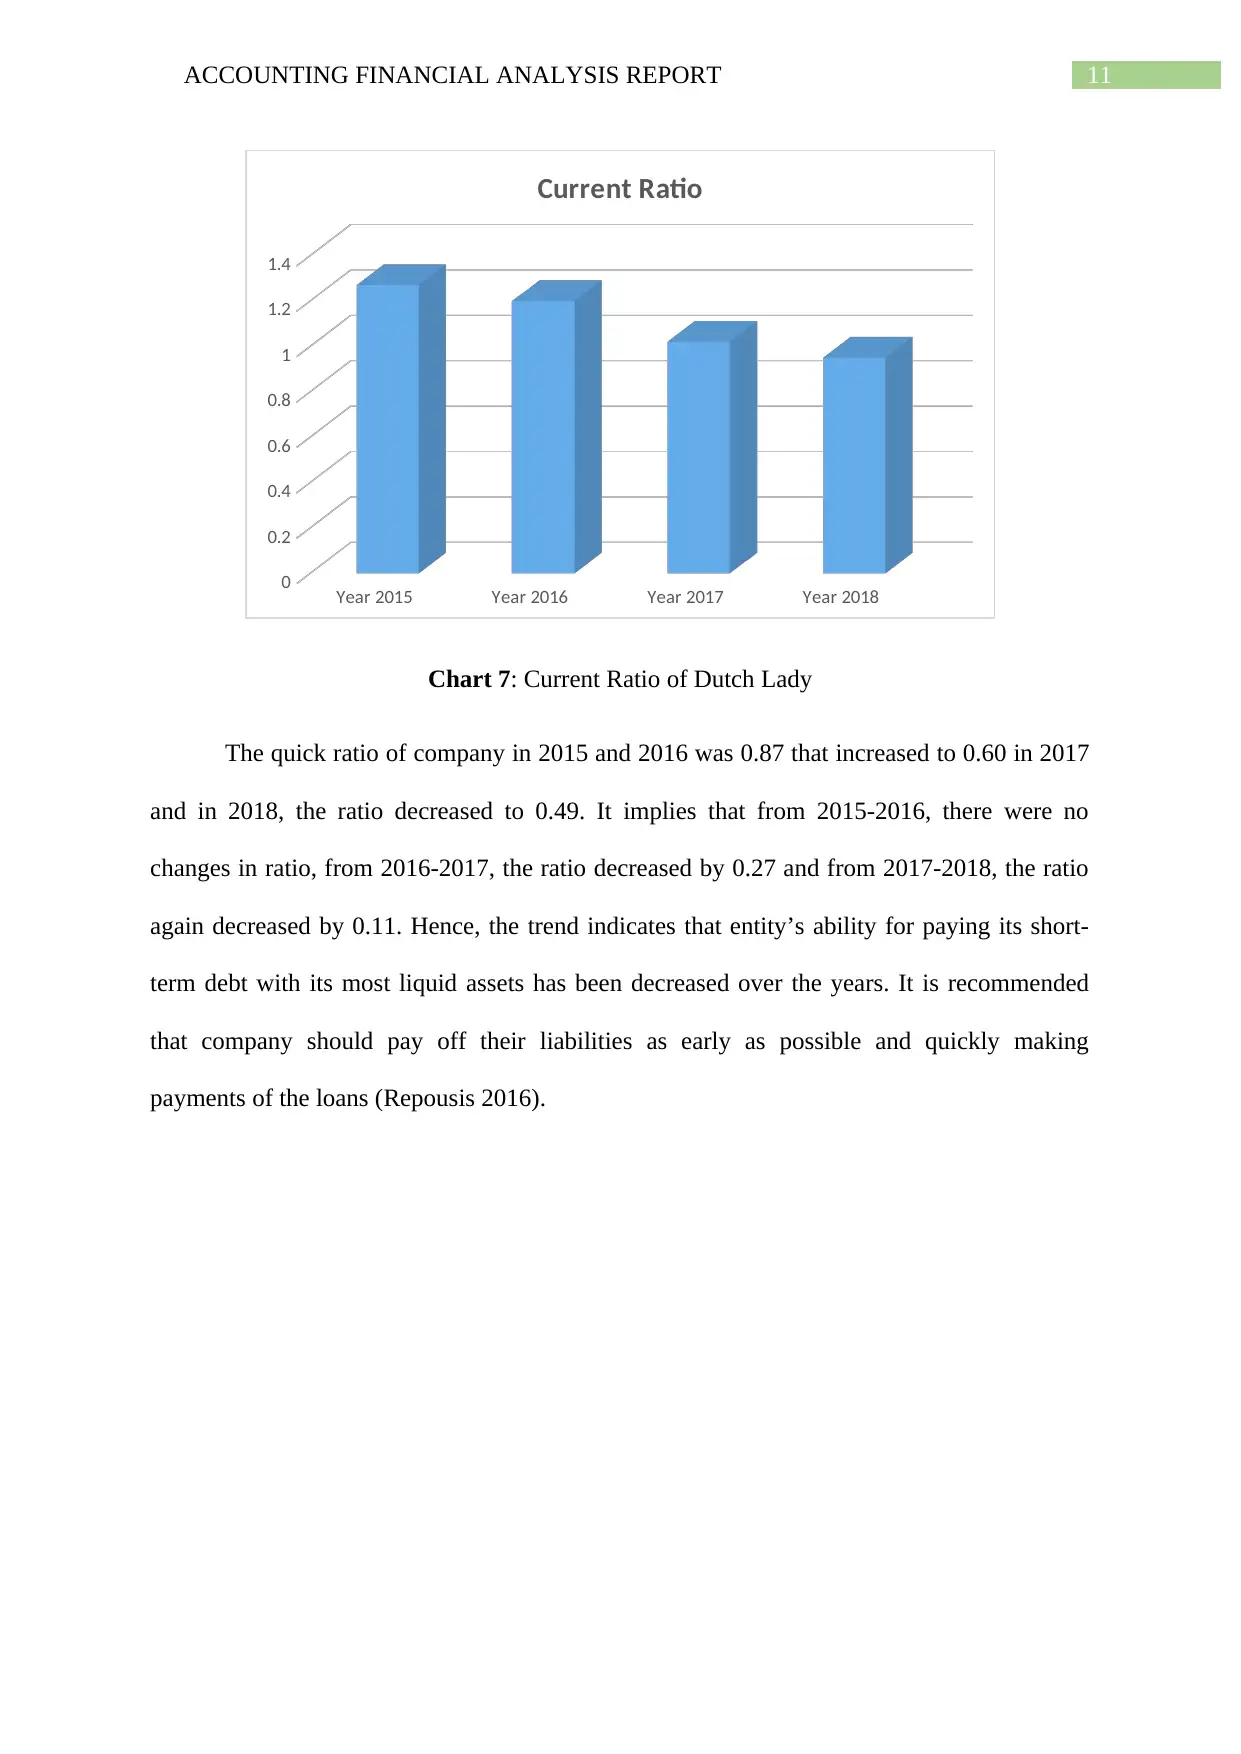
it became due. The current ratio of “Dutch Lady Milk Industries” was 1.27 in 2015 that
decreased to 1.20 in 2016, again decreased to 1.02 and lastly, decreased to 0.95. The ratio
from 2015-2016 was decreased by 0.07, from 2016-2017, again decreased by 0.18 and lastly,
from 2017-2018, the ratio decreased by 0.07. Hence, the trend of ratio indicates that entity’s
ability for paying its current obligations that is due within year has been decreased over the
years. It is recommended to company for improving current assets by increasing
shareholders’ fund and selling off-unproductive assets (Crowther 2018).
Year 2015 Year 2016 Year 2017 Year 2018
26%
27%
28%
29%
30%
31%
32%
33%
34%
ROA
Chart 6: Return on Assets of Dutch Lady
Liquidity Ratio
Liquidity ratio is company’s ability for meeting its financial obligations as and when
it became due. The current ratio of “Dutch Lady Milk Industries” was 1.27 in 2015 that
decreased to 1.20 in 2016, again decreased to 1.02 and lastly, decreased to 0.95. The ratio
from 2015-2016 was decreased by 0.07, from 2016-2017, again decreased by 0.18 and lastly,
from 2017-2018, the ratio decreased by 0.07. Hence, the trend of ratio indicates that entity’s
ability for paying its current obligations that is due within year has been decreased over the
years. It is recommended to company for improving current assets by increasing
shareholders’ fund and selling off-unproductive assets (Crowther 2018).
11ACCOUNTING FINANCIAL ANALYSIS REPORT
Year 2015 Year 2016 Year 2017 Year 2018
0
0.2
0.4
0.6
0.8
1
1.2
1.4
Current Ratio
Chart 7: Current Ratio of Dutch Lady
The quick ratio of company in 2015 and 2016 was 0.87 that increased to 0.60 in 2017
and in 2018, the ratio decreased to 0.49. It implies that from 2015-2016, there were no
changes in ratio, from 2016-2017, the ratio decreased by 0.27 and from 2017-2018, the ratio
again decreased by 0.11. Hence, the trend indicates that entity’s ability for paying its short-
term debt with its most liquid assets has been decreased over the years. It is recommended
that company should pay off their liabilities as early as possible and quickly making
payments of the loans (Repousis 2016).
⊘ This is a preview!⊘
Do you want full access?
Subscribe today to unlock all pages.
Trusted by 1+ million students worldwide
1 out of 25
Related Documents


Your All-in-One AI-Powered Toolkit for Academic Success.
+13062052269
info@desklib.com
Available 24*7 on WhatsApp / Email
![[object Object]](/_next/static/media/star-bottom.7253800d.svg)
Unlock your academic potential
Copyright © 2020–2026 A2Z Services. All Rights Reserved. Developed and managed by ZUCOL.