Financial Performance Analysis of Pandora A/S: A Detailed Report
VerifiedAdded on 2023/06/04
|31
|8895
|266
Report
AI Summary
This report offers a comprehensive financial and strategic analysis of Pandora A/S, a prominent jewelry designer and manufacturer. It begins with an executive summary that highlights key findings, including macroeconomic factors, industry analysis, competitive strategies, and accounting and financial evaluations. The analysis delves into the company's business and strategic aspects, examining macroeconomic influences, industry dynamics, and competitive positioning compared to Georg Jensen. The report also covers accounting analysis, identifying key balance sheet accounts and potential risks. A significant portion is dedicated to financial analysis, including ROE, Dupont analysis, and various financial ratios, alongside a cross-sectional comparison. The study identifies the company's competitive strengths, such as design and quality, and potential red flags, such as increasing costs and supply chain issues. The findings suggest that while Pandora A/S holds a strong position, external factors and internal challenges could impact future performance. The report concludes with recommendations based on the analysis.
Running head: FINANCIAL ANALYSIS
Financial Analysis
Name of Student:
Name of University:
Author’s Note:
Financial Analysis
Name of Student:
Name of University:
Author’s Note:
Paraphrase This Document
Need a fresh take? Get an instant paraphrase of this document with our AI Paraphraser
1FINANCIAL ANALYSIS
Executive Summary
The discourse of the report has stated about both financial and non-financial analysis of Pandora
A/S. Some of the main analysis includes macroeconomic factors affecting the company,
identification of the overall industry, competitive and corporate strategy, accounting analysis and
financial analysis. In addition to this, the study has also stated about cross-sectional analysis of
Pandora. The findings have revealed the company offers wide range of precious stones and high-
quality gold and silver jewellery and alternatives to such products is seen to be low in the market.
Moreover, Pandora A/S follows a competitive pricing strategy. The important nature of
competitive strengths of Pandora A/S are depicted in terms of designs and quality of jewellery as
agility of the value chain and an improved focus on the sustainability. The overall financial
comparison of both the companies has been able to state that Pandora A/S is significantly in a
better position in terms of current assets, current liabilities and stockholders’ equity compared to
its selected competitor Georg Jensen. However, the three potential red flag areas for the company
is identified with increasing nature of cost of goods sold, uncertainties associated with new
designs of jewellery and problems with fluctuations in the supply chain market. Based on the
cross-sectional findings it can be seen that fall in the ROE for both Pandora A/S and Georg
Jensen in the recent years may be a result of the macroeconomic changes which had significantly
affected the jewellery designers of Copenhagen.
2FINANCIAL ANALYSIS
Table of Contents
Introduction.....................................................................................................................................................................4
1. Business and Strategic Analysis.................................................................................................................................4
Analysis of the economy............................................................................................................................................4
Macroeconomic Factors affecting Pandora...........................................................................................................4
Industry analysis........................................................................................................................................................5
Identification of the Industry.................................................................................................................................5
Identification of the Competitor Company...........................................................................................................5
Porters Five Force Analysis with Assessment......................................................................................................5
Industry’s Growth Potential..................................................................................................................................6
Company’s competitive and corporate strategy.........................................................................................................7
Company’s competitive strategy, risk factors and growth potential.....................................................................7
Company’s corporate strategy...............................................................................................................................8
2. Accounting Analysis...................................................................................................................................................8
Three Key Accounts in the balance sheet of both the company...........................................................................8
Evaluating the quality of disclosure......................................................................................................................9
Identifying 3 potential red flags for the company.................................................................................................9
3. Financial Analysis.....................................................................................................................................................10
ROE.....................................................................................................................................................................10
Dupont Analysis..................................................................................................................................................11
Financial Analysis...............................................................................................................................................11
Operating management Ratios............................................................................................................................11
Investment management Ratio............................................................................................................................15
Financial Leverage Ratios...................................................................................................................................17
Cross-sectional analysis...........................................................................................................................................18
Recommendations.........................................................................................................................................................19
Conclusion....................................................................................................................................................................20
References.....................................................................................................................................................................21
List of Appendix...........................................................................................................................................................23
Comprehensive Income............................................................................................................................................23
Financial Position.....................................................................................................................................................25
Dupont Method........................................................................................................................................................27
Cross Functional Analysis.......................................................................................................................................28
Financial Ratios........................................................................................................................................................29
Financial Figures......................................................................................................................................................30
Prospective Analysis................................................................................................................................................30
⊘ This is a preview!⊘
Do you want full access?
Subscribe today to unlock all pages.
Trusted by 1+ million students worldwide
3FINANCIAL ANALYSIS
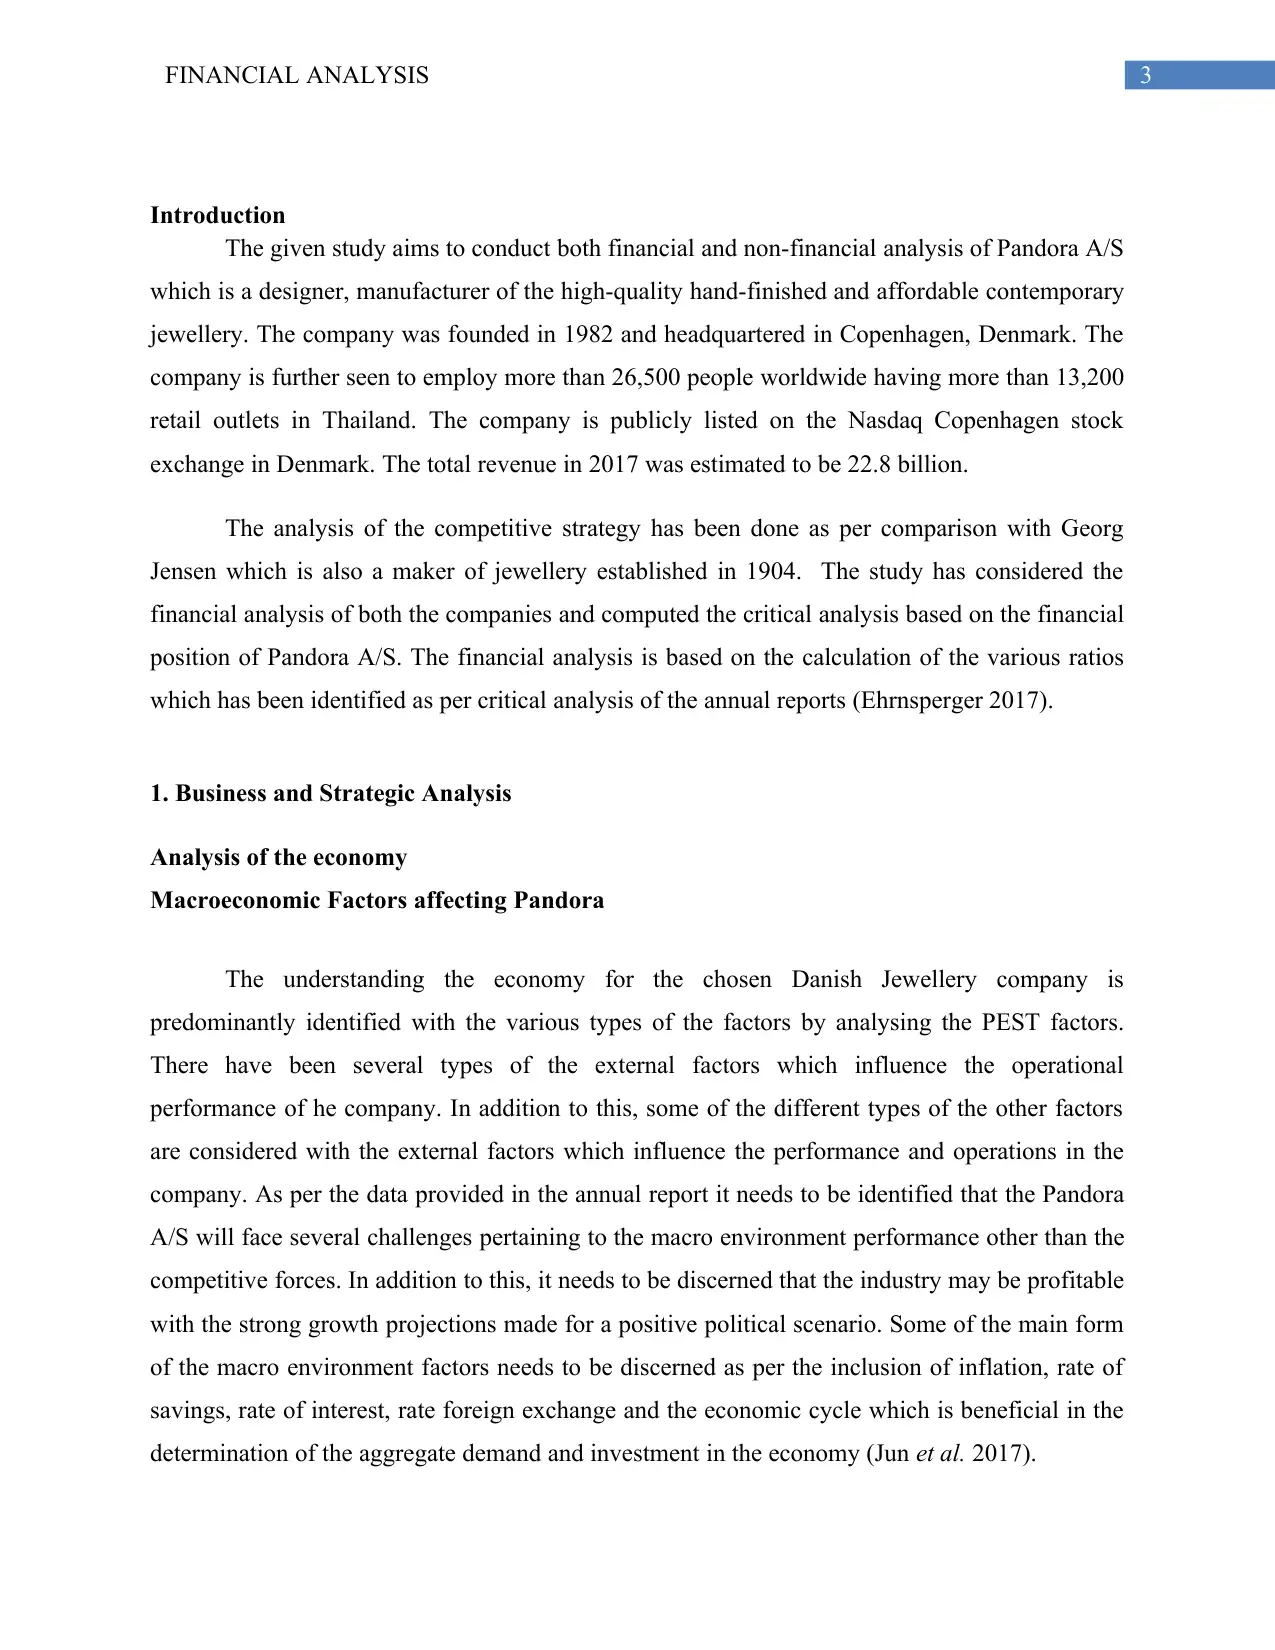
Introduction
The given study aims to conduct both financial and non-financial analysis of Pandora A/S
which is a designer, manufacturer of the high-quality hand-finished and affordable contemporary
jewellery. The company was founded in 1982 and headquartered in Copenhagen, Denmark. The
company is further seen to employ more than 26,500 people worldwide having more than 13,200
retail outlets in Thailand. The company is publicly listed on the Nasdaq Copenhagen stock
exchange in Denmark. The total revenue in 2017 was estimated to be 22.8 billion.
The analysis of the competitive strategy has been done as per comparison with Georg
Jensen which is also a maker of jewellery established in 1904. The study has considered the
financial analysis of both the companies and computed the critical analysis based on the financial
position of Pandora A/S. The financial analysis is based on the calculation of the various ratios
which has been identified as per critical analysis of the annual reports (Ehrnsperger 2017).
1. Business and Strategic Analysis
Analysis of the economy
Macroeconomic Factors affecting Pandora
The understanding the economy for the chosen Danish Jewellery company is
predominantly identified with the various types of the factors by analysing the PEST factors.
There have been several types of the external factors which influence the operational
performance of he company. In addition to this, some of the different types of the other factors
are considered with the external factors which influence the performance and operations in the
company. As per the data provided in the annual report it needs to be identified that the Pandora
A/S will face several challenges pertaining to the macro environment performance other than the
competitive forces. In addition to this, it needs to be discerned that the industry may be profitable
with the strong growth projections made for a positive political scenario. Some of the main form
of the macro environment factors needs to be discerned as per the inclusion of inflation, rate of
savings, rate of interest, rate foreign exchange and the economic cycle which is beneficial in the
determination of the aggregate demand and investment in the economy (Jun et al. 2017).
Paraphrase This Document
Need a fresh take? Get an instant paraphrase of this document with our AI Paraphraser
4FINANCIAL ANALYSIS
On the contrary, the micro environment factors are seen to be depicted in terms of the
consideration of the various types of the factors such as economic indicators in the jewellery
industry and consumer spending. Some of the other micro environment factors need to be
identified as per the growth rate, inflation and industry’s economic indicators.
Industry analysis
Identification of the Industry
The industry analysis of Pandora A/S is identified with the market factors which
influence the developmental initatives in the company. These factors are considered to influence
the competitors and market which involve the appropriate and supplier. The industry in which
Pandora A/S operates has been depicted with jewellery manufacturer and retailer. The total
market share of the company is seen as DKK 110.03m (Chandra 2017).
Identification of the Competitor Company
The analysis of the competitor company is identified with Georg Jensen which is dealing
with the same products. The overall EBIT margin of the company increased from 17 DKK
million in 2015 to 55 DKK million in 2016. The EBIT margin further increased to 74 DKK
million in 2017. It needs to be further identified that Pandora A/S and Georg Jensen needs to be
considered as the pioneers in the Danish jewellery business. However, in terms of market share it
is discerned that Pandora A/S is clearly in a better position in compared to Georg Jensen
(Fibre2fashion.com. 2018).
Porters Five Force Analysis with Assessment
The consideration of Porter’s five forces framework is inferred to be conducive in terms
of following points:
Threat of new entrants: As a jewellery manufacturer it is important for considering the new
procedures and the business strategies followed by Pandora A/S which has been mainly
considered with competitive pricing strategy. The threat of new entrant has been seen to be
moderate in nature.
5FINANCIAL ANALYSIS
Bargaining power of the suppliers: The suppliers powerful in the consumer sector has been
seen to be based on the posing a negotiating power and charge higher price. This will
significantly impact on the bargaining position of the suppliers and profitability. Therefore,
suppliers have a high bargaining power (Fischer, A. and Pascucci 2017).
Bargaining power of the Buyers: It can prove to be difficult for Pandora A/S to earn profit in
the long-run. However, in the jewellery business in Copenhagen the consumers have a relatively
low bargaining power.
Threat of the substitutes: The company offers wide range of precious stones and high-quality
gold and silver jewellery and alternatives to such products is seen to be low in the market.
Competitor rivalry: The competitive rivalry in the operating industry for Pandora A/S is
depicted with other players such as Ole Lynggaard Copenhagen, Georg Jensen Silver, Marlene
Juhl Jørgensen Fine Jewellery, Zarah Voigt Boutique, Julie Sandlau Flagship Store, Ladyfingers,
Marianne Dulong, Jane Kønig Store and House of Amber. Henceforth, the competitive rivalry in
the industry is seen to be very high (Fleisher, C. S., & Bensoussan, B. E. 2015).
Industry’s Growth Potential
In the last few years, the Danish fashion industry went through several paradigms
associated with luxury retailers and changes in the high-street trend. The brands such as Ganni,
Saks Potts and Stine Goya are seen to be conquering the fashion business by combination of
fashionable trends and jewellery. At present the company has been able to get a prime spot in the
market which is seen to be associated to the various type of the services which are seen to be
based on international consumers and trendsetting influencers. The main mission of the company
has been seen to be associated to the various types of the functions which are depicted to be
considered with created a dedicated market for Danish and Scandinavian at the time of
Copenhagen Fashion Week (Giannakis and Papadopoulos 2016).
In the 11th edition, the jewellery room is seen to be supported with large number of
emerging talents ranging from Maria Black, Orit Elhanati and Pernille Lauridse. Moreover, the
potential of the jewellery pressroom is seen with the industry dedicated to the online space in
which the brands are organised in one single roof. The Jewellery Room is depicted to be
⊘ This is a preview!⊘
Do you want full access?
Subscribe today to unlock all pages.
Trusted by 1+ million students worldwide
6FINANCIAL ANALYSIS
conducive with the various types of services which are associated with the changes brought to
Danish fashion. Moreover, the Danish Jewellery is often boosted with the changes among the
consumer behaviour which are seen with the increasing nature of daring designs and strong
storytelling. The brands such as Ole Lynggard’s masterful designs, Georg Jensen’s has created a
serval collaboration with the new artists which are depicted with the Nadia Shelbaya’s playful
pearl and gold creations. In addition to this, some of the other designer jewellery stores such as
Matchesfashion.com is also considered with assessment of the exact requirement of the clients
(Grant 2016).
Company’s competitive and corporate strategy
Company’s competitive strategy, risk factors and growth potential
The competitive strengths of Pandora A/S are depicted in terms of designs and quality of
jewellery as agility of the value chain and an improved focus on the sustainability. The company
has maintained its brand as a leader of affordable player in the jewellery segment and often
referred as the largest producer of jewellery as per the pieces crafted. The main USP of the
company is identified in terms of quality and craftmanship. It is further depicted to innovate with
the designs which enhances the overall value chain. Moreover, the experience offered by
Pandora sets it apart from the other competitors. The company further involved in several types
of the risk awareness programs which are depicted to be aimed at increasing the awareness of the
risk management and appointment of the persons in each region where the operations exists. As
the company is involved with significant number of markets there is ample scope of growth
opportunity and earnings (Hill et al. 2014).
Georg Jensen has taken continued initiative to modernise the overall retail business and
making improvement to the digital shopping capabilities. This is seen to be based on
rationalising the network of physical shops. This has been further marked with an important step
for competing in an omni-channel approach which will prove to be more powerful and
competitively advantageous to the company. The business management done by the company
has been considered with the segregation of the risk as per commercial risk, logistics risk,
production facilities, IT breakdown, employees, brand and image. The company manages the
various types of the financial risk in terms of the monitoring the foreign exchange fluctuations.
Paraphrase This Document
Need a fresh take? Get an instant paraphrase of this document with our AI Paraphraser
7FINANCIAL ANALYSIS
The management of the company expects a significant growth potential in the operating profit
segment (ATARERE et al. 2016).
Company’s corporate strategy
The strategic business strategies of Pandora A/S acts as the pillars for providing the right
direction to the consumers. Some of the main aspects of the corporate strategy are discerned as
per Innovate affordable jewellery, Agile manufacturing, Digitalised brand experience and
success in the omni-channel retail.
The business strategy adopted by Georg Jensen is considered with clear focus and
foundation on the performance improvements which will ensure continuous improvement for the
company. The business risk of the company is set in such a way that they are related to the brand
reputation, followed with a proactive communications strategy and which is consistent with the
communication efforts and public relations. The contribution of UN Global Compact signatory is
also seen to play a pivotal role in the formulation of the business strategy of the company (Prause
2014).
2. Accounting Analysis
Three Key Accounts in the balance sheet of both the company
The assessment of the main accounts for Pandora A/S in the balance sheet are identified
with current assets, current liabilities and stockholders’ equity. The current assets compose of the
accounts such as inventories, Derivative financial instruments, Trade receivables, Income tax
receivable, other receivable and cash. The total balance is depicted to increase from DKK 6356
m in 2016 to 6744 m in 2017. The accounts under the current liabilities are identified with
Derivative financial instruments, Trade payables, Income tax payable, loans and borrowings. The
total balance of the liabilities is identified to increase from DKK 8291 m in 2016 to DKK 10726
m in 2017. The accounts under equity is seen with Share capital, treasury shares, reserves,
dividend proposed and retained earnings. The total equity of the company increased from DKK
6794 m in 2016 to DKK 6514 m in 2017 (Euwema et al. 2014).
8FINANCIAL ANALYSIS
Similarly, the current assets for Georg Jensen is considered with items such as trade
receivables, receivables from the group enterprises, other receivables, deferred tax assets and
prepayments. The items under the current liabilities account needs to be seen with credit
institutions, trade payables, payables to the group enterprises, corporation tax and other payables.
The total balance of the current liabilities increased from DKK 3331m in 2016 to DKK 3847m in
2017. The total equity consists of the accounts such as share capital, share premium account,
Reserve for development costs and retained earnings. The total equity of Georg Jensen decreased
from DKK 4576 in 2016 to DKK 4154 m in 2017 (Renz 2016).
Evaluating the quality of disclosure
The preparation of the annual report of Pandora A/S has been prepared as per
International “Financial Reporting Standards (IFRS)” which has adopted the guidelines as
prescribed by EU and additional Danish disclosure requirements. The consolidation of the
financial statement is further seen to be based on the various types of the disclosures as stated
under Group’s and the Parent Company’s operations.
The preparation of the annual report of Georg Jensen is depicted to be in accordance with
the “International Standards on Auditing (ISAs)” along with the additional requirements which
are Applicable in Denmark. The company’s independent activities are seen to be considered as
per the “Inter-national Ethics Standards Board for Accountants’ Code of Ethics for
Professional Accountants (IESBA Code)” (Barr and McClellan 2018).
Identifying 3 potential red flags for the company
The three potential red flag areas of the company are seen in terms of commodity,
product development, Crafting and Supply Chain Major Market. The potential red flag
associated to the commodity is considered with the increase in the cost of goods for the range of
products offered by the company. In addition to this, the risk areas are also seen to be evident in
terms of the changes in the raw material cost especially gold and silver. Secondly, the red flag
area in the product development are considered as per the uncertainties pertaining to the new
jewellery designs do not adhere to the customer expectations or gain the desired traction in the
markets. Crafting and Supply Chain Major Market may get affected by large number of reasons
⊘ This is a preview!⊘
Do you want full access?
Subscribe today to unlock all pages.
Trusted by 1+ million students worldwide
9FINANCIAL ANALYSIS
which are seen to be based on the factors impacting on the stability of the supply chain.
However, these are not seen to be limited to the loss of suppliers, disasters pertaining to the
physical IT infrastructure at the crafting facilities and the distribution centres. There is a potential
risk of interruption in the sourcing, manufacturing and/or delivery activities (Balazs et al. 2016).
The potential red flag areas for Georg Jensen are concerned with business aspects,
financial and external risk concerns. The concerns related to the business risk are based on the
commercial red flag areas which are evident among the consumption of the luxury goods. Some
of the other concerns are also related to logistics risk and production facilities. The red flag areas
of the financial concerns are seen to be based on increased exposure to the foreign exchange
flections. These concerns are also depicted as per the changes variations in the commodity prices
of gold, silver, steel, brass, precious stones. The third red flag area of external risk is considered
with the different types of the issues such as the macroeconomic factors. At times it may not be
possible for the company to predict the sales which allows for flexible planning and discern the
appropriate impact of the cyclical economic trends (Karadag 2015).
3. Financial Analysis
ROE
d) Efficiency Ratio Analysis: -
Pandora A/S Georg Jensen
2017 2016 2015 2017 2016 2015
Net Income 5768 6025 3688 -35.0 -107.0 -111.0
Total Equity 1595 1999.5 2241 4154 4576 4698
Book Value per share 675.5 924 872 630.00 540.00 650.00
Return on Equity 3.62 3.01 1.65 -0.01 -0.02 -0.02
Price to Earnings Ratio 3.42 3.25 3.12 27.4 29.3 29.6
Price to Book Value Ratio 675.5 924 872 630 540 650
2015 2016 2017
Pandora A/S 1.65 3.01 3.62
Georg Jensen -0.02 -0.02
-
0.01
Paraphrase This Document
Need a fresh take? Get an instant paraphrase of this document with our AI Paraphraser
10FINANCIAL ANALYSIS
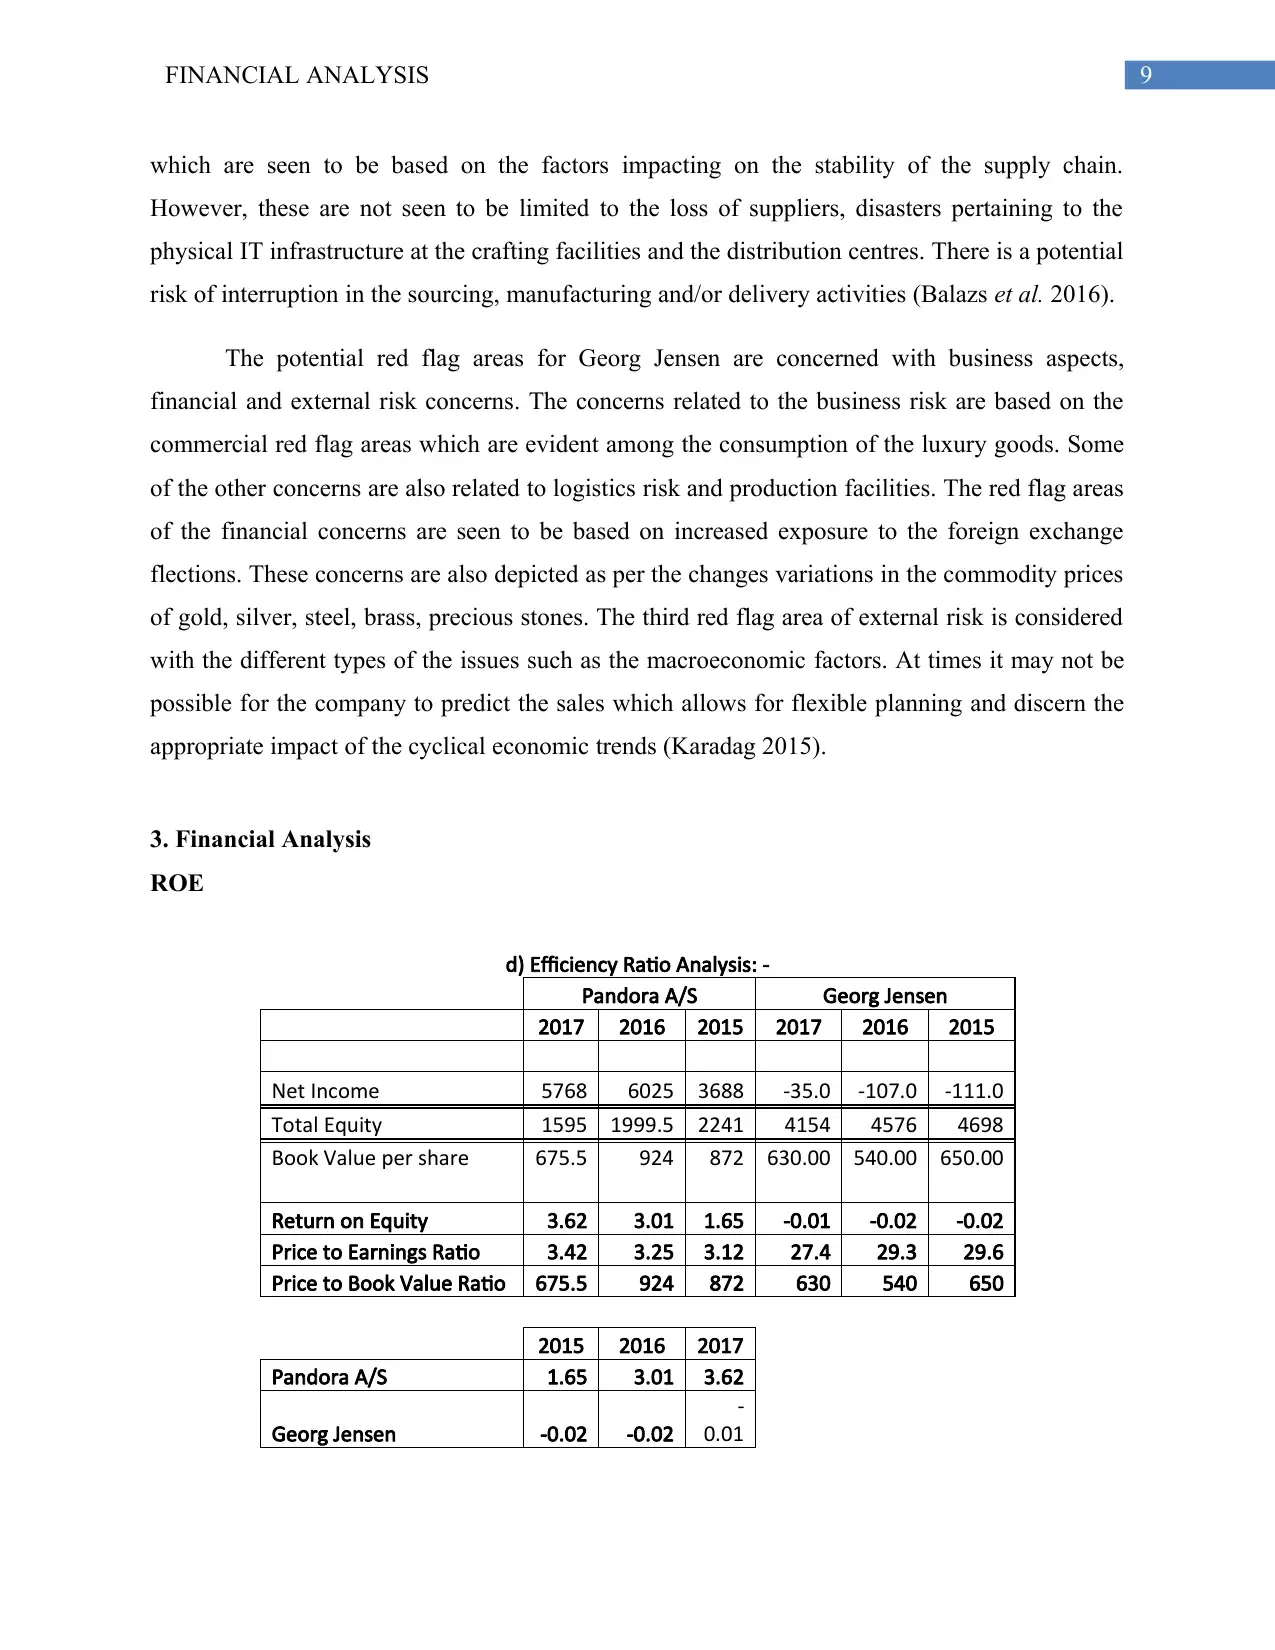
The ROE of Pandora A/S is in a better position in compared to Georg Jensen. This is
evident with the increase of 1.65 in 2015, 3.01 in 2016 and 3.62 in 2017. On the other hand,
Georg Jensen has considerably struggled to maintain a good net income in terms of total asset
and total equity.
Dupont Analysis
Dupont Analysis
Pandora A/S Georg Jensen
Particulars 2017 2016 2015 2017 2016 2015
Net Income 5768 6025 3688 -35 -107 -111
Total Asset 2409.6 2566.8 2684.6 9556.437 9001.985 8587.064
Total
Equity 1595 1999.5 2241 6239 4798 5385
ROE 3.62 3.01 1.65 -0.01 -0.02 -0.02
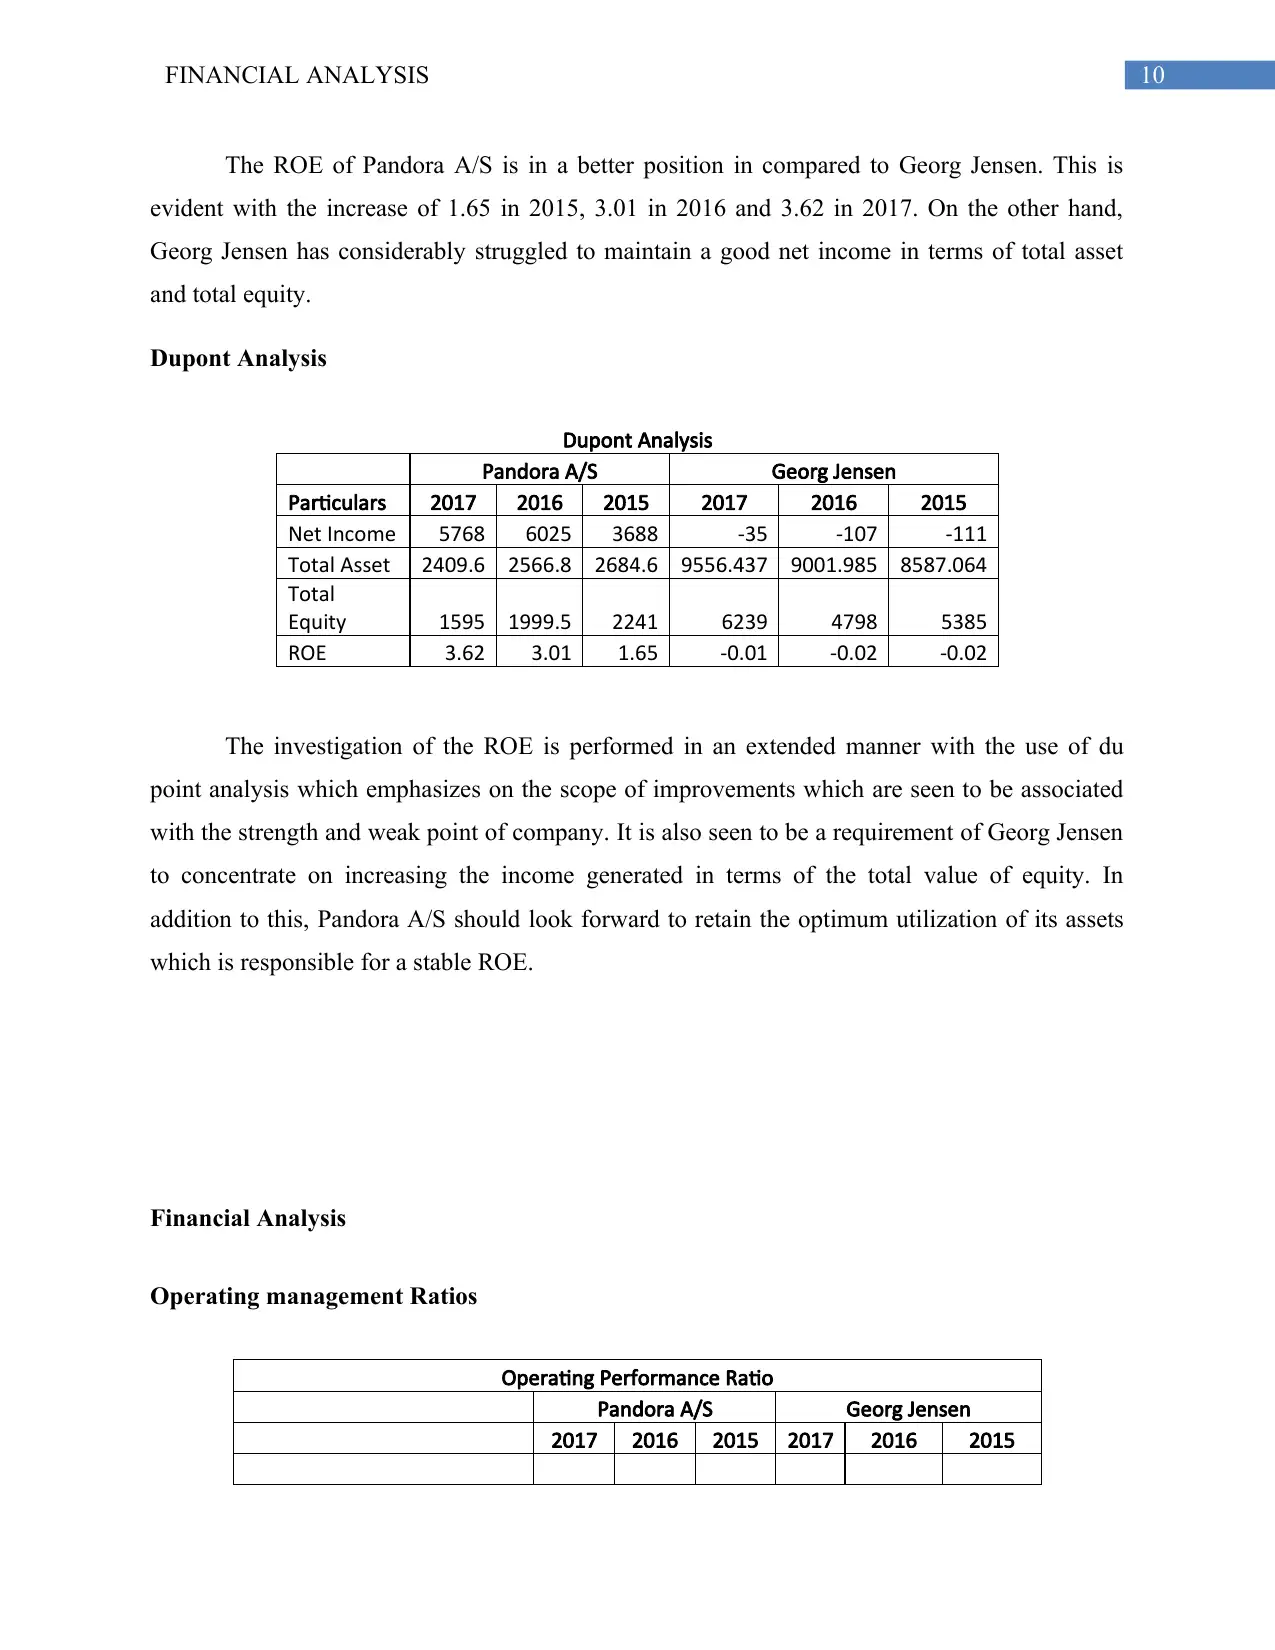
The investigation of the ROE is performed in an extended manner with the use of du
point analysis which emphasizes on the scope of improvements which are seen to be associated
with the strength and weak point of company. It is also seen to be a requirement of Georg Jensen
to concentrate on increasing the income generated in terms of the total value of equity. In
addition to this, Pandora A/S should look forward to retain the optimum utilization of its assets
which is responsible for a stable ROE.
Financial Analysis
Operating management Ratios
Operating Performance Ratio
Pandora A/S Georg Jensen
2017 2016 2015 2017 2016 2015
The ROE of Pandora A/S is in a better position in compared to Georg Jensen. This is
evident with the increase of 1.65 in 2015, 3.01 in 2016 and 3.62 in 2017. On the other hand,
Georg Jensen has considerably struggled to maintain a good net income in terms of total asset
and total equity.
Dupont Analysis
Dupont Analysis
Pandora A/S Georg Jensen
Particulars 2017 2016 2015 2017 2016 2015
Net Income 5768 6025 3688 -35 -107 -111
Total Asset 2409.6 2566.8 2684.6 9556.437 9001.985 8587.064
Total
Equity 1595 1999.5 2241 6239 4798 5385
ROE 3.62 3.01 1.65 -0.01 -0.02 -0.02
The investigation of the ROE is performed in an extended manner with the use of du
point analysis which emphasizes on the scope of improvements which are seen to be associated
with the strength and weak point of company. It is also seen to be a requirement of Georg Jensen
to concentrate on increasing the income generated in terms of the total value of equity. In
addition to this, Pandora A/S should look forward to retain the optimum utilization of its assets
which is responsible for a stable ROE.
Financial Analysis
Operating management Ratios
Operating Performance Ratio
Pandora A/S Georg Jensen
2017 2016 2015 2017 2016 2015
11FINANCIAL ANALYSIS
Net Sales 22781 20281 16737 1089 1091 1144
Total Fixed Assets 2324 1767 1237 0 54.00 47.00
Total no. of employees 20904 17770 13971 1287
1352.0
0 1440.00
Days Inventory Outstanding 8 8 6 0 1.12 1.45
Days Sales Outstanding 62 56 46 3 3 3
Days Payable Outstanding 5 4 4 3 3 3
Operating Expense 9182 7819 6379 39 15.00 76.00
Fixed Asset Turnover Ratio 37.24 31.80 26.98 Nil 18.07 15.00
Sales/Revenue Per Employee 1.09 1.14 1.20 0.85 0.81 0.79
Operating Cycle 75 68 56 5.75 7.06 7.23
Operating Ratio 40% 39% 38% 4% 1% 7%
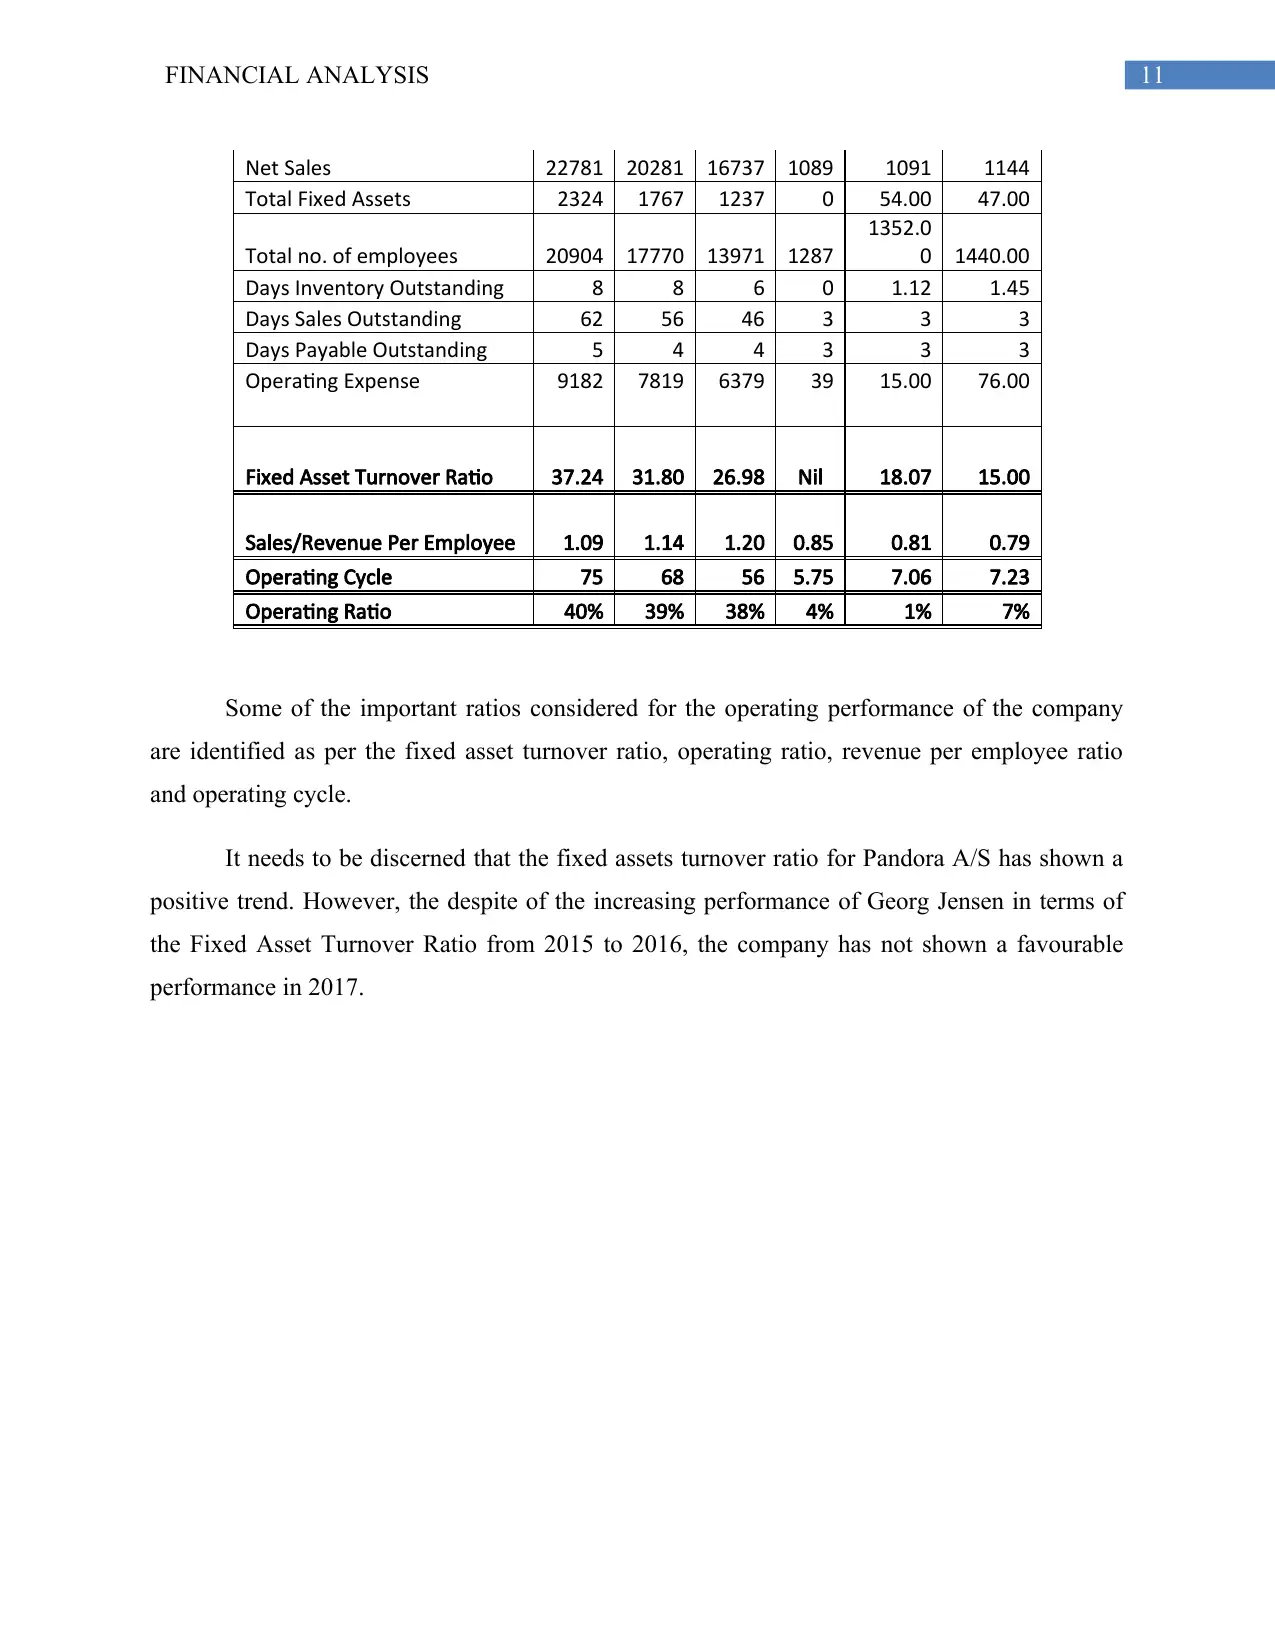
Some of the important ratios considered for the operating performance of the company
are identified as per the fixed asset turnover ratio, operating ratio, revenue per employee ratio
and operating cycle.
It needs to be discerned that the fixed assets turnover ratio for Pandora A/S has shown a
positive trend. However, the despite of the increasing performance of Georg Jensen in terms of
the Fixed Asset Turnover Ratio from 2015 to 2016, the company has not shown a favourable
performance in 2017.
Net Sales 22781 20281 16737 1089 1091 1144
Total Fixed Assets 2324 1767 1237 0 54.00 47.00
Total no. of employees 20904 17770 13971 1287
1352.0
0 1440.00
Days Inventory Outstanding 8 8 6 0 1.12 1.45
Days Sales Outstanding 62 56 46 3 3 3
Days Payable Outstanding 5 4 4 3 3 3
Operating Expense 9182 7819 6379 39 15.00 76.00
Fixed Asset Turnover Ratio 37.24 31.80 26.98 Nil 18.07 15.00
Sales/Revenue Per Employee 1.09 1.14 1.20 0.85 0.81 0.79
Operating Cycle 75 68 56 5.75 7.06 7.23
Operating Ratio 40% 39% 38% 4% 1% 7%
Some of the important ratios considered for the operating performance of the company
are identified as per the fixed asset turnover ratio, operating ratio, revenue per employee ratio
and operating cycle.
It needs to be discerned that the fixed assets turnover ratio for Pandora A/S has shown a
positive trend. However, the despite of the increasing performance of Georg Jensen in terms of
the Fixed Asset Turnover Ratio from 2015 to 2016, the company has not shown a favourable
performance in 2017.
⊘ This is a preview!⊘
Do you want full access?
Subscribe today to unlock all pages.
Trusted by 1+ million students worldwide
1 out of 31


Your All-in-One AI-Powered Toolkit for Academic Success.
+13062052269
info@desklib.com
Available 24*7 on WhatsApp / Email
![[object Object]](/_next/static/media/star-bottom.7253800d.svg)
Unlock your academic potential
Copyright © 2020–2026 A2Z Services. All Rights Reserved. Developed and managed by ZUCOL.