Financial Analysis Report Doics
VerifiedAdded on 2022/08/12
|15
|4206
|37
AI Summary
please include 400 words from non financial things and other lagging and leading indicators and 200 words on sustainability. The name of the company chosen is Treasury wine estates.
Contribute Materials
Your contribution can guide someone’s learning journey. Share your
documents today.
FINANCIAL ANALYSIS REPORT
Running Head: Financial Analysis Report
Running Head: Financial Analysis Report
Secure Best Marks with AI Grader
Need help grading? Try our AI Grader for instant feedback on your assignments.
Financial Analysis Report
Contents
Executive Summary...............................................................................................................................2
1. Introduction...................................................................................................................................2
2. Analysis and Interpretation............................................................................................................4
Treasury Wine Estates Financial Statement.......................................................................................4
Ratio Analysis...................................................................................................................................5
Common-Size Statement Analysis....................................................................................................7
Analysis of Non-Financial Performance Indicators at TWE............................................................12
3. Conclusion...................................................................................................................................12
References...........................................................................................................................................13
APPENDIX.........................................................................................................................................14
1
Financial Analysis Report
1. Introduction
Treasury Wine Estates is listed among the world’s largest company of wine. It is into wine
production and distribution. Earlier, this company came under the Foster’s group wine
division. It is successfully listed on Australian Securities Exchange. It is headquartered in
Melbourne, Australia (Treasury Wine Estates, n.d.).
Company is engaged in selling their wines in more than 70 countries. TWE operates
vineyards of about thirteen thousand hectares and manages a product portfolio of seventy
brands of wine. Some of such wine brands include 19 Crimes, Acacia, Annie's Lane, Baileys
of Glenrowan, Beaulieu Vineyard, Belcreme de Lys, Beringer Vineyards, Blossom Hill,
Chateau St John, Castello di Gabbiano, Coldstream Hills, Devil's Lair, Etude, Fifth Leg etc.
Main Business Activities
TWE operates a business which is vertically integrated and its whole focus is on brand
premiumisation. They achieve the goal of brand premiumisation using innovative technology,
brand building investment, marketing and global sales.
TWE has represent its brand portfolio across commercial, masstige and luxury price
segments. Apart from this, TWE has balanced model of sourcing and therefore it sources
from different countries like Australia, Italy, the United States, New Zealand, France and
other regions (Annual Report, 2019).
The company usually carry out three activities which are:
1. Grape growing and sourcing
2
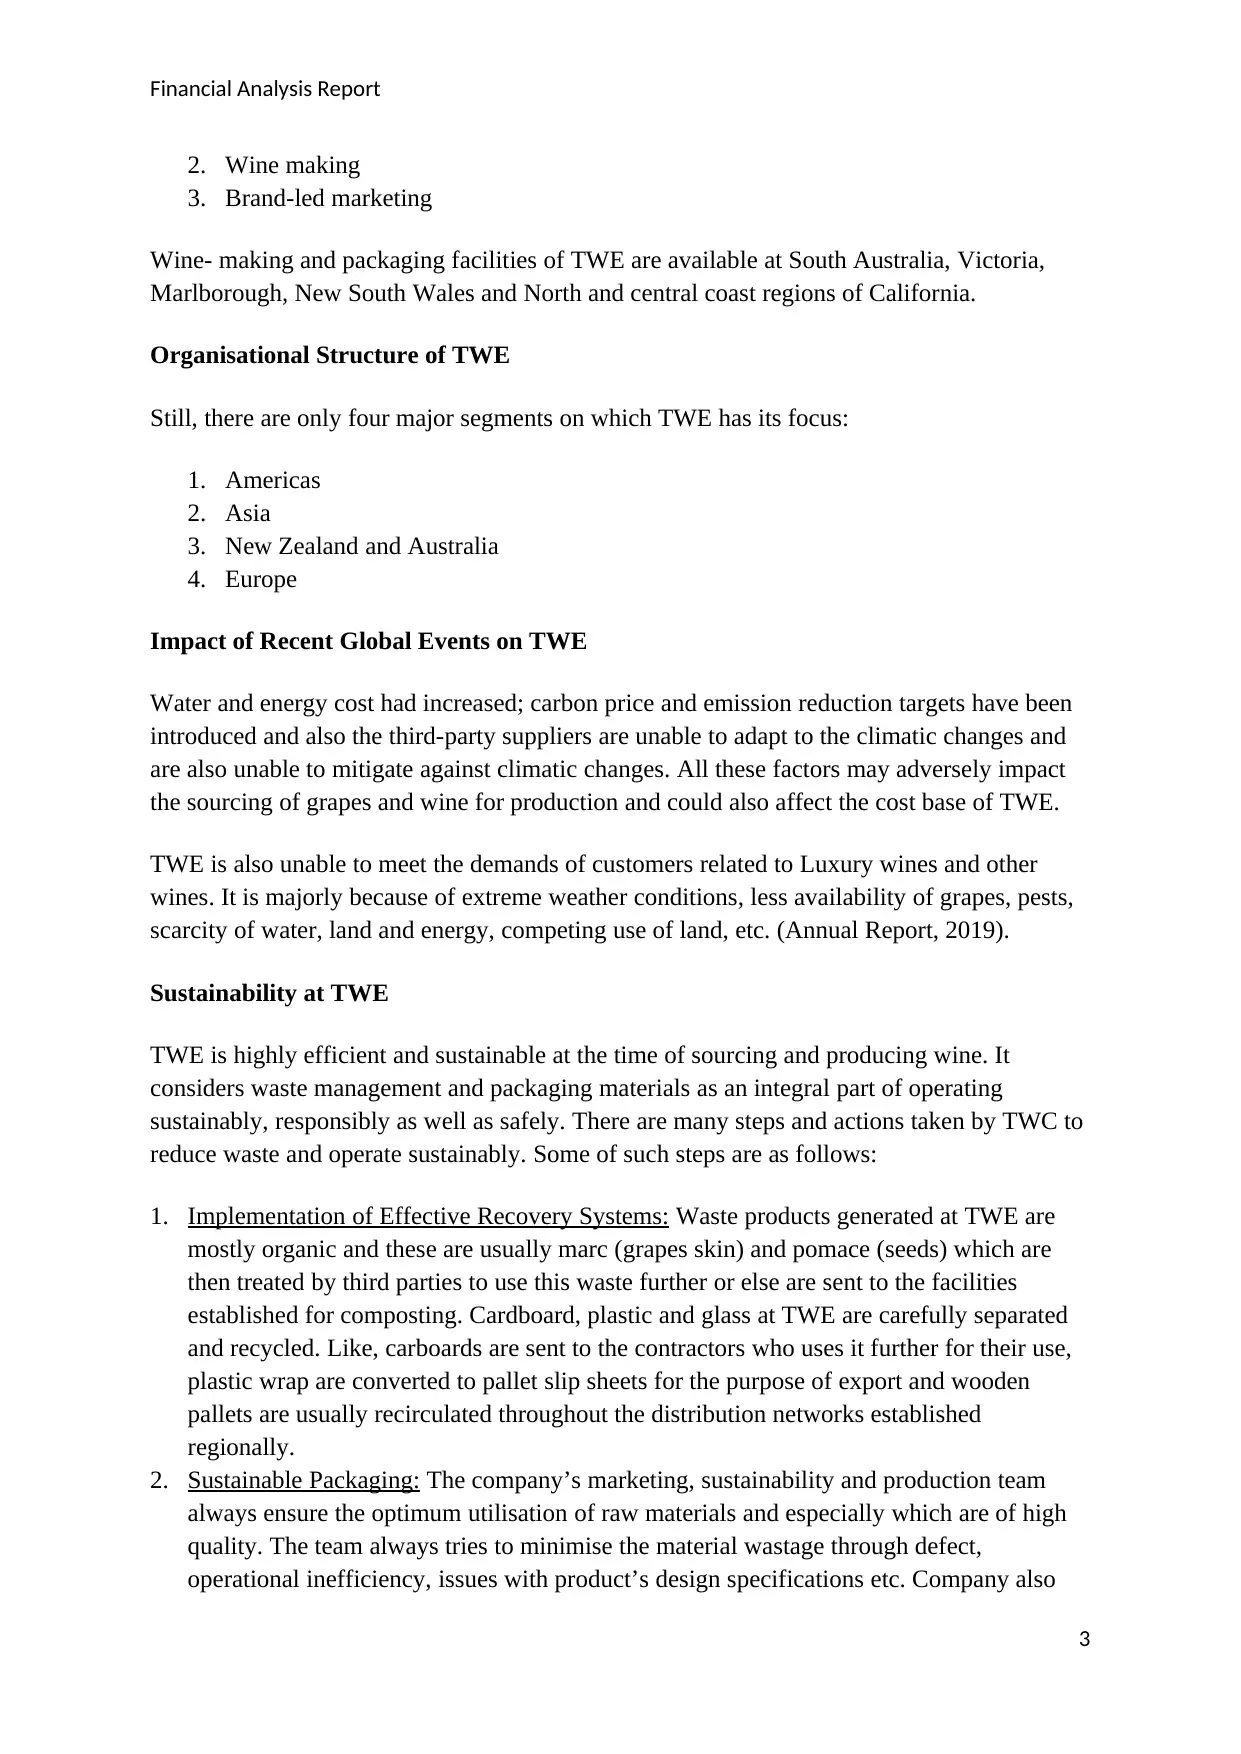
Executive Summary
This report deals with the financial analysis of Treasury Wine Estates which is positioned
as one of the largest wine company in the World. It is indulged in three activities which are
grapes growing and sourcing, wine making and brand-led marketing. TWE has never
overlooked the sustainability factor and therefore it has put a proper waste management
system in place. Over the four years, company has managed to reduce its operational cost
by introducing S4G program and non-IFRS measure for assessing operational
performance. Analysis like common-size statement and ratio analysis has always depicted
that the company ha improved in the last four years. However, company needs to check its
balance between the increasing inventory level and inventory turnover ratio which has not
rose significantly in these four years.
1. Introduction
Treasury Wine Estates is listed among the world’s largest company of wine. It is into wine
production and distribution. Earlier, this company came under the Foster’s group wine
division. It is successfully listed on Australian Securities Exchange. It is headquartered in
Melbourne, Australia (Treasury Wine Estates, n.d.).
Company is engaged in selling their wines in more than 70 countries. TWE operates
vineyards of about thirteen thousand hectares and manages a product portfolio of seventy
brands of wine. Some of such wine brands include 19 Crimes, Acacia, Annie's Lane, Baileys
of Glenrowan, Beaulieu Vineyard, Belcreme de Lys, Beringer Vineyards, Blossom Hill,
Chateau St John, Castello di Gabbiano, Coldstream Hills, Devil's Lair, Etude, Fifth Leg etc.
Main Business Activities
TWE operates a business which is vertically integrated and its whole focus is on brand
premiumisation. They achieve the goal of brand premiumisation using innovative technology,
brand building investment, marketing and global sales.
TWE has represent its brand portfolio across commercial, masstige and luxury price
segments. Apart from this, TWE has balanced model of sourcing and therefore it sources
from different countries like Australia, Italy, the United States, New Zealand, France and
other regions (Annual Report, 2019).
The company usually carry out three activities which are:
1. Grape growing and sourcing
2
Executive Summary
This report deals with the financial analysis of Treasury Wine Estates which is positioned
as one of the largest wine company in the World. It is indulged in three activities which are
grapes growing and sourcing, wine making and brand-led marketing. TWE has never
overlooked the sustainability factor and therefore it has put a proper waste management
system in place. Over the four years, company has managed to reduce its operational cost
by introducing S4G program and non-IFRS measure for assessing operational
performance. Analysis like common-size statement and ratio analysis has always depicted
that the company ha improved in the last four years. However, company needs to check its
balance between the increasing inventory level and inventory turnover ratio which has not
rose significantly in these four years.
Financial Analysis Report
2. Wine making
3. Brand-led marketing
Wine- making and packaging facilities of TWE are available at South Australia, Victoria,
Marlborough, New South Wales and North and central coast regions of California.
Organisational Structure of TWE
Still, there are only four major segments on which TWE has its focus:
1. Americas
2. Asia
3. New Zealand and Australia
4. Europe
Impact of Recent Global Events on TWE
Water and energy cost had increased; carbon price and emission reduction targets have been
introduced and also the third-party suppliers are unable to adapt to the climatic changes and
are also unable to mitigate against climatic changes. All these factors may adversely impact
the sourcing of grapes and wine for production and could also affect the cost base of TWE.
TWE is also unable to meet the demands of customers related to Luxury wines and other
wines. It is majorly because of extreme weather conditions, less availability of grapes, pests,
scarcity of water, land and energy, competing use of land, etc. (Annual Report, 2019).
Sustainability at TWE
TWE is highly efficient and sustainable at the time of sourcing and producing wine. It
considers waste management and packaging materials as an integral part of operating
sustainably, responsibly as well as safely. There are many steps and actions taken by TWC to
reduce waste and operate sustainably. Some of such steps are as follows:
1. Implementation of Effective Recovery Systems: Waste products generated at TWE are
mostly organic and these are usually marc (grapes skin) and pomace (seeds) which are
then treated by third parties to use this waste further or else are sent to the facilities
established for composting. Cardboard, plastic and glass at TWE are carefully separated
and recycled. Like, carboards are sent to the contractors who uses it further for their use,
plastic wrap are converted to pallet slip sheets for the purpose of export and wooden
pallets are usually recirculated throughout the distribution networks established
regionally.
2. Sustainable Packaging: The company’s marketing, sustainability and production team
always ensure the optimum utilisation of raw materials and especially which are of high
quality. The team always tries to minimise the material wastage through defect,
operational inefficiency, issues with product’s design specifications etc. Company also
3
Secure Best Marks with AI Grader
Need help grading? Try our AI Grader for instant feedback on your assignments.
Financial Analysis Report
believes in maximising the use of carboards, glass etc. for the purpose of packing as these
are highly recyclable. TWE also work towards the improvement of its supply chain
system for safeguarding the inputs made of high-quality raw materials (Treasury Wine
Estates, n.d.).
2. Analysis and Interpretation
Treasury Wine Estates Financial Statement
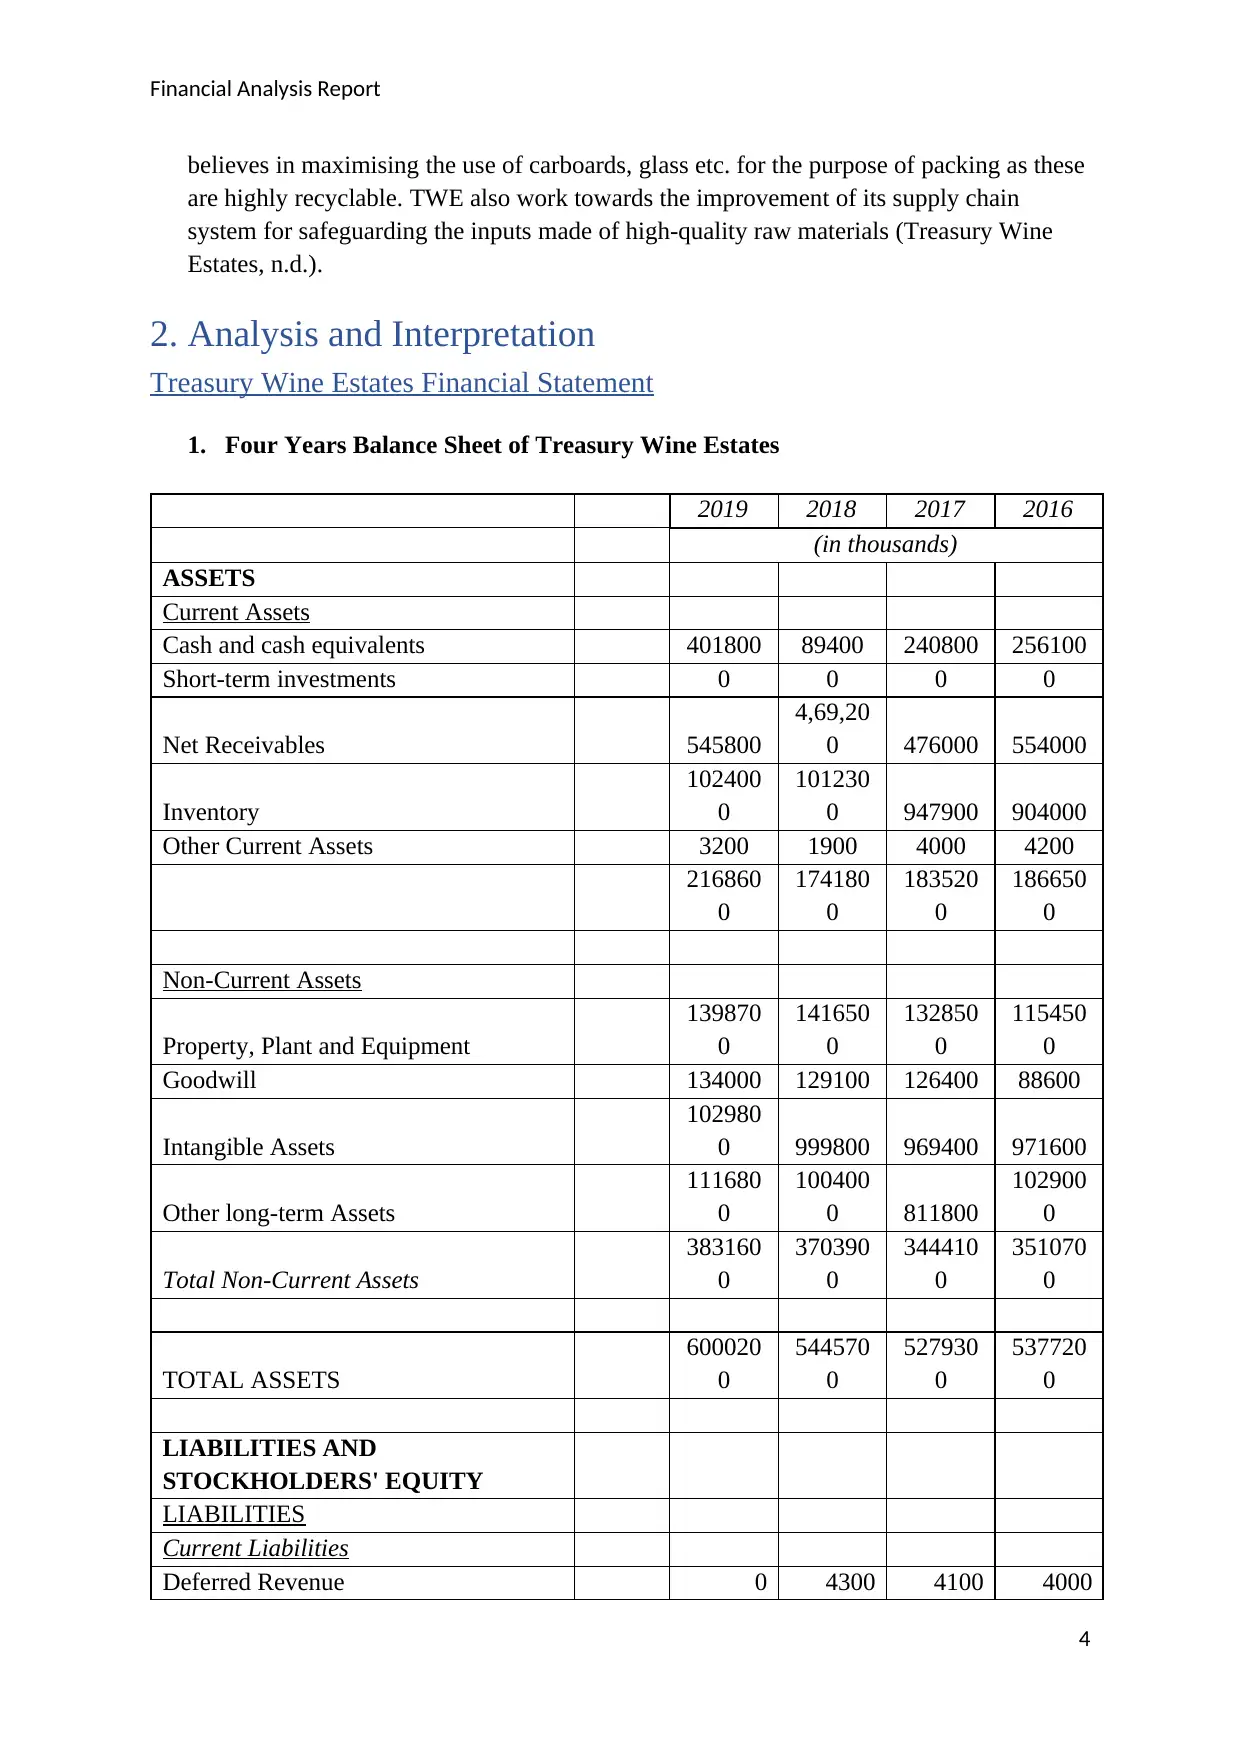
1. Four Years Balance Sheet of Treasury Wine Estates
2019 2018 2017 2016
(in thousands)
ASSETS
Current Assets
Cash and cash equivalents 401800 89400 240800 256100
Short-term investments 0 0 0 0
Net Receivables 545800
4,69,20
0 476000 554000
Inventory
102400
0
101230
0 947900 904000
Other Current Assets 3200 1900 4000 4200
216860
0
174180
0
183520
0
186650
0
Non-Current Assets
Property, Plant and Equipment
139870
0
141650
0
132850
0
115450
0
Goodwill 134000 129100 126400 88600
Intangible Assets
102980
0 999800 969400 971600
Other long-term Assets
111680
0
100400
0 811800
102900
0
Total Non-Current Assets
383160
0
370390
0
344410
0
351070
0
TOTAL ASSETS
600020
0
544570
0
527930
0
537720
0
LIABILITIES AND
STOCKHOLDERS' EQUITY
LIABILITIES
Current Liabilities
Deferred Revenue 0 4300 4100 4000
4
believes in maximising the use of carboards, glass etc. for the purpose of packing as these
are highly recyclable. TWE also work towards the improvement of its supply chain
system for safeguarding the inputs made of high-quality raw materials (Treasury Wine
Estates, n.d.).
2. Analysis and Interpretation
Treasury Wine Estates Financial Statement
1. Four Years Balance Sheet of Treasury Wine Estates
2019 2018 2017 2016
(in thousands)
ASSETS
Current Assets
Cash and cash equivalents 401800 89400 240800 256100
Short-term investments 0 0 0 0
Net Receivables 545800
4,69,20
0 476000 554000
Inventory
102400
0
101230
0 947900 904000
Other Current Assets 3200 1900 4000 4200
216860
0
174180
0
183520
0
186650
0
Non-Current Assets
Property, Plant and Equipment
139870
0
141650
0
132850
0
115450
0
Goodwill 134000 129100 126400 88600
Intangible Assets
102980
0 999800 969400 971600
Other long-term Assets
111680
0
100400
0 811800
102900
0
Total Non-Current Assets
383160
0
370390
0
344410
0
351070
0
TOTAL ASSETS
600020
0
544570
0
527930
0
537720
0
LIABILITIES AND
STOCKHOLDERS' EQUITY
LIABILITIES
Current Liabilities
Deferred Revenue 0 4300 4100 4000
4
Financial Analysis Report
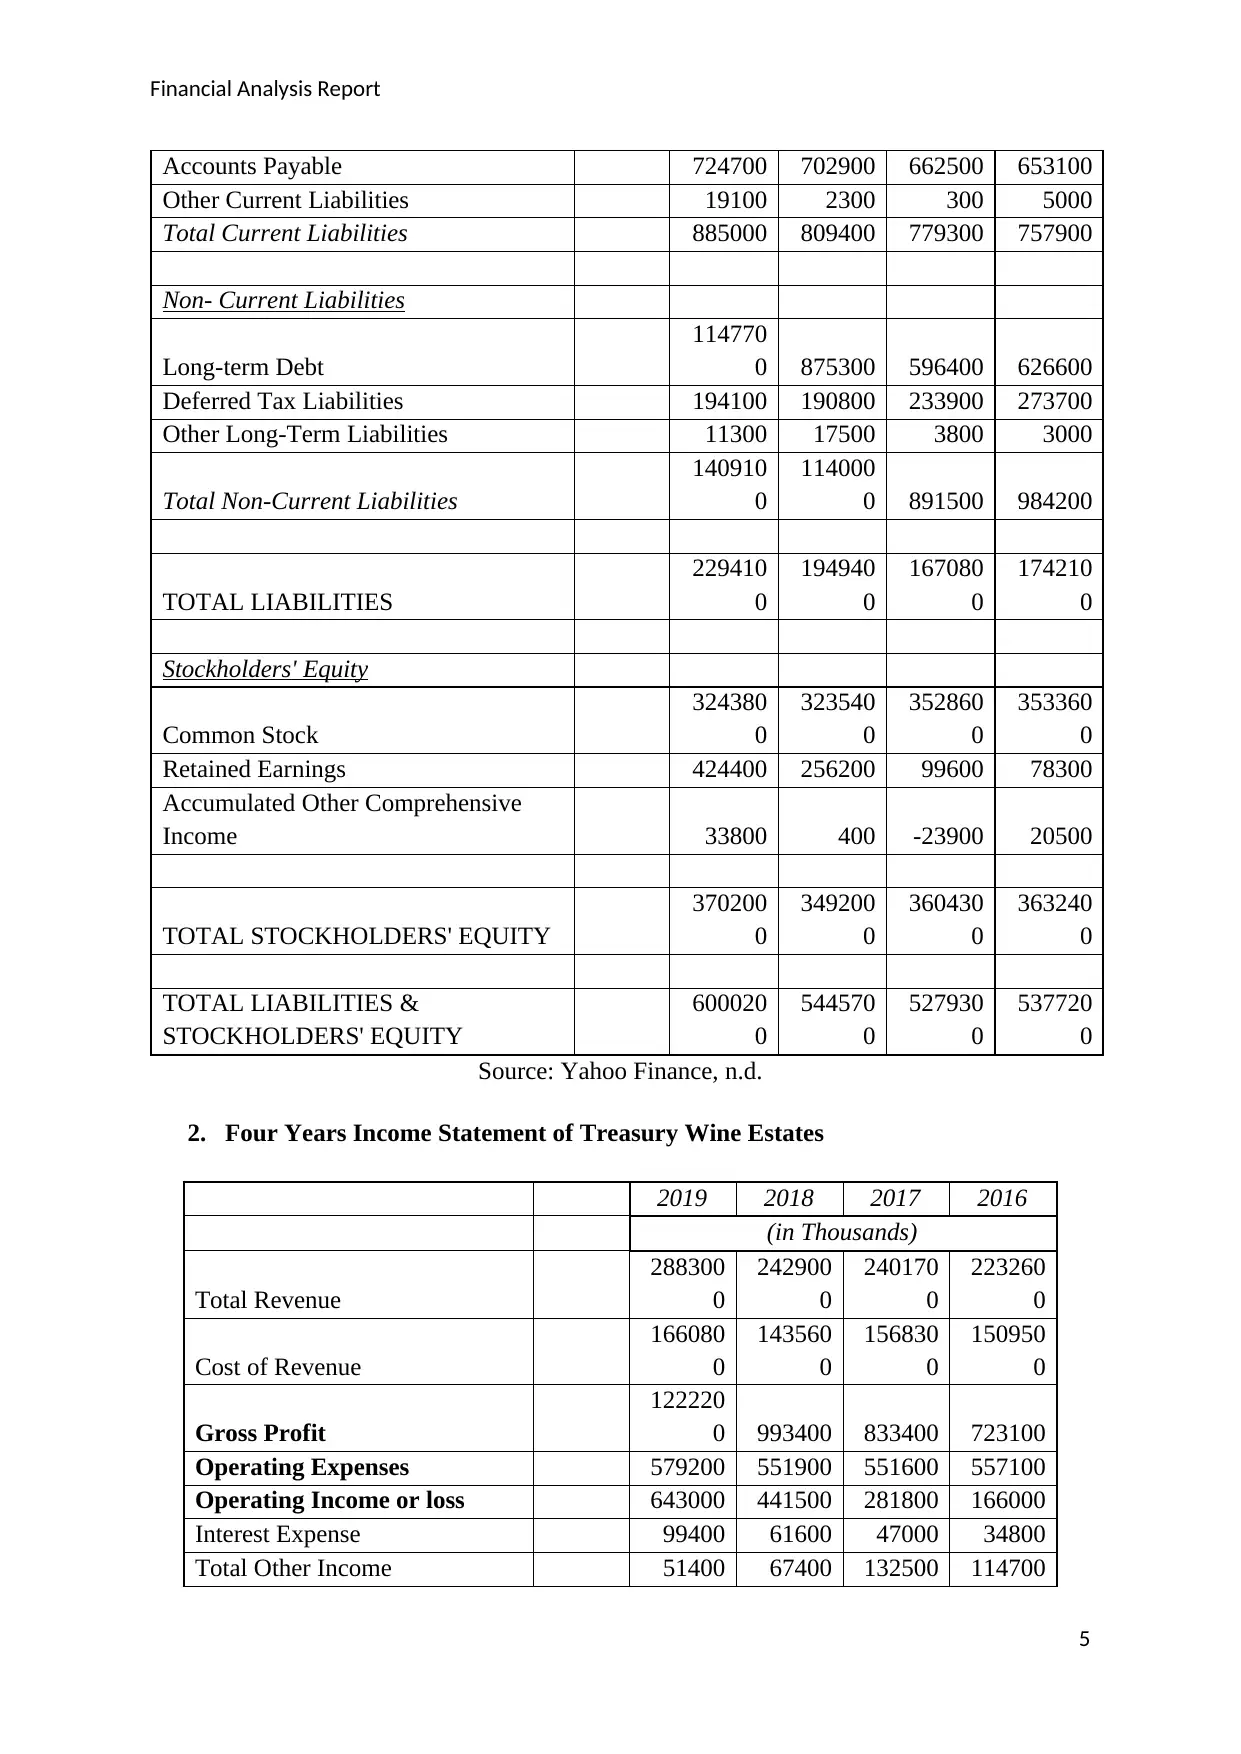
Accounts Payable 724700 702900 662500 653100
Other Current Liabilities 19100 2300 300 5000
Total Current Liabilities 885000 809400 779300 757900
Non- Current Liabilities
Long-term Debt
114770
0 875300 596400 626600
Deferred Tax Liabilities 194100 190800 233900 273700
Other Long-Term Liabilities 11300 17500 3800 3000
Total Non-Current Liabilities
140910
0
114000
0 891500 984200
TOTAL LIABILITIES
229410
0
194940
0
167080
0
174210
0
Stockholders' Equity
Common Stock
324380
0
323540
0
352860
0
353360
0
Retained Earnings 424400 256200 99600 78300
Accumulated Other Comprehensive
Income 33800 400 -23900 20500
TOTAL STOCKHOLDERS' EQUITY
370200
0
349200
0
360430
0
363240
0
TOTAL LIABILITIES &
STOCKHOLDERS' EQUITY
600020
0
544570
0
527930
0
537720
0
Source: Yahoo Finance, n.d.
2. Four Years Income Statement of Treasury Wine Estates
2019 2018 2017 2016
(in Thousands)
Total Revenue
288300
0
242900
0
240170
0
223260
0
Cost of Revenue
166080
0
143560
0
156830
0
150950
0
Gross Profit
122220
0 993400 833400 723100
Operating Expenses 579200 551900 551600 557100
Operating Income or loss 643000 441500 281800 166000
Interest Expense 99400 61600 47000 34800
Total Other Income 51400 67400 132500 114700
5
Financial Analysis Report
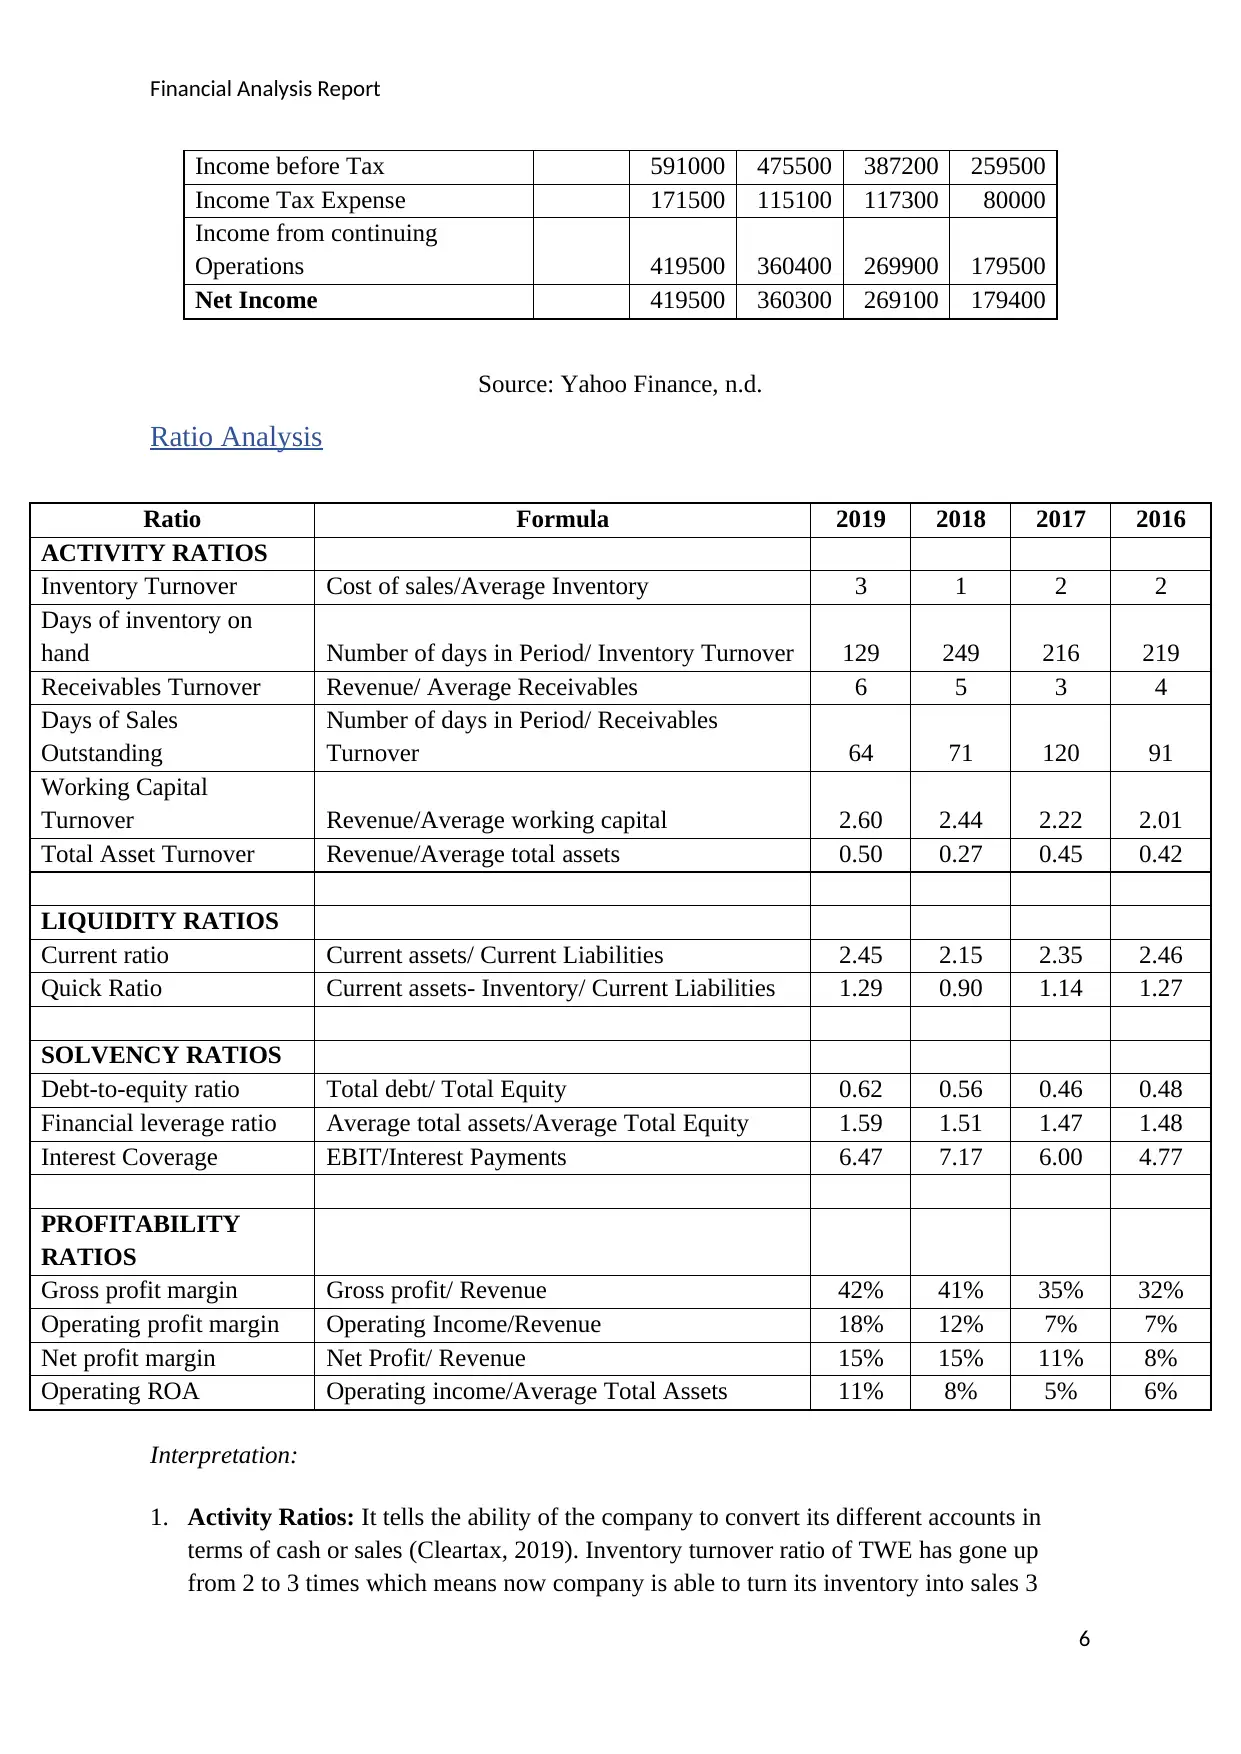
Income before Tax 591000 475500 387200 259500
Income Tax Expense 171500 115100 117300 80000
Income from continuing
Operations 419500 360400 269900 179500
Net Income 419500 360300 269100 179400
Source: Yahoo Finance, n.d.
Ratio Analysis
Ratio Formula 2019 2018 2017 2016
ACTIVITY RATIOS
Inventory Turnover Cost of sales/Average Inventory 3 1 2 2
Days of inventory on
hand Number of days in Period/ Inventory Turnover 129 249 216 219
Receivables Turnover Revenue/ Average Receivables 6 5 3 4
Days of Sales
Outstanding
Number of days in Period/ Receivables
Turnover 64 71 120 91
Working Capital
Turnover Revenue/Average working capital 2.60 2.44 2.22 2.01
Total Asset Turnover Revenue/Average total assets 0.50 0.27 0.45 0.42
LIQUIDITY RATIOS
Current ratio Current assets/ Current Liabilities 2.45 2.15 2.35 2.46
Quick Ratio Current assets- Inventory/ Current Liabilities 1.29 0.90 1.14 1.27
SOLVENCY RATIOS
Debt-to-equity ratio Total debt/ Total Equity 0.62 0.56 0.46 0.48
Financial leverage ratio Average total assets/Average Total Equity 1.59 1.51 1.47 1.48
Interest Coverage EBIT/Interest Payments 6.47 7.17 6.00 4.77
PROFITABILITY
RATIOS
Gross profit margin Gross profit/ Revenue 42% 41% 35% 32%
Operating profit margin Operating Income/Revenue 18% 12% 7% 7%
Net profit margin Net Profit/ Revenue 15% 15% 11% 8%
Operating ROA Operating income/Average Total Assets 11% 8% 5% 6%
Interpretation:
1. Activity Ratios: It tells the ability of the company to convert its different accounts in
terms of cash or sales (Cleartax, 2019). Inventory turnover ratio of TWE has gone up
from 2 to 3 times which means now company is able to turn its inventory into sales 3
6
Paraphrase This Document
Need a fresh take? Get an instant paraphrase of this document with our AI Paraphraser
Financial Analysis Report
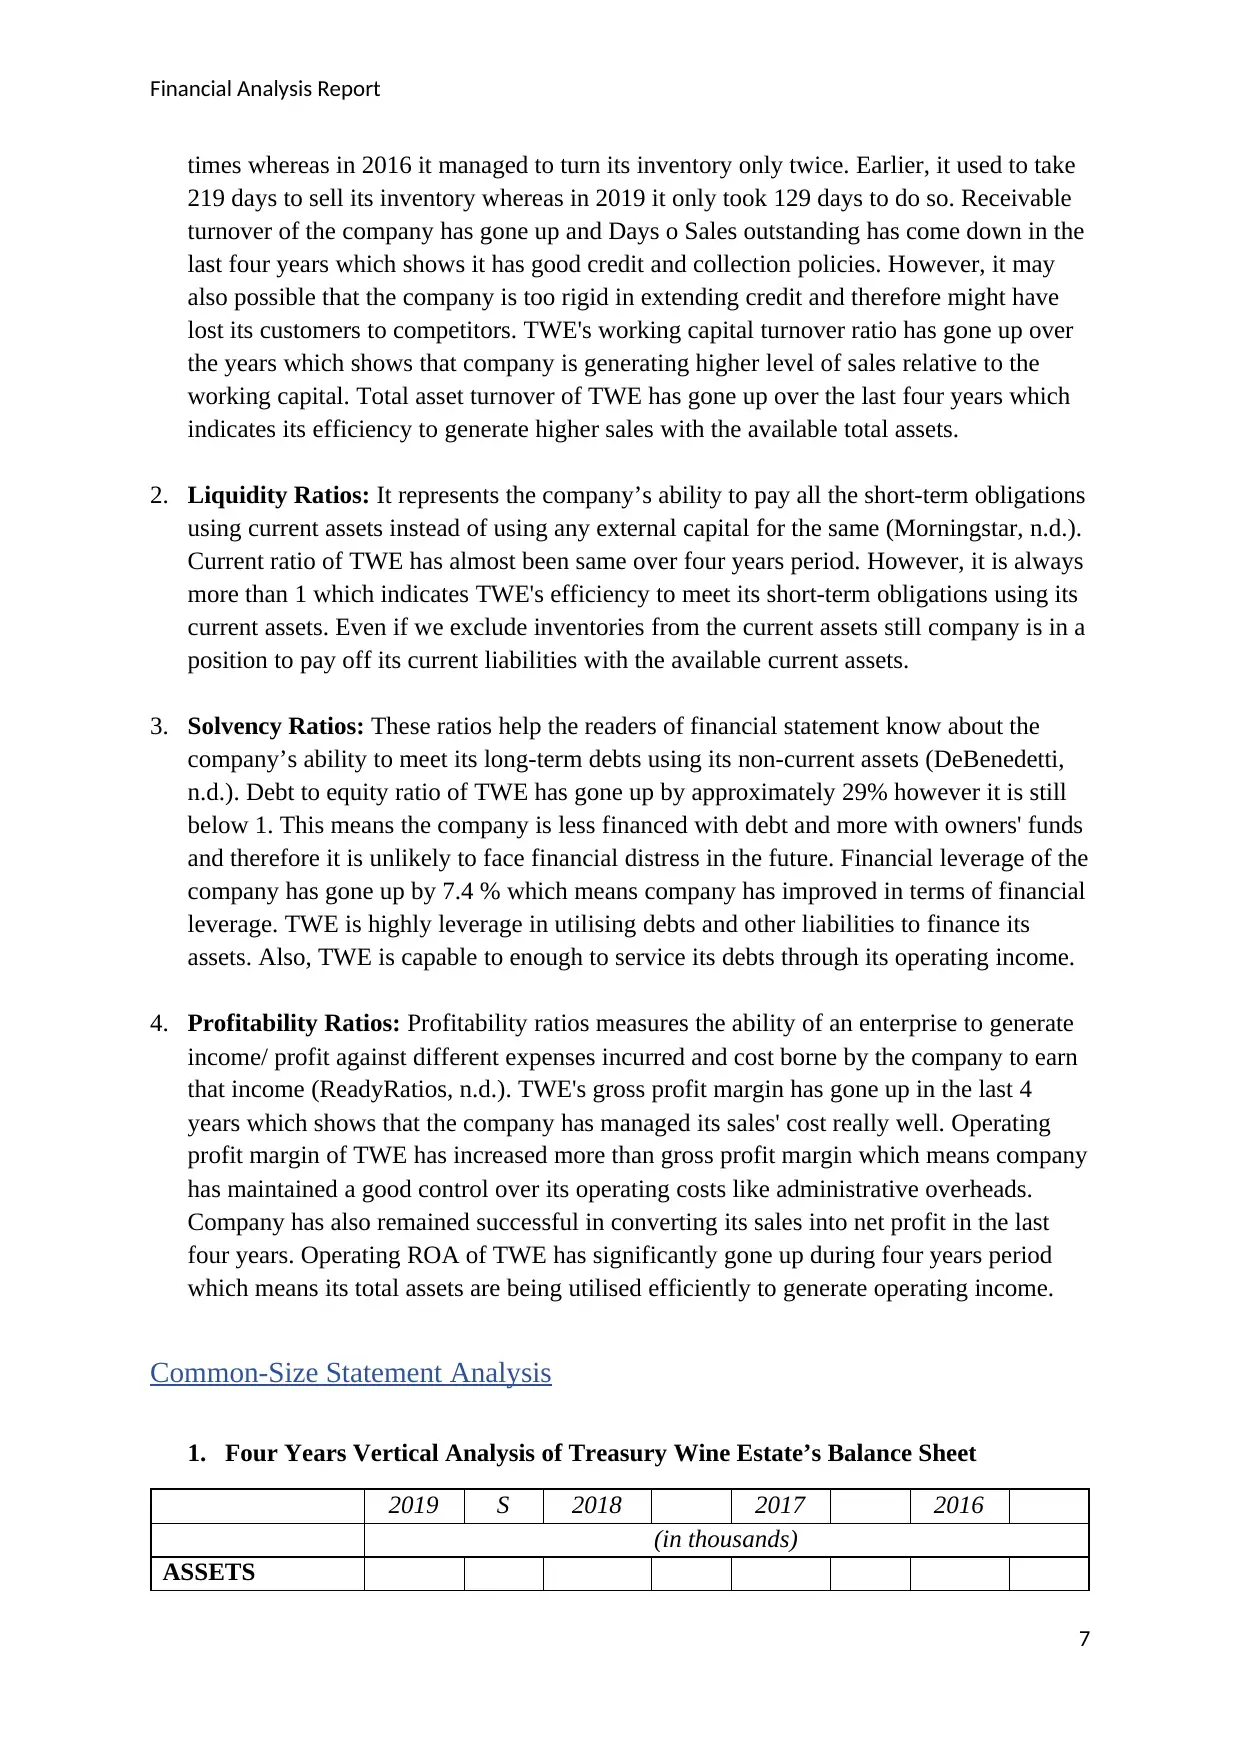
times whereas in 2016 it managed to turn its inventory only twice. Earlier, it used to take
219 days to sell its inventory whereas in 2019 it only took 129 days to do so. Receivable
turnover of the company has gone up and Days o Sales outstanding has come down in the
last four years which shows it has good credit and collection policies. However, it may
also possible that the company is too rigid in extending credit and therefore might have
lost its customers to competitors. TWE's working capital turnover ratio has gone up over
the years which shows that company is generating higher level of sales relative to the
working capital. Total asset turnover of TWE has gone up over the last four years which
indicates its efficiency to generate higher sales with the available total assets.
2. Liquidity Ratios: It represents the company’s ability to pay all the short-term obligations
using current assets instead of using any external capital for the same (Morningstar, n.d.).
Current ratio of TWE has almost been same over four years period. However, it is always
more than 1 which indicates TWE's efficiency to meet its short-term obligations using its
current assets. Even if we exclude inventories from the current assets still company is in a
position to pay off its current liabilities with the available current assets.
3. Solvency Ratios: These ratios help the readers of financial statement know about the
company’s ability to meet its long-term debts using its non-current assets (DeBenedetti,
n.d.). Debt to equity ratio of TWE has gone up by approximately 29% however it is still
below 1. This means the company is less financed with debt and more with owners' funds
and therefore it is unlikely to face financial distress in the future. Financial leverage of the
company has gone up by 7.4 % which means company has improved in terms of financial
leverage. TWE is highly leverage in utilising debts and other liabilities to finance its
assets. Also, TWE is capable to enough to service its debts through its operating income.
4. Profitability Ratios: Profitability ratios measures the ability of an enterprise to generate
income/ profit against different expenses incurred and cost borne by the company to earn
that income (ReadyRatios, n.d.). TWE's gross profit margin has gone up in the last 4
years which shows that the company has managed its sales' cost really well. Operating
profit margin of TWE has increased more than gross profit margin which means company
has maintained a good control over its operating costs like administrative overheads.
Company has also remained successful in converting its sales into net profit in the last
four years. Operating ROA of TWE has significantly gone up during four years period
which means its total assets are being utilised efficiently to generate operating income.
Common-Size Statement Analysis
1. Four Years Vertical Analysis of Treasury Wine Estate’s Balance Sheet
2019 S 2018 2017 2016
(in thousands)
ASSETS
7
Financial Analysis Report
Current Assets
Cash and cash
equivalents 401800 7% 89400 2% 240800 5% 256100 5%
Short-term
investments 0 0% 0 0% 0 0% 0 0%
Net Receivables 545800 9%
4,69,20
0 9% 476000 9% 554000 10%
Inventory
102400
0 17%
101230
0 19% 947900 18% 904000 17%
Other Current
Assets 3200
0.05
% 1900
0.03
% 4000
0.08
% 4200
0.08
%
Total Current
Assets
216860
0 36%
174180
0 32%
183520
0 35%
186650
0 35%
Non-Current
Assets
Property, Plant
and Equipment
139870
0 23%
141650
0 26%
132850
0 25%
115450
0 21%
Goodwill 134000 2% 129100 2% 126400 2% 88600 2%
Intangible Assets
102980
0 17% 999800 18% 969400 18% 971600 18%
Other long-term
Assets
111680
0 19%
100400
0 18% 811800 15%
102900
0 19%
Total Non-Current
Assets
383160
0 64%
370390
0 68%
344410
0 65%
351070
0 65%
TOTAL ASSETS
600020
0
100
%
544570
0
100
%
527930
0
100
%
537720
0
100
%
LIABILITIES
AND
STOCKHOLDE
RS' EQUITY
LIABILITIES
Current Liabilities
Accrued Expenses 0 0% 4300
0.08
% 4100
0.08
% 4000
0.07
%
Accounts Payable 724700 12% 702900 13% 662500 13% 653100 12%
Other Current
Liabilities 19100
0.32
% 2300
0.04
% 300
0.01
% 5000
0.09
%
Total Current
Liabilities 885000 15% 809400 15% 779300 15% 757900 14%
8
Financial Analysis Report
Non- Current
Liabilities
Long-term Debt
114770
0 19% 875300 16% 596400 11% 626600 12%
Deferred Tax
Liabilities 194100 3% 190800 4% 233900 4% 273700 5%
Other Long Term
Liabilities 11300 0% 17500 0% 3800 0% 3000 0%
Total Non-Current
Liabilities
140910
0 23%
114000
0 21% 891500 17% 984200 18%
TOTAL
LIABILITIES
Stockholders'
Equity
Common Stock
324380
0 54%
323540
0 59%
352860
0 67%
353360
0 66%
Retained Earnings 424400 7% 256200 5% 99600 2% 78300 1%
Accumulated
Other
Comprehensive
Income 33800 1% 400 0% -23900 0% 20500 0%
TOTAL
STOCKHOLDER
S' EQUITY
370200
0 62%
349200
0 64%
360430
0 68%
363240
0 68%
TOTAL
LIABILITIES &
STOCKHOLDER
S' EQUITY
600020
0
100
%
544570
0
100
%
527930
0
100
%
537720
0
100
%
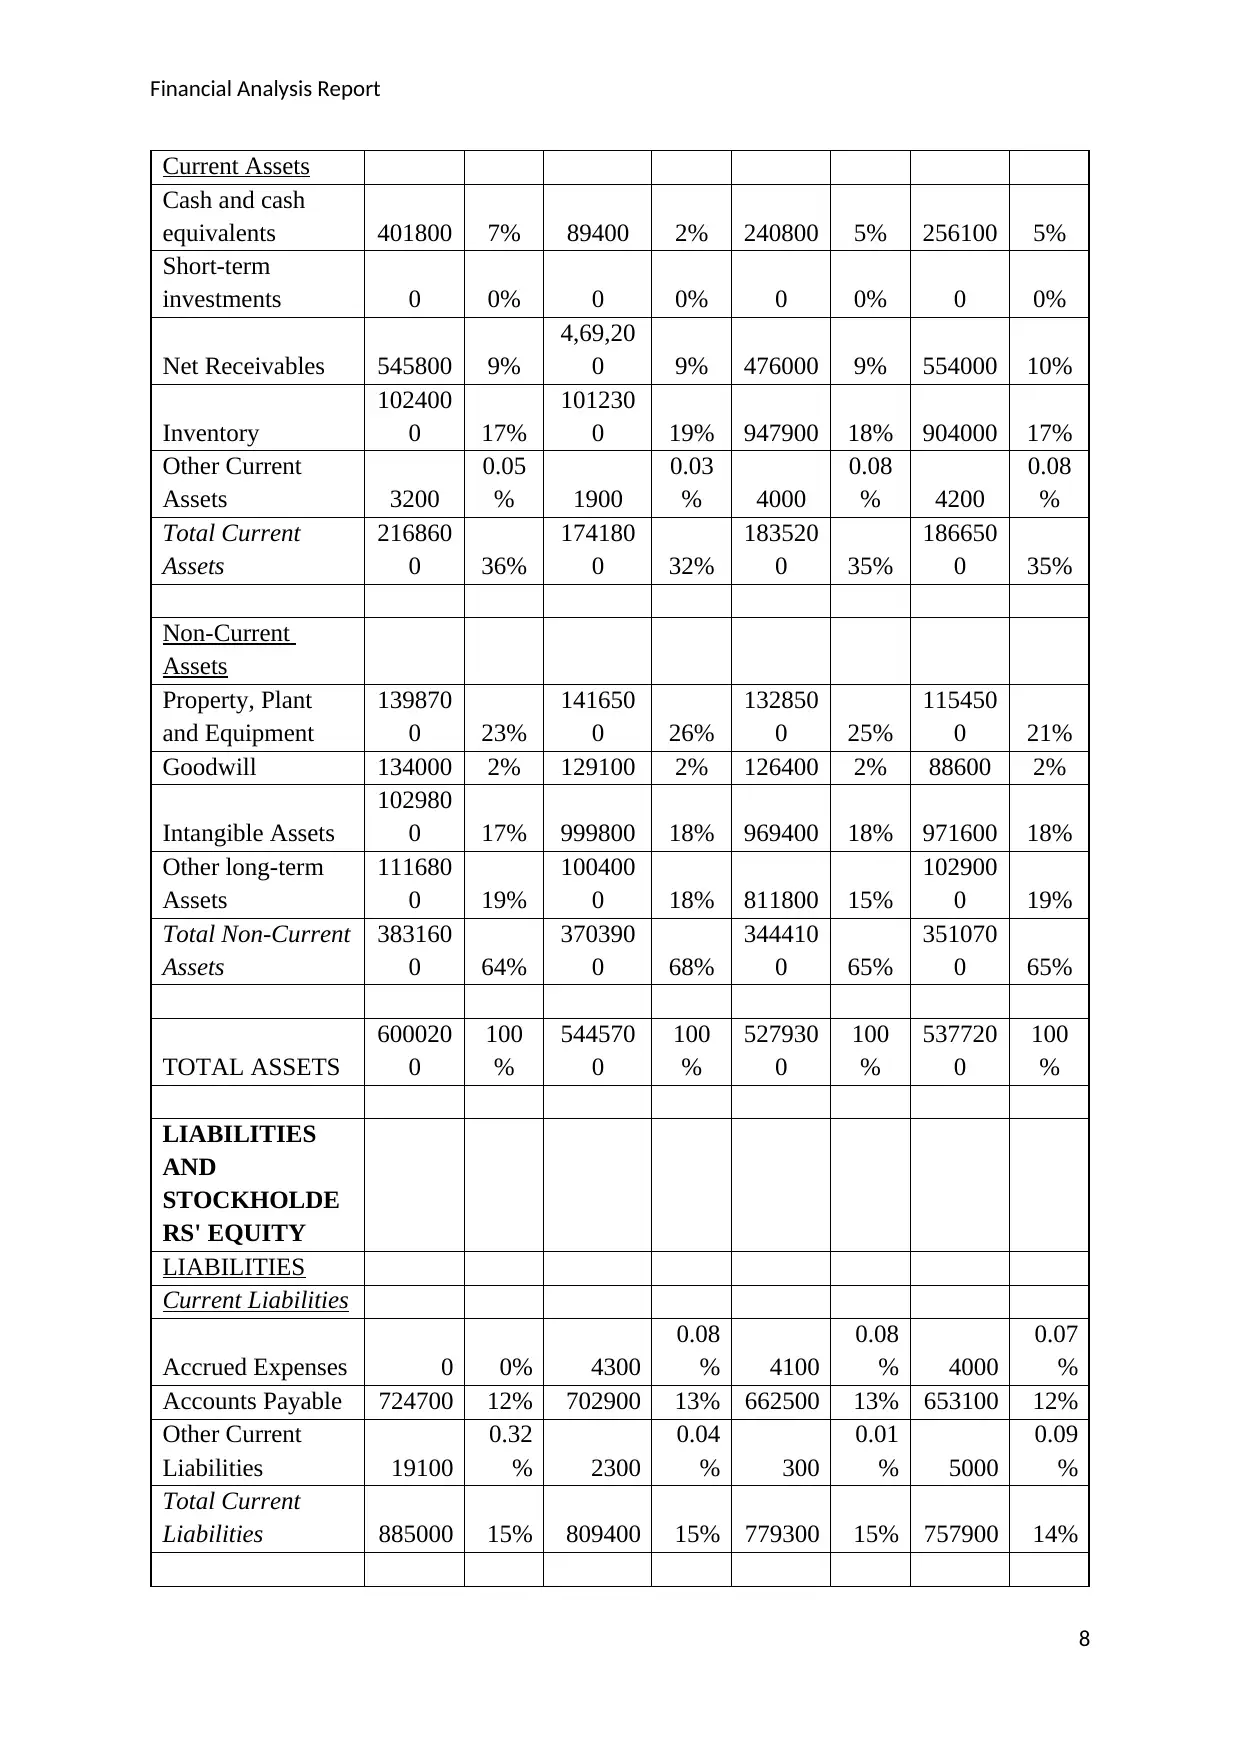
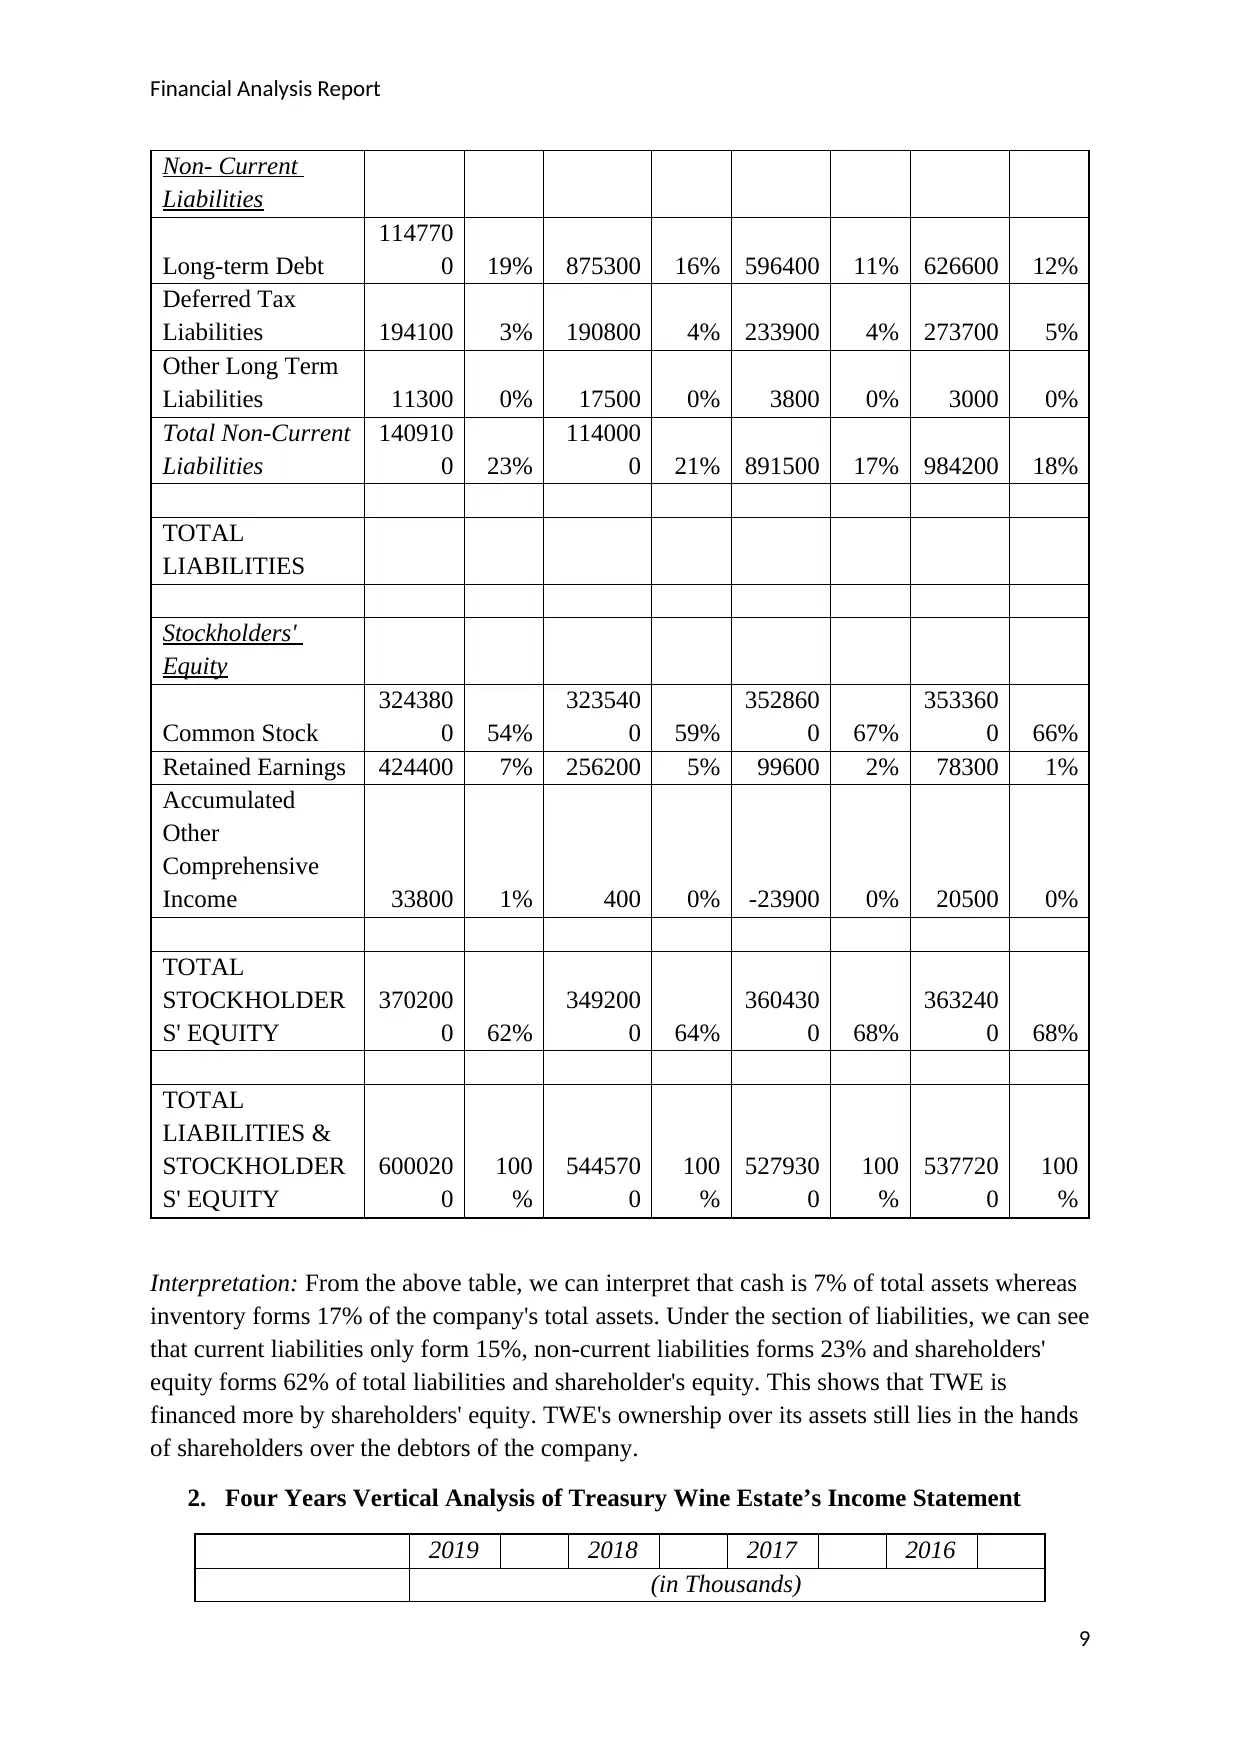
Interpretation: From the above table, we can interpret that cash is 7% of total assets whereas
inventory forms 17% of the company's total assets. Under the section of liabilities, we can see
that current liabilities only form 15%, non-current liabilities forms 23% and shareholders'
equity forms 62% of total liabilities and shareholder's equity. This shows that TWE is
financed more by shareholders' equity. TWE's ownership over its assets still lies in the hands
of shareholders over the debtors of the company.
2. Four Years Vertical Analysis of Treasury Wine Estate’s Income Statement
2019 2018 2017 2016
(in Thousands)
9
Non- Current
Liabilities
Long-term Debt
114770
0 19% 875300 16% 596400 11% 626600 12%
Deferred Tax
Liabilities 194100 3% 190800 4% 233900 4% 273700 5%
Other Long Term
Liabilities 11300 0% 17500 0% 3800 0% 3000 0%
Total Non-Current
Liabilities
140910
0 23%
114000
0 21% 891500 17% 984200 18%
TOTAL
LIABILITIES
Stockholders'
Equity
Common Stock
324380
0 54%
323540
0 59%
352860
0 67%
353360
0 66%
Retained Earnings 424400 7% 256200 5% 99600 2% 78300 1%
Accumulated
Other
Comprehensive
Income 33800 1% 400 0% -23900 0% 20500 0%
TOTAL
STOCKHOLDER
S' EQUITY
370200
0 62%
349200
0 64%
360430
0 68%
363240
0 68%
TOTAL
LIABILITIES &
STOCKHOLDER
S' EQUITY
600020
0
100
%
544570
0
100
%
527930
0
100
%
537720
0
100
%
Interpretation: From the above table, we can interpret that cash is 7% of total assets whereas
inventory forms 17% of the company's total assets. Under the section of liabilities, we can see
that current liabilities only form 15%, non-current liabilities forms 23% and shareholders'
equity forms 62% of total liabilities and shareholder's equity. This shows that TWE is
financed more by shareholders' equity. TWE's ownership over its assets still lies in the hands
of shareholders over the debtors of the company.
2. Four Years Vertical Analysis of Treasury Wine Estate’s Income Statement
2019 2018 2017 2016
(in Thousands)
9
Secure Best Marks with AI Grader
Need help grading? Try our AI Grader for instant feedback on your assignments.
Financial Analysis Report
Total Revenue
28830
00
100
%
24290
00
100
%
24017
00
100
%
22326
00
100
%
Cost of Revenue
16608
00
58
%
14356
00
59
%
15683
00
65
%
15095
00
68
%
Gross Profit
12222
00
42
%
99340
0
41
%
83340
0
35
%
72310
0
32
%
Operating
Expenses
57920
0
20
%
55190
0
23
%
55160
0
23
%
55710
0
25
%
Operating
Income or loss
64300
0
22
%
44150
0
18
%
28180
0
12
%
16600
0 7%
Interest Expense 99400 3% 61600 3% 47000 2% 34800 2%
Total Other
Income 51400 2% 67400 3%
13250
0 6%
11470
0 5%
Income before Tax
59100
0
20
%
47550
0
20
%
38720
0
16
%
25950
0
12
%
Income Tax
Expense
17150
0 6%
11510
0 5%
11730
0 5% 80000 4%
Income from
continuing
Operations
41950
0
15
%
36040
0
15
%
26990
0
11
%
17950
0 8%
Net Income
41950
0
15
%
36030
0
15
%
26910
0
11
%
17940
0 8%
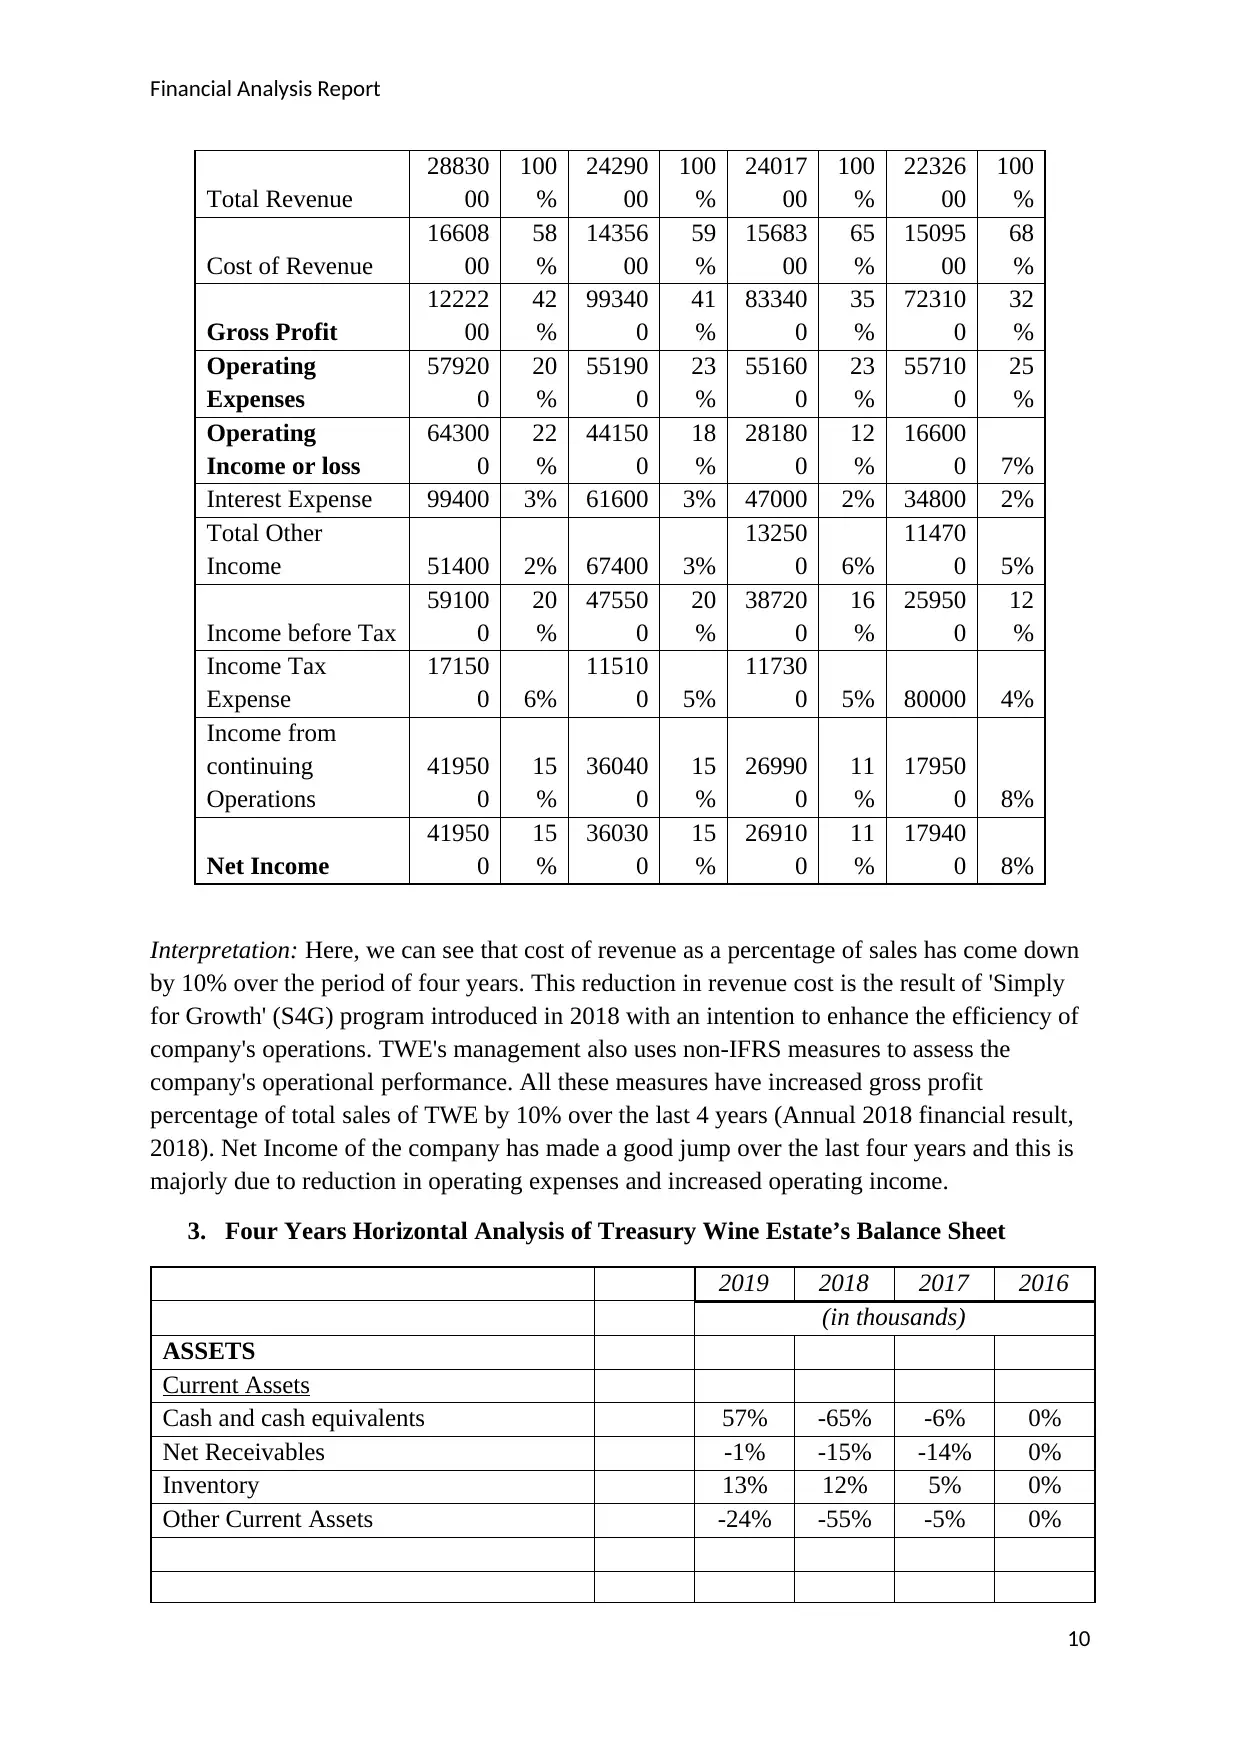
Interpretation: Here, we can see that cost of revenue as a percentage of sales has come down
by 10% over the period of four years. This reduction in revenue cost is the result of 'Simply
for Growth' (S4G) program introduced in 2018 with an intention to enhance the efficiency of
company's operations. TWE's management also uses non-IFRS measures to assess the
company's operational performance. All these measures have increased gross profit
percentage of total sales of TWE by 10% over the last 4 years (Annual 2018 financial result,
2018). Net Income of the company has made a good jump over the last four years and this is
majorly due to reduction in operating expenses and increased operating income.
3. Four Years Horizontal Analysis of Treasury Wine Estate’s Balance Sheet
2019 2018 2017 2016
(in thousands)
ASSETS
Current Assets
Cash and cash equivalents 57% -65% -6% 0%
Net Receivables -1% -15% -14% 0%
Inventory 13% 12% 5% 0%
Other Current Assets -24% -55% -5% 0%
10
Total Revenue
28830
00
100
%
24290
00
100
%
24017
00
100
%
22326
00
100
%
Cost of Revenue
16608
00
58
%
14356
00
59
%
15683
00
65
%
15095
00
68
%
Gross Profit
12222
00
42
%
99340
0
41
%
83340
0
35
%
72310
0
32
%
Operating
Expenses
57920
0
20
%
55190
0
23
%
55160
0
23
%
55710
0
25
%
Operating
Income or loss
64300
0
22
%
44150
0
18
%
28180
0
12
%
16600
0 7%
Interest Expense 99400 3% 61600 3% 47000 2% 34800 2%
Total Other
Income 51400 2% 67400 3%
13250
0 6%
11470
0 5%
Income before Tax
59100
0
20
%
47550
0
20
%
38720
0
16
%
25950
0
12
%
Income Tax
Expense
17150
0 6%
11510
0 5%
11730
0 5% 80000 4%
Income from
continuing
Operations
41950
0
15
%
36040
0
15
%
26990
0
11
%
17950
0 8%
Net Income
41950
0
15
%
36030
0
15
%
26910
0
11
%
17940
0 8%
Interpretation: Here, we can see that cost of revenue as a percentage of sales has come down
by 10% over the period of four years. This reduction in revenue cost is the result of 'Simply
for Growth' (S4G) program introduced in 2018 with an intention to enhance the efficiency of
company's operations. TWE's management also uses non-IFRS measures to assess the
company's operational performance. All these measures have increased gross profit
percentage of total sales of TWE by 10% over the last 4 years (Annual 2018 financial result,
2018). Net Income of the company has made a good jump over the last four years and this is
majorly due to reduction in operating expenses and increased operating income.
3. Four Years Horizontal Analysis of Treasury Wine Estate’s Balance Sheet
2019 2018 2017 2016
(in thousands)
ASSETS
Current Assets
Cash and cash equivalents 57% -65% -6% 0%
Net Receivables -1% -15% -14% 0%
Inventory 13% 12% 5% 0%
Other Current Assets -24% -55% -5% 0%
10
Financial Analysis Report
Non-Current Assets
Property, Plant and Equipment 21% 23% 15% 0%
Goodwill 51% 46% 43% 0%
Intangible Assets 6% 3% 0% 0%
Other long-term Assets 9% -2% -21% 0%
Total Non-Current Assets 9% 6% -2% 0%
TOTAL ASSETS 12% 1% -2% 0%
LIABILITIES AND
STOCKHOLDERS' EQUITY
LIABILITIES
Current Liabilities
Deferred Revenue -100% 8% 3% 0%
Accounts Payable 11% 8% 1% 0%
Other Current Liabilities 282% -54% -94% 0%
Total Current Liabilities 17% 7% 3% 0%
Non- Current Liabilities
Long-term Debt 83% 40% -5% 0%
Deferred Tax Liabilities -29% -30% -15% 0%
Other Long Term Liabilities 277% 483% 27% 0%
Total Non-Current Liabilities
Stockholders' Equity
Common Stock -8% -8% 0% 0%
Retained Earnings 442% 227% 27% 0%
Accumulated Other Comprehensive
Income 65% -98% -217% 0%
TOTAL STOCKHOLDERS' EQUITY 2% -4% -1% 0%
TOTAL LIABILITIES &
STOCKHOLDERS' EQUITY 12% 1% -2% 0%
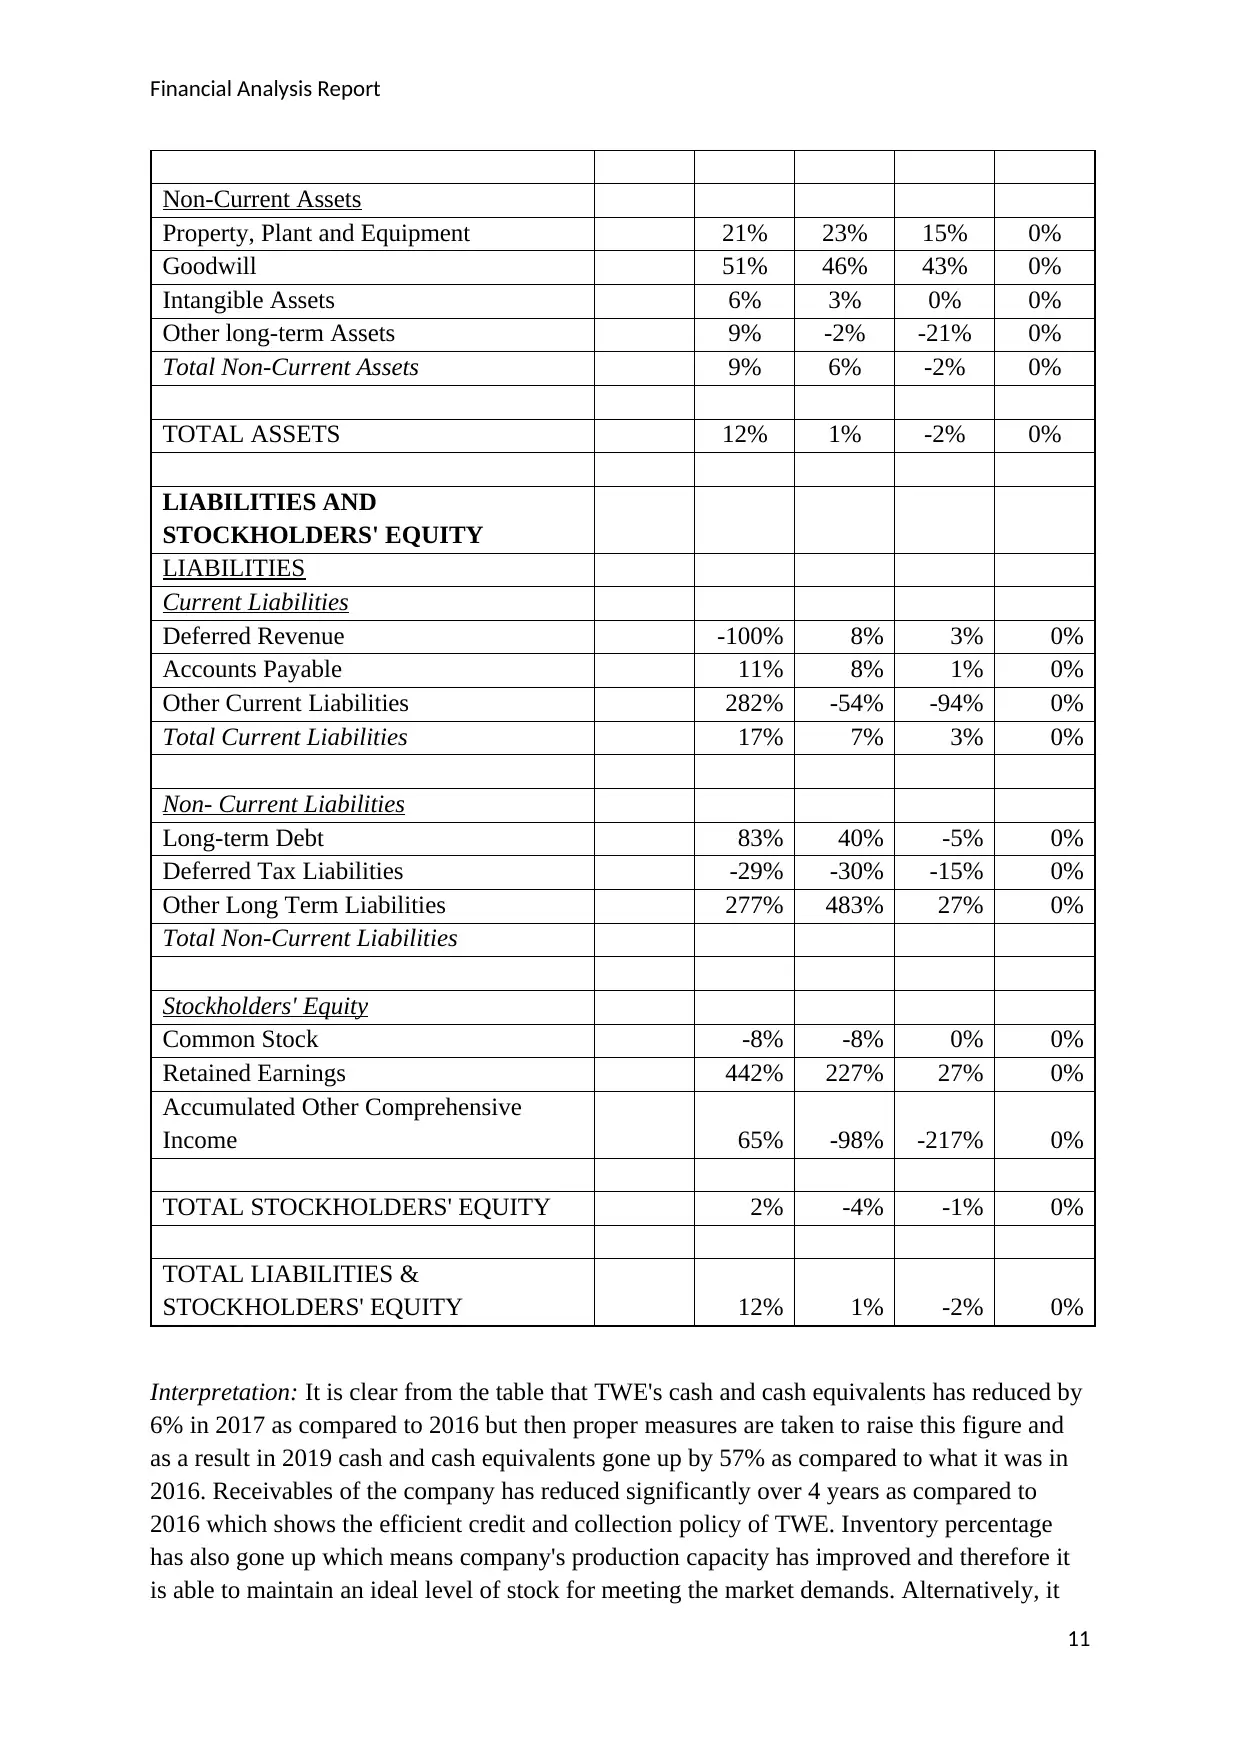
Interpretation: It is clear from the table that TWE's cash and cash equivalents has reduced by
6% in 2017 as compared to 2016 but then proper measures are taken to raise this figure and
as a result in 2019 cash and cash equivalents gone up by 57% as compared to what it was in
2016. Receivables of the company has reduced significantly over 4 years as compared to
2016 which shows the efficient credit and collection policy of TWE. Inventory percentage
has also gone up which means company's production capacity has improved and therefore it
is able to maintain an ideal level of stock for meeting the market demands. Alternatively, it
11
Non-Current Assets
Property, Plant and Equipment 21% 23% 15% 0%
Goodwill 51% 46% 43% 0%
Intangible Assets 6% 3% 0% 0%
Other long-term Assets 9% -2% -21% 0%
Total Non-Current Assets 9% 6% -2% 0%
TOTAL ASSETS 12% 1% -2% 0%
LIABILITIES AND
STOCKHOLDERS' EQUITY
LIABILITIES
Current Liabilities
Deferred Revenue -100% 8% 3% 0%
Accounts Payable 11% 8% 1% 0%
Other Current Liabilities 282% -54% -94% 0%
Total Current Liabilities 17% 7% 3% 0%
Non- Current Liabilities
Long-term Debt 83% 40% -5% 0%
Deferred Tax Liabilities -29% -30% -15% 0%
Other Long Term Liabilities 277% 483% 27% 0%
Total Non-Current Liabilities
Stockholders' Equity
Common Stock -8% -8% 0% 0%
Retained Earnings 442% 227% 27% 0%
Accumulated Other Comprehensive
Income 65% -98% -217% 0%
TOTAL STOCKHOLDERS' EQUITY 2% -4% -1% 0%
TOTAL LIABILITIES &
STOCKHOLDERS' EQUITY 12% 1% -2% 0%
Interpretation: It is clear from the table that TWE's cash and cash equivalents has reduced by
6% in 2017 as compared to 2016 but then proper measures are taken to raise this figure and
as a result in 2019 cash and cash equivalents gone up by 57% as compared to what it was in
2016. Receivables of the company has reduced significantly over 4 years as compared to
2016 which shows the efficient credit and collection policy of TWE. Inventory percentage
has also gone up which means company's production capacity has improved and therefore it
is able to maintain an ideal level of stock for meeting the market demands. Alternatively, it
11
Financial Analysis Report
may mean that TWE is unable to turn its inventory to sales. Company has also purchased
more fixed assets and worked really well to increase its goodwill value as compared to what
it was in 2016.Company has taken a good amount of debt for financing and expanding its
product portfolio as a result it rose by 83% in 2019 when compared to the debt of year 2016.
4. Four Years Horizontal Analysis of Treasury Wine Estate’s Income Statement
2019 2018 2017 2016
(in Thousands)
Total Revenue 29% 9% 8% 0%
Cost of Revenue 10% -5% 4% 0%
Gross Profit 69% 37% 15% 0%
Operating Expenses 4% -1% -1% 0%
Operating Income or loss 287% 166% 70% 0%
Interest Expense 186% 77% 35% 0%
Total Other Income -55% -41% 16% 0%
Income before Tax 128% 83% 49% 0%
Income Tax Expense 114% 44% 47% 0%
Income from continuing
Operations 134% 101% 50% 0%
Net Income 134% 101% 50% 0%
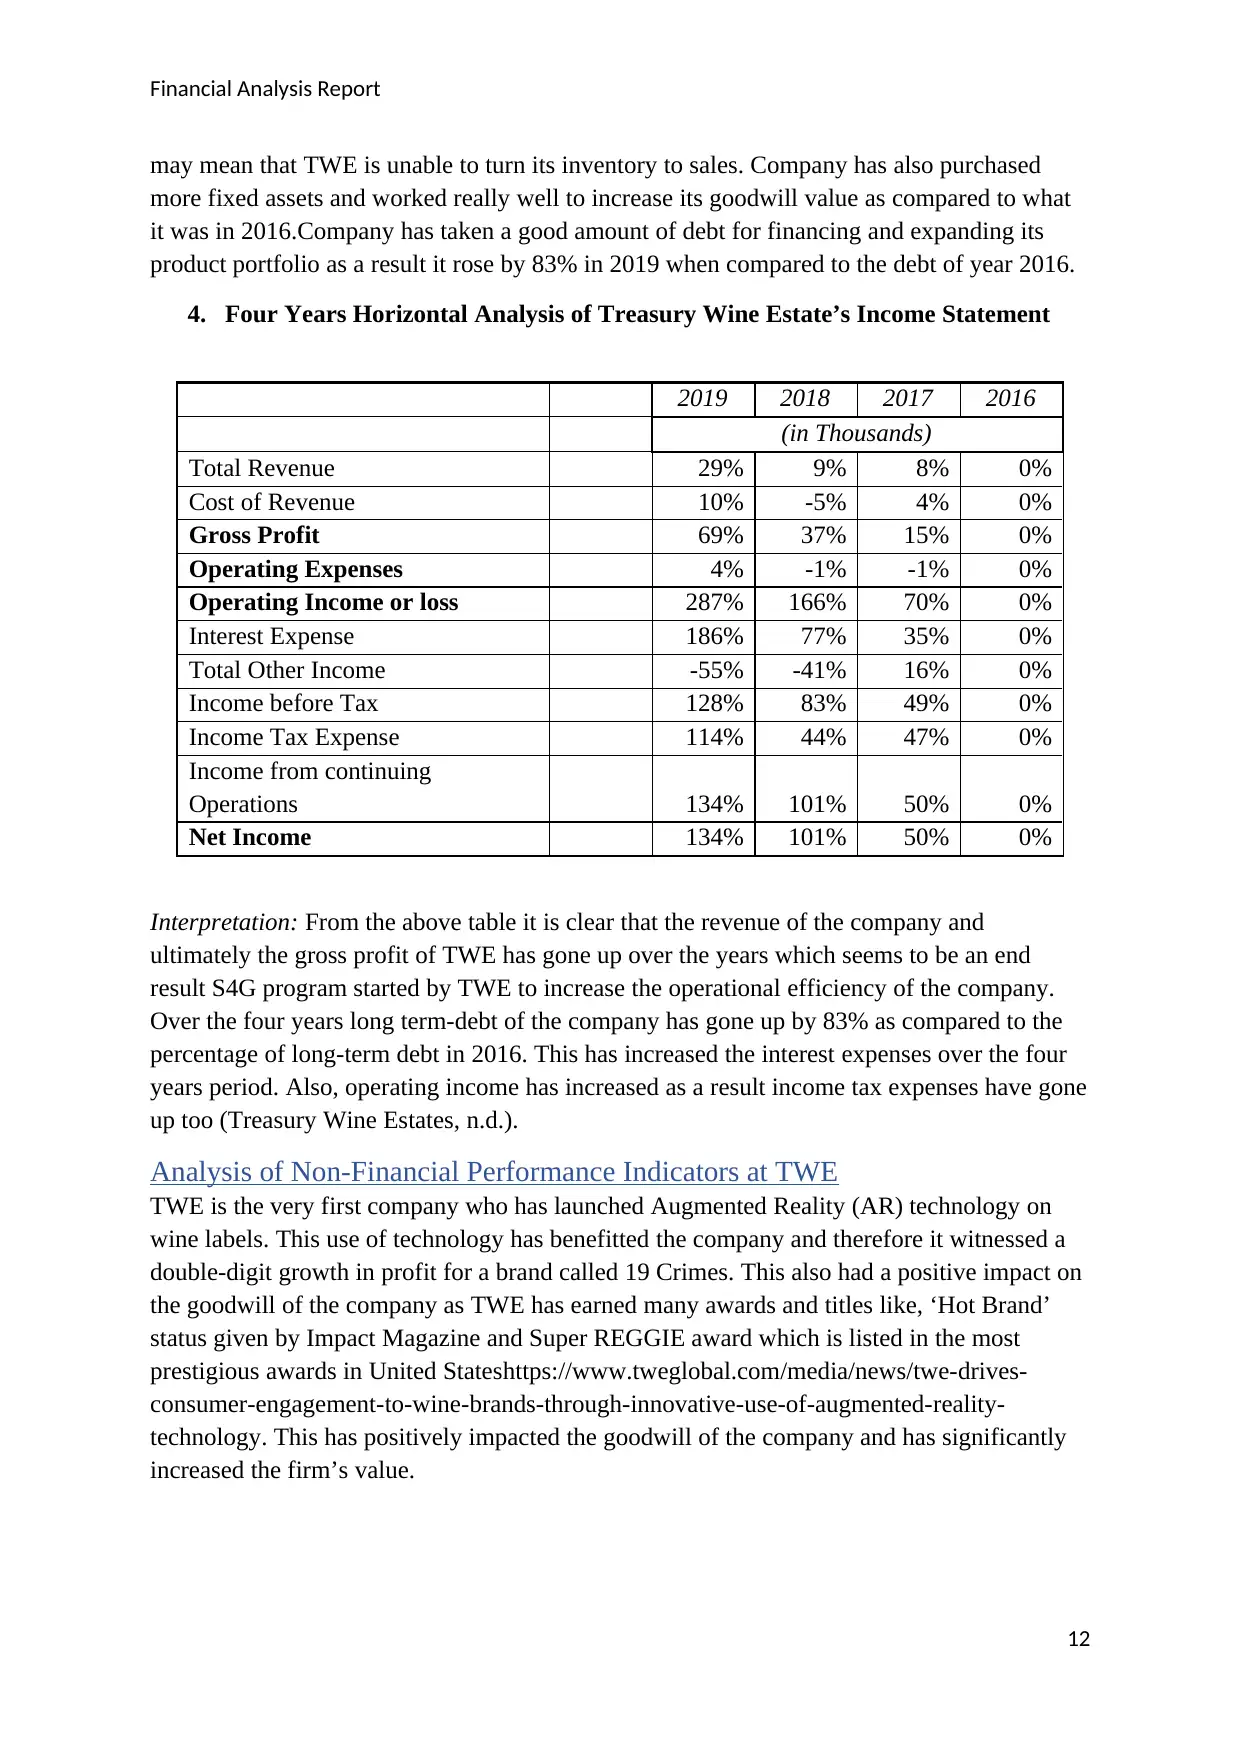
Interpretation: From the above table it is clear that the revenue of the company and
ultimately the gross profit of TWE has gone up over the years which seems to be an end
result S4G program started by TWE to increase the operational efficiency of the company.
Over the four years long term-debt of the company has gone up by 83% as compared to the
percentage of long-term debt in 2016. This has increased the interest expenses over the four
years period. Also, operating income has increased as a result income tax expenses have gone
up too (Treasury Wine Estates, n.d.).
Analysis of Non-Financial Performance Indicators at TWE
TWE is the very first company who has launched Augmented Reality (AR) technology on
wine labels. This use of technology has benefitted the company and therefore it witnessed a
double-digit growth in profit for a brand called 19 Crimes. This also had a positive impact on
the goodwill of the company as TWE has earned many awards and titles like, ‘Hot Brand’
status given by Impact Magazine and Super REGGIE award which is listed in the most
prestigious awards in United Stateshttps://www.tweglobal.com/media/news/twe-drives-
consumer-engagement-to-wine-brands-through-innovative-use-of-augmented-reality-
technology. This has positively impacted the goodwill of the company and has significantly
increased the firm’s value.
12
may mean that TWE is unable to turn its inventory to sales. Company has also purchased
more fixed assets and worked really well to increase its goodwill value as compared to what
it was in 2016.Company has taken a good amount of debt for financing and expanding its
product portfolio as a result it rose by 83% in 2019 when compared to the debt of year 2016.
4. Four Years Horizontal Analysis of Treasury Wine Estate’s Income Statement
2019 2018 2017 2016
(in Thousands)
Total Revenue 29% 9% 8% 0%
Cost of Revenue 10% -5% 4% 0%
Gross Profit 69% 37% 15% 0%
Operating Expenses 4% -1% -1% 0%
Operating Income or loss 287% 166% 70% 0%
Interest Expense 186% 77% 35% 0%
Total Other Income -55% -41% 16% 0%
Income before Tax 128% 83% 49% 0%
Income Tax Expense 114% 44% 47% 0%
Income from continuing
Operations 134% 101% 50% 0%
Net Income 134% 101% 50% 0%
Interpretation: From the above table it is clear that the revenue of the company and
ultimately the gross profit of TWE has gone up over the years which seems to be an end
result S4G program started by TWE to increase the operational efficiency of the company.
Over the four years long term-debt of the company has gone up by 83% as compared to the
percentage of long-term debt in 2016. This has increased the interest expenses over the four
years period. Also, operating income has increased as a result income tax expenses have gone
up too (Treasury Wine Estates, n.d.).
Analysis of Non-Financial Performance Indicators at TWE
TWE is the very first company who has launched Augmented Reality (AR) technology on
wine labels. This use of technology has benefitted the company and therefore it witnessed a
double-digit growth in profit for a brand called 19 Crimes. This also had a positive impact on
the goodwill of the company as TWE has earned many awards and titles like, ‘Hot Brand’
status given by Impact Magazine and Super REGGIE award which is listed in the most
prestigious awards in United Stateshttps://www.tweglobal.com/media/news/twe-drives-
consumer-engagement-to-wine-brands-through-innovative-use-of-augmented-reality-
technology. This has positively impacted the goodwill of the company and has significantly
increased the firm’s value.
12
Paraphrase This Document
Need a fresh take? Get an instant paraphrase of this document with our AI Paraphraser
Financial Analysis Report
3. Conclusion
Programs like S4G and non-IFRS assessment has helped Treasury Wine Estate to improve its
operational efficiency. These have shown a positive impact on the gross profit and ultimately
the net profit of the company. Apart from this, debt to equity ratio has always remained less
than one over 4 years. Turnover ratios have also improved. Therefore, it is advisable for the
shareholders to invest in the company.
Apart from this, company’s current ratio and quick ratio has always been more than one.
TWE’s interest coverage ratio has also improved over the years. Therefore, for debtors it is
safe to extend loan to the company.
TWE’s inventory has gone up by 13% as a percentage of what it was in year 2016. However,
there has been no significant change in inventory turnover ratio over the four years.
Therefore, management of the company is recommended to check the reason behind the
increased inventory level.
References
Annual 2018 financial result, 2018. Treasury Wine Estates Annual 2018 financial result.
Available at: https://www.tweglobal.com/-/media
/Files/Global/ASX-Announcements/2018/2018-Annual-Results-Announcement.ashx (16
February, 2020).
Cleartax, 2019. Activity Ratios with Formula and Example. Available at:
https://cleartax.in/s/activity-ratios-formula-example (16 February, 2020).
DeBenedetti, J. n.d. Examples of Solvency Ratios. Available at:
https://smallbusiness.chron.com/examples-solvency-ratios-81476.html (16 February, 2020).
Morningstar, n.d. Liquidity Ratios. Available at:
https://news.morningstar.com/classroom2/course.asp?docId=145093&page=4&CN=sample
(16 February, 2020).
Treasury Wine Estates, n.d. About Us. Available at: https://www.tweglobal.com/about (16
February, 2020).
Treasury Wine Estates, n.d. Waste and Packaging. Available at:
https://www.tweglobal.com/sustainability/planet-page/waste-and-packaging (16 February,
2020).
Treasury Wine Estates, n.d. TWE drives consumer engagement to wine brands through
innovative use of Augmented Reality technology. Available at:
https://www.tweglobal.com/media/news/twe-drives-consumer-engagement-to-wine-brands-
through-innovative-use-of-augmented-reality-technology (16 February, 2020).
13
Financial Analysis Report
ReadyRatios, n.d. Profitability ratios. Available at:
https://www.readyratios.com/reference/profitability/ (16 February, 2020).
Yahoo Finance, n.d. Treasury Wine Estates Limited (TWE.AX). Available at:
https://au.finance.yahoo.com/quote/TWE.AX/balance-sheet?p=TWE.AX (16 February,
2020).
APPENDIX
14
ReadyRatios, n.d. Profitability ratios. Available at:
https://www.readyratios.com/reference/profitability/ (16 February, 2020).
Yahoo Finance, n.d. Treasury Wine Estates Limited (TWE.AX). Available at:
https://au.finance.yahoo.com/quote/TWE.AX/balance-sheet?p=TWE.AX (16 February,
2020).
APPENDIX
14
1 out of 15
Related Documents


Your All-in-One AI-Powered Toolkit for Academic Success.
+13062052269
info@desklib.com
Available 24*7 on WhatsApp / Email
![[object Object]](/_next/static/media/star-bottom.7253800d.svg)
Unlock your academic potential
© 2024 | Zucol Services PVT LTD | All rights reserved.