Financial Performance Analysis: Bristol Myers Squibb and Eli Lilly

Verified

Added on  2023/06/11

|7
|1148
|443
Report
AI Summary
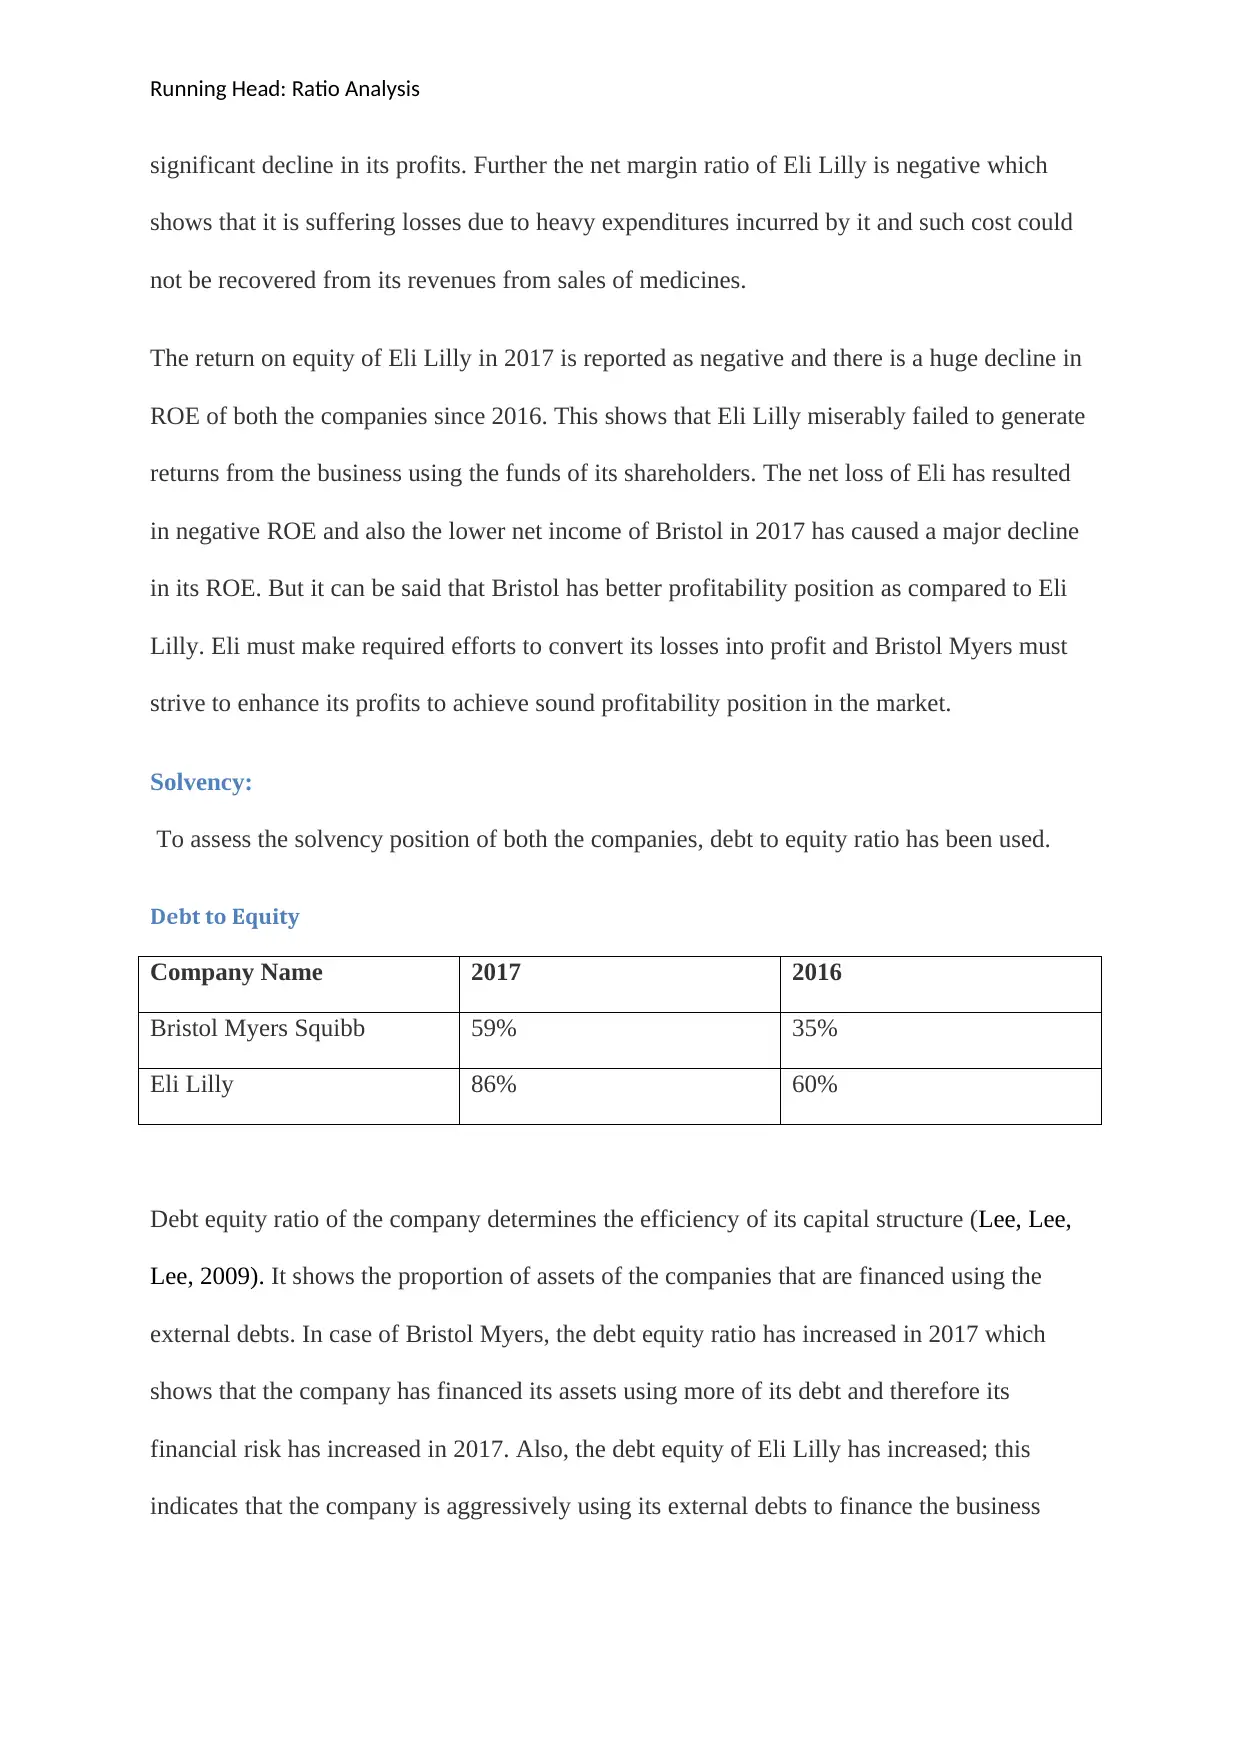
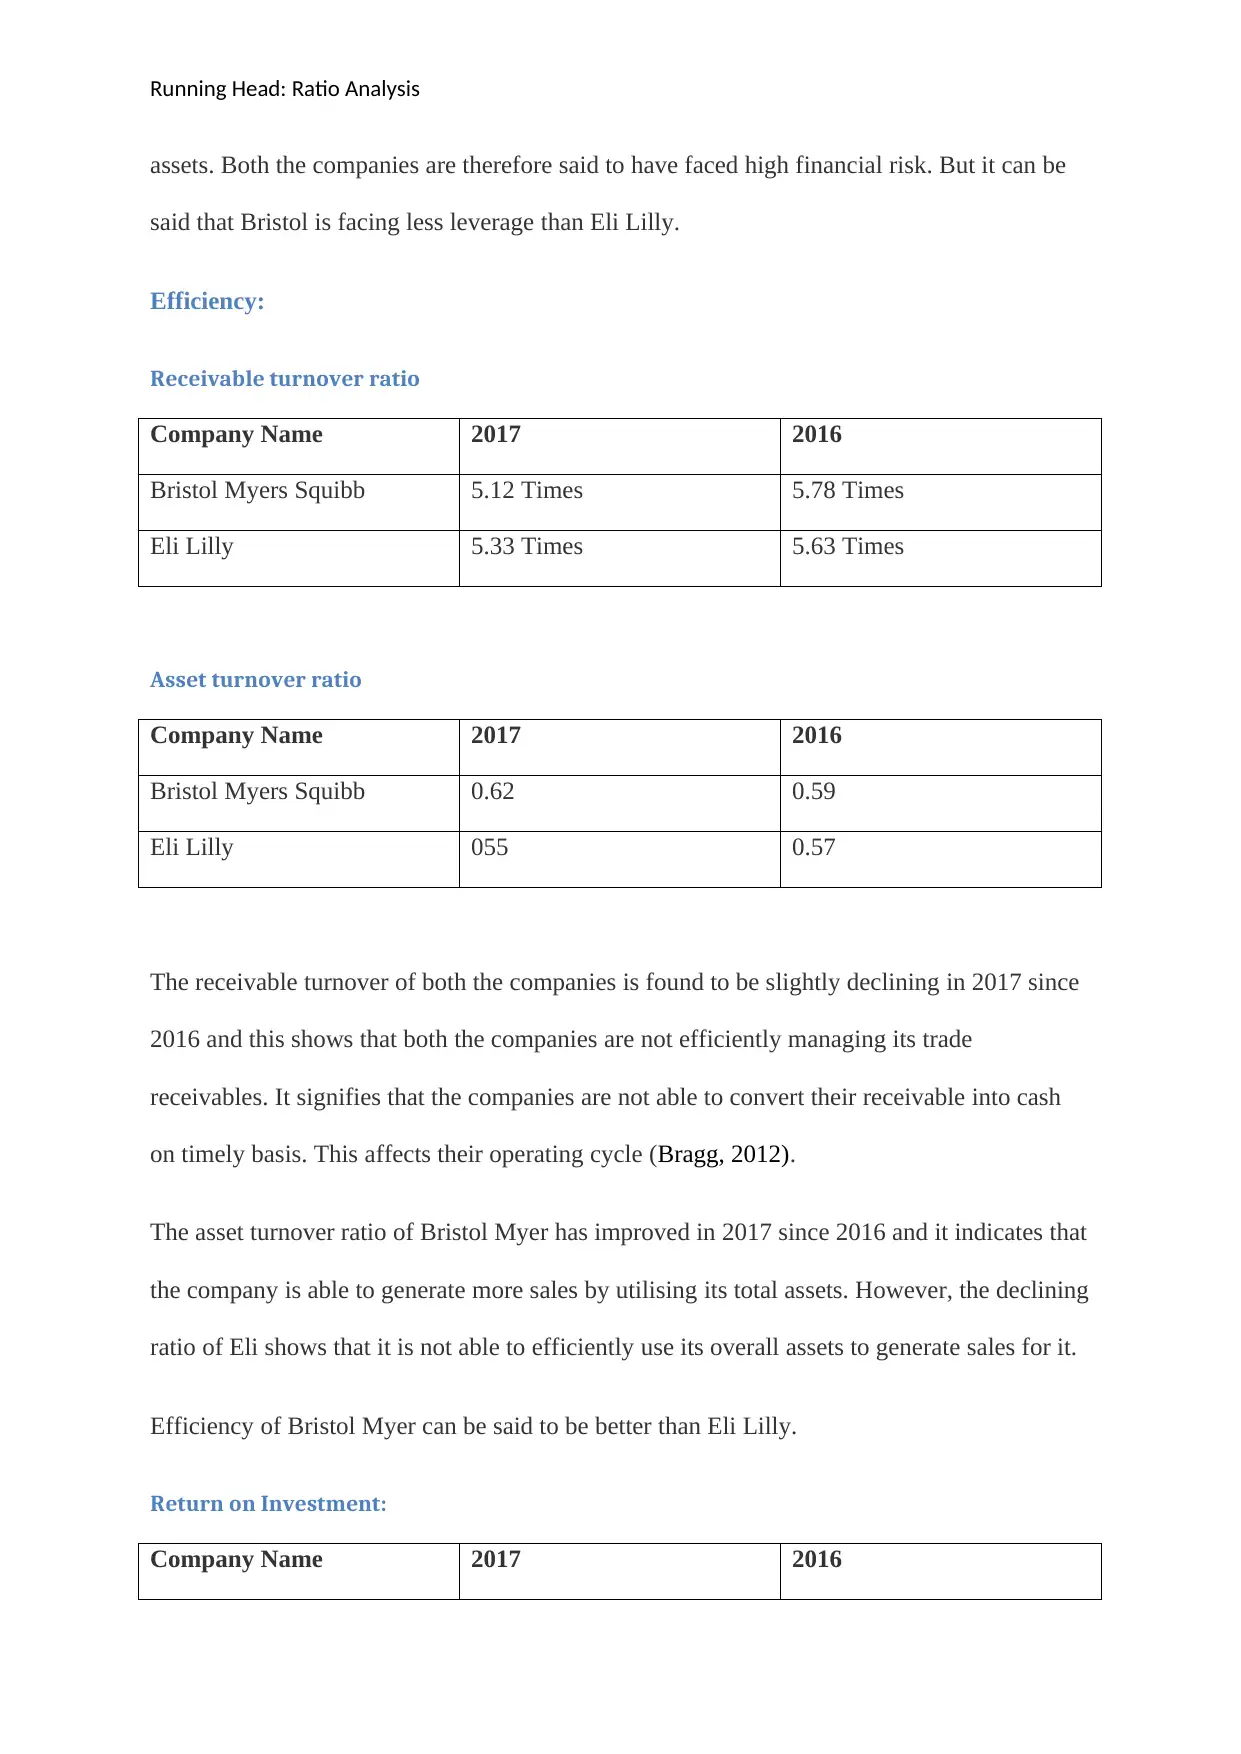
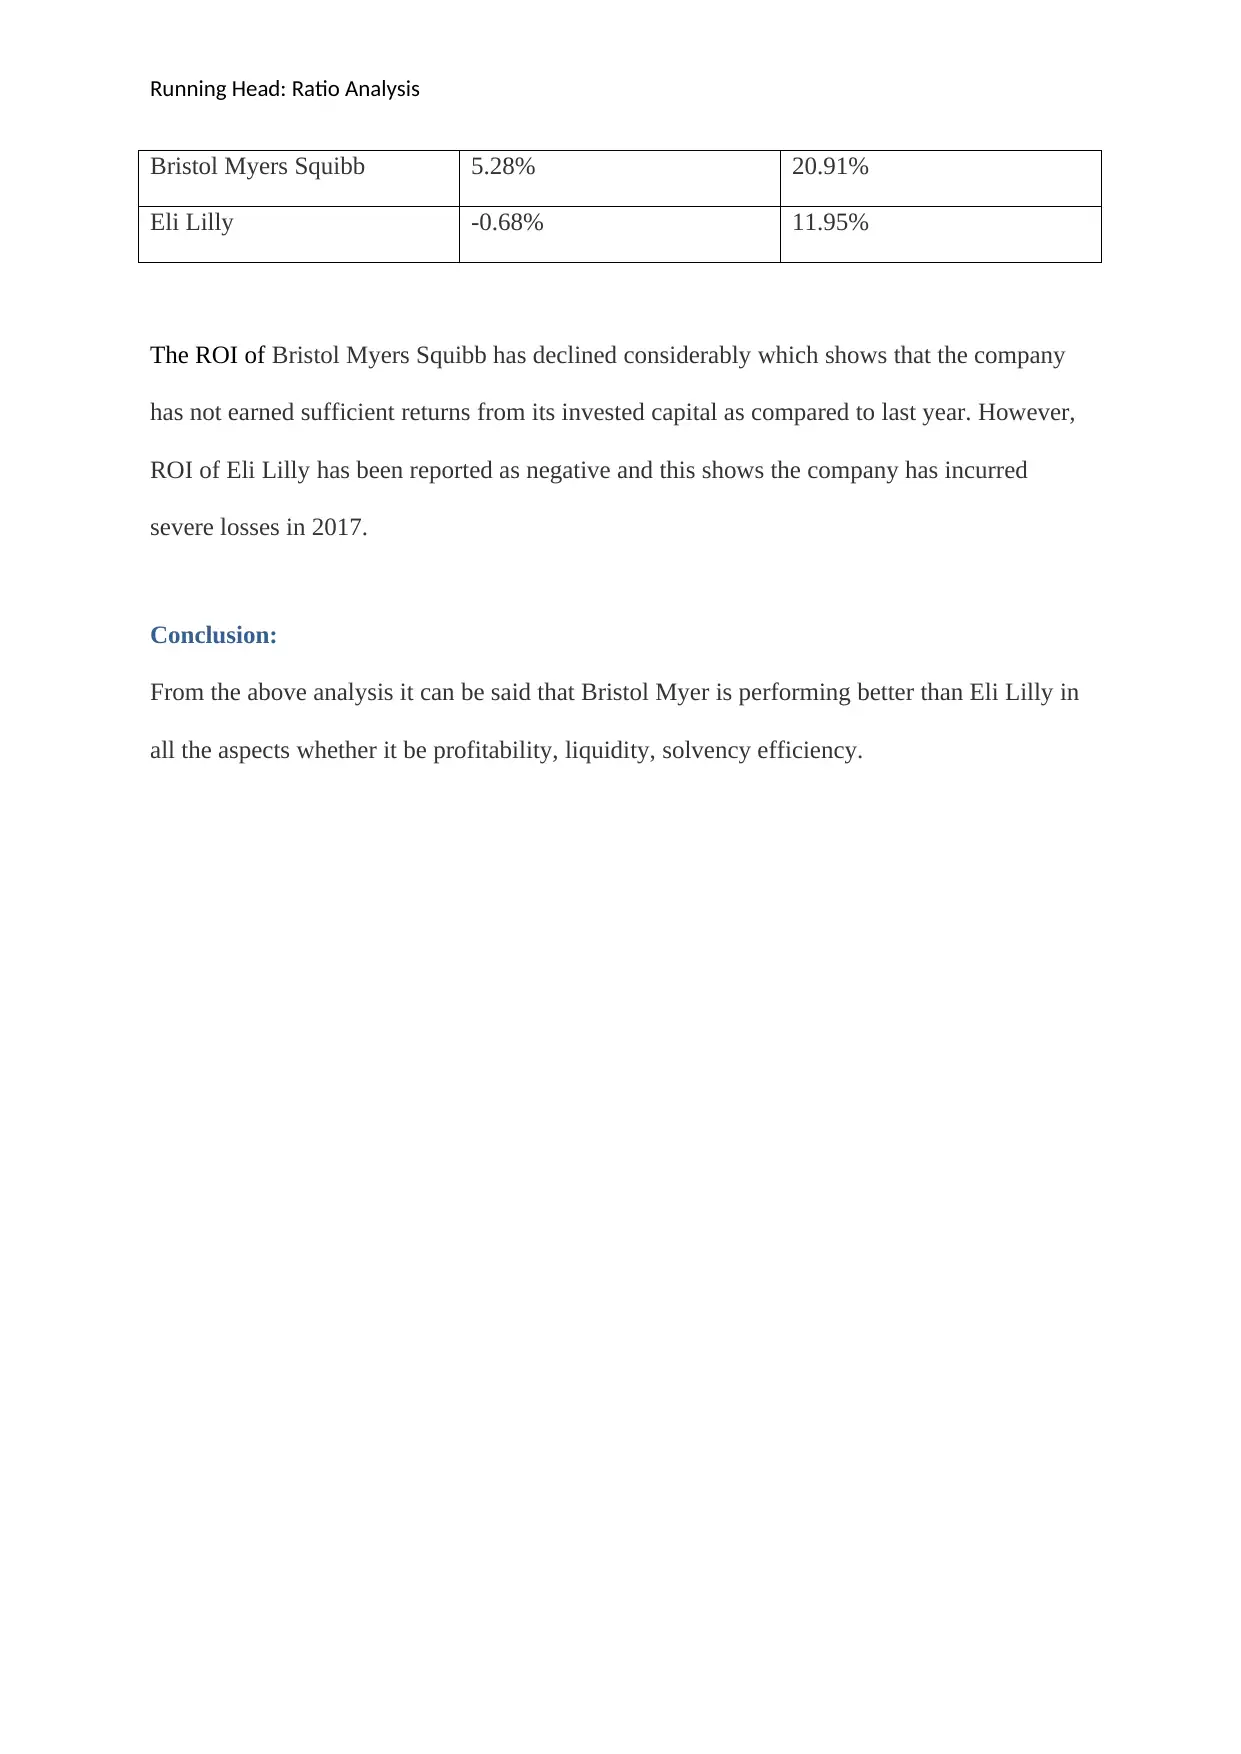
This report conducts a financial analysis of Bristol Myers Squibb and Eli Lilly, two pharmaceutical companies listed on the New York Stock Exchange, using ratio analysis to assess their liquidity, profitability, solvency, and efficiency. The analysis reveals that neither company meets the ideal current ratio benchmark for liquidity, though Bristol Myers has a better liquidity position than Eli Lilly. Bristol Myers faces challenges in maintaining profitability, while Eli Lilly reports losses, resulting in a negative return on equity. Both companies show increased debt-to-equity ratios, indicating higher financial risk, but Bristol Myers exhibits less leverage than Eli Lilly. Receivable turnover is declining for both, suggesting inefficient management of trade receivables, while Bristol Myers shows improved asset turnover. Overall, Bristol Myers Squibb demonstrates better performance than Eli Lilly across key financial metrics.
Document Page
Running Head: Ratio Analysis
FINANCIAL ANALYSIS REPORT
tabler-icon-diamond-filled.svg

Paraphrase This Document

Need a fresh take? Get an instant paraphrase of this document with our AI Paraphraser
Document Page
Running Head: Ratio Analysis
Introduction
This report analyses the financial position of two pharmaceutical companies viz. Bristol
Myers Squibb and Eli Lilly. Both the companies are listed on New York Stock Exchange.
The companies are globally engaged in their business of manufacturing of various kinds of
pharmaceutical medications. Bristol Myers is headquartered in New York City and Eli Lilly
is headquartered in Indianapolis.
Ratio Analysis:
Liquidity:
To analyse the profitability position of both the companies, current ratio and quick ratio have
been used and analysed.
Current ratio:
Company Name 2017 2016
Bristol Myers Squibb 1.55:1 1.55:1
Eli Lilly 1.32:1 1.37:1
Quick ratio:
Company Name 2017 2016
Bristol Myers Squibb 1.37:1 1.35:1
Eli Lilly 0.91:1 0.98:1
Document Page
Running Head: Ratio Analysis
The ideal current ratio is 2:1 which means that company must at-least have current assets of
twice the value of its current liabilities to maintain a satisfactory liquidity position in the
market. However, both the companies in the present case have not met the ideal benchmark.
Therefore, their liquidity position in year 2017 and 2016 cannot be said to be satisfactory.
When company’s liquid assets are considered, the inventory and prepaid expenses are not be
included in the current assets as they are not easily convertible into cash and they are not
liquid in nature. However, Bristol Myers is having better liquidity position than Eli Lilly.
Profitability:
To analyse the profitability position of both the companies, net profit margin and return on
equity ratio have been used and analysed.
Net profit margin
Company Name 2017 2016
Bristol Myers Squibb 4.85% 22.94%
Eli Lilly -0.89% 12.90%
Return on equity
Company Name 2017 2016
Bristol Myers Squibb 7.21% 29.28%
Eli Lilly -1.59% 19.16%
It can be observed from the above ratios that Bristol Myers is facing difficulty to maintain
sound profitability position in the market as its profits are majorly declining since 2016.
Though the revenue of Bristol Myer has increased but yet it could not improve its
profitability position because of increase in operating and other expenses and it has resulted
Document Page
Running Head: Ratio Analysis
significant decline in its profits. Further the net margin ratio of Eli Lilly is negative which
shows that it is suffering losses due to heavy expenditures incurred by it and such cost could
not be recovered from its revenues from sales of medicines.
The return on equity of Eli Lilly in 2017 is reported as negative and there is a huge decline in
ROE of both the companies since 2016. This shows that Eli Lilly miserably failed to generate
returns from the business using the funds of its shareholders. The net loss of Eli has resulted
in negative ROE and also the lower net income of Bristol in 2017 has caused a major decline
in its ROE. But it can be said that Bristol has better profitability position as compared to Eli
Lilly. Eli must make required efforts to convert its losses into profit and Bristol Myers must
strive to enhance its profits to achieve sound profitability position in the market.
Solvency:
To assess the solvency position of both the companies, debt to equity ratio has been used.
Debt to Equity
Company Name 2017 2016
Bristol Myers Squibb 59% 35%
Eli Lilly 86% 60%
Debt equity ratio of the company determines the efficiency of its capital structure (Lee, Lee,
Lee, 2009). It shows the proportion of assets of the companies that are financed using the
external debts. In case of Bristol Myers, the debt equity ratio has increased in 2017 which
shows that the company has financed its assets using more of its debt and therefore its
financial risk has increased in 2017. Also, the debt equity of Eli Lilly has increased; this
indicates that the company is aggressively using its external debts to finance the business
tabler-icon-diamond-filled.svg

Paraphrase This Document

Need a fresh take? Get an instant paraphrase of this document with our AI Paraphraser
Document Page
Running Head: Ratio Analysis
assets. Both the companies are therefore said to have faced high financial risk. But it can be
said that Bristol is facing less leverage than Eli Lilly.
Efficiency:
Receivable turnover ratio
Company Name 2017 2016
Bristol Myers Squibb 5.12 Times 5.78 Times
Eli Lilly 5.33 Times 5.63 Times
Asset turnover ratio
Company Name 2017 2016
Bristol Myers Squibb 0.62 0.59
Eli Lilly 055 0.57
The receivable turnover of both the companies is found to be slightly declining in 2017 since
2016 and this shows that both the companies are not efficiently managing its trade
receivables. It signifies that the companies are not able to convert their receivable into cash
on timely basis. This affects their operating cycle (Bragg, 2012).
The asset turnover ratio of Bristol Myer has improved in 2017 since 2016 and it indicates that
the company is able to generate more sales by utilising its total assets. However, the declining
ratio of Eli shows that it is not able to efficiently use its overall assets to generate sales for it.
Efficiency of Bristol Myer can be said to be better than Eli Lilly.
Return on Investment:
Company Name 2017 2016
Document Page
Running Head: Ratio Analysis
Bristol Myers Squibb 5.28% 20.91%
Eli Lilly -0.68% 11.95%
The ROI of Bristol Myers Squibb has declined considerably which shows that the company
has not earned sufficient returns from its invested capital as compared to last year. However,
ROI of Eli Lilly has been reported as negative and this shows the company has incurred
severe losses in 2017.
Conclusion:
From the above analysis it can be said that Bristol Myer is performing better than Eli Lilly in
all the aspects whether it be profitability, liquidity, solvency efficiency.
Document Page
Running Head: Ratio Analysis
References:
Bragg, S. M. (2012). Business ratios and formulas: a comprehensive guide (Vol. 577). New
Jersy: John Wiley and Sons.
Lee, A. C., Lee, J. C., and Lee, C. F. (2009). Financial analysis, planning and forecasting:
Theory and application. Singapore: World Scientific Publishing Co Inc.
Morning Star. (2018). Eli Lilly. Retrieved from: <
https://financials.morningstar.com/ratios/r.html?t=LLY> Accessed on: 24.06.2018.
Morning Star. (2018). Bristol-Myers Squibb Company: Key Financial Ratios. Retrieved
from: < http://financials.morningstar.com/ratios/r.html?t=BMY#tab-profitability>
Accessed on: 24.06.2018.
chevron_up_icon
1 out of 7
circle_padding
hide_on_mobile
zoom_out_icon
[object Object]