Financial Analysis | Task Report
14 Pages3027 Words19 Views
Added on 2022-09-12
Financial Analysis | Task Report
Added on 2022-09-12
ShareRelated Documents
Financial Analysis
Financial Analysis 1
Tasks
A. Financial Ratios
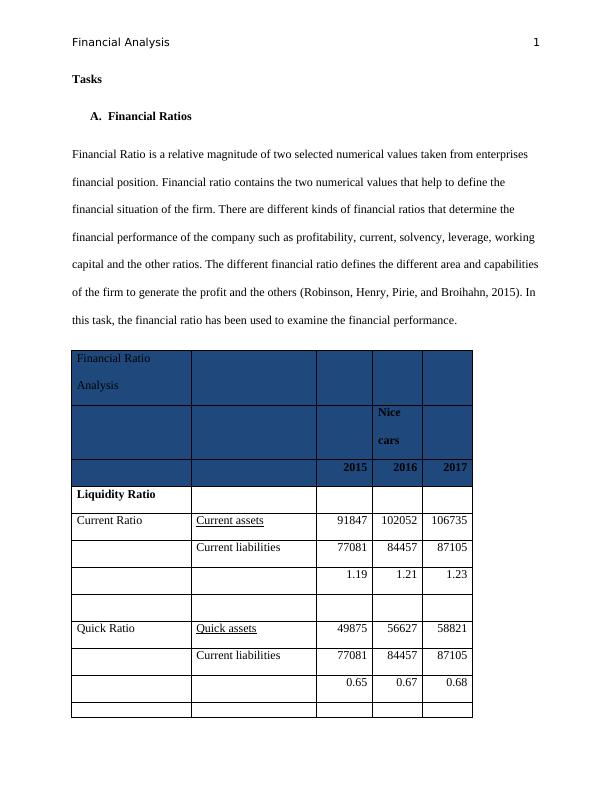
Financial Ratio is a relative magnitude of two selected numerical values taken from enterprises
financial position. Financial ratio contains the two numerical values that help to define the
financial situation of the firm. There are different kinds of financial ratios that determine the
financial performance of the company such as profitability, current, solvency, leverage, working
capital and the other ratios. The different financial ratio defines the different area and capabilities
of the firm to generate the profit and the others (Robinson, Henry, Pirie, and Broihahn, 2015). In
this task, the financial ratio has been used to examine the financial performance.
Financial Ratio
Analysis
Nice
cars
2015 2016 2017
Liquidity Ratio
Current Ratio Current assets 91847 102052 106735
Current liabilities 77081 84457 87105
1.19 1.21 1.23
Quick Ratio Quick assets 49875 56627 58821
Current liabilities 77081 84457 87105
0.65 0.67 0.68
Tasks
A. Financial Ratios
Financial Ratio is a relative magnitude of two selected numerical values taken from enterprises
financial position. Financial ratio contains the two numerical values that help to define the
financial situation of the firm. There are different kinds of financial ratios that determine the
financial performance of the company such as profitability, current, solvency, leverage, working
capital and the other ratios. The different financial ratio defines the different area and capabilities
of the firm to generate the profit and the others (Robinson, Henry, Pirie, and Broihahn, 2015). In
this task, the financial ratio has been used to examine the financial performance.
Financial Ratio
Analysis
Nice
cars
2015 2016 2017
Liquidity Ratio
Current Ratio Current assets 91847 102052 106735
Current liabilities 77081 84457 87105
1.19 1.21 1.23
Quick Ratio Quick assets 49875 56627 58821
Current liabilities 77081 84457 87105
0.65 0.67 0.68
Financial Analysis 2
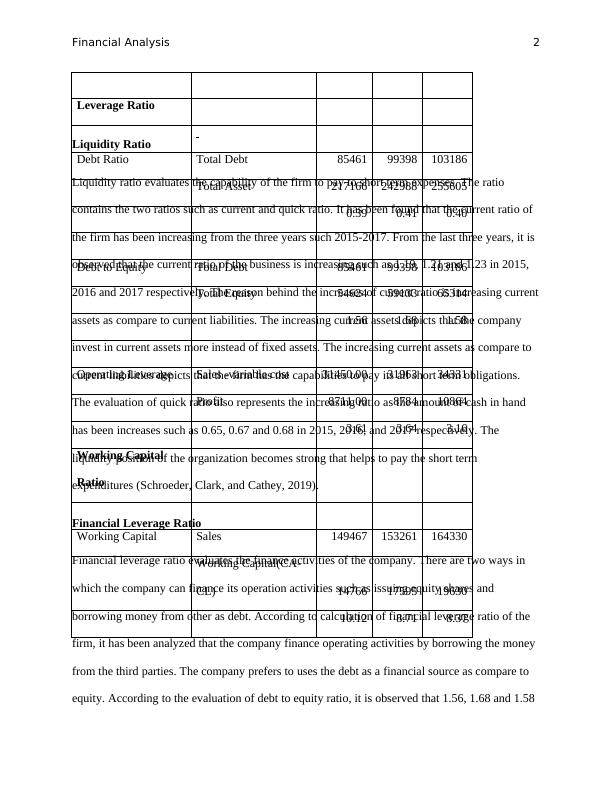
Leverage Ratio
Debt Ratio Total Debt 85461 99398 103186
Total Asset 217166 242988 255605
0.39 0.41 0.40
Debt to Equity Total Debt 85461 99398 103186
Total Equity 54624 59133 65314
1.56 1.68 1.58
Operating Leverage Sales -variable cost 31450.00 31963 34331
Profit 8711.00 8784 10864
3.61 3.64 3.16
Working Capital
Ratio
Working Capital Sales 149467 153261 164330
Working Capital(CA-
CL) 14766 17595 19630
10.12 8.71 8.37
Liquidity Ratio
Liquidity ratio evaluates the capability of the firm to pay to short term expenses. The ratio
contains the two ratios such as current and quick ratio. It has been found that the current ratio of
the firm has been increasing from the three years such 2015-2017. From the last three years, it is
observed that the current ratio of the business is increasing such as 1.19, 1.21 and 1.23 in 2015,
2016 and 2017 respectively. The reason behind the increases of current ratio is increasing current
assets as compare to current liabilities. The increasing current assets depicts that the company
invest in current assets more instead of fixed assets. The increasing current assets as compare to
current liabilities depicts that the firm has the capabilities to pay its all short term obligations.
The evaluation of quick ratio also represents the increasing ratio as the amount of cash in hand
has been increases such as 0.65, 0.67 and 0.68 in 2015, 2016, and 2017 respectively. The
liquidity position of the organization becomes strong that helps to pay the short term
expenditures (Schroeder, Clark, and Cathey, 2019).
Financial Leverage Ratio
Financial leverage ratio evaluates the finance activities of the company. There are two ways in
which the company can finance its operation activities such as issuing equity shares and
borrowing money from other as debt. According to calculation of financial leverage ratio of the
firm, it has been analyzed that the company finance operating activities by borrowing the money
from the third parties. The company prefers to uses the debt as a financial source as compare to
equity. According to the evaluation of debt to equity ratio, it is observed that 1.56, 1.68 and 1.58
Financial Analysis 3
are the ratio in the three years such as 2015, 2016 and 2017 respectively. As per the financial
ratio result, it depicts that the company uses the debt as source to finance the operation activities.
It affects the financial position of the company in coming future as debt can increases the
chances of insolvency (Williams, and Dobelman, 2017).
Operation Leverage Ratio
Operation leverage ratio is a financial efficiency ratio that has been measured percentage of
using the fixed cost in order to generate the profits. As per the calculation of operating leverage
ratio, the amount of leverage ratio is increasing from 3.61, 3.64 and 3.16 in the year 2015, 2016,
and 2017 respectively. The company has the capability to generate the revenue has been
increases.
Working Capital Ratio
Working capital ratio is also a part of liquidity as it helps to evaluate the liquidity of the firm to
pay the short term obligations. The ratio of working capital has been evaluated with the help of
current assets and current liabilities (Storey, Keasey, Watson, and Wynarczyk, 2016). According
to the evaluation of working capital ratio, it has been determined that the situation of capital
employed has been increases from the year 2015, 2016 and 2017 such as 14766, 17595 and
19630 respectively. Sales amount to the company has been increases from the three years but the
ratio of working capital has been decreases. The decreasing working capital ratio 10.12, 8.71 and
8.37 depicts the ability of the firm has been decreases to pay the all the obligations.
B. Financial Ratios of Competitors
End of preview
Want to access all the pages? Upload your documents or become a member.
Related Documents
Principles of Financelg...
|6
|358
|75
Financial Ratio Analysis of BEGA Cheese Limitedlg...
|10
|2181
|235
Return on Shareholder's Equity Assignmentlg...
|3
|394
|86
Business Policy Assignment 2022lg...
|2
|272
|117
Answer 1: Financial Statements for Managing Companieslg...
|10
|3351
|210
financial accountinglg...
|13
|369
|84