Accounting Financial Analysis Report
VerifiedAdded on 2023/06/15
|21
|4907
|439
AI Summary
This report provides a financial analysis of Tesco and Morrison, including profitability, liquidity, and capital structure ratios. The report includes an introduction to the companies, their market and products, and their trading history. The profitability ratios include gross profit ratio, net profit margin, return on equity, and operating profit margin. The liquidity ratios include current ratio, quick ratio, and cash ratio. The capital structure ratio includes debt ratio, equity ratio, debt-equity ratio, and gearing ratio.
Contribute Materials
Your contribution can guide someone’s learning journey. Share your
documents today.
Running head: ACCOUNTING FINANCIAL ANALYSIS REPORT
Accounting Financial Analysis Report
Name of the Student
Name of the University
Authors Note
Course ID
Accounting Financial Analysis Report
Name of the Student
Name of the University
Authors Note
Course ID
Secure Best Marks with AI Grader
Need help grading? Try our AI Grader for instant feedback on your assignments.
1ACCOUNTING FINANCIAL ANALYSIS REPORT
Table of Contents
Introduction:...............................................................................................................................2
Financial Analysis:.....................................................................................................................3
Profitability Ratio:......................................................................................................................3
Liquidity ratios:..........................................................................................................................6
Capital structure Ratio:..............................................................................................................8
Efficiency ratio:........................................................................................................................10
Sustainability Reporting Disclosures:......................................................................................11
Conclusion:..............................................................................................................................13
Reference List:.........................................................................................................................15
Appendix:.................................................................................................................................17
Computation of Tesco Ratios:..................................................................................................17
Computation of WM Morrison Ratios:....................................................................................17
2ACCOUNTING FINANCIAL ANALYSIS REPORT
Introduction:
Jack Cohen the son of Jewish migrants from Poland was the founder of Tesco in 1919
when they commenced selling war surplus groceries from the Well Street Market. The brand
of Tesco initially appeared in the year 1924. The first store of Tesco was first opened during
the year 1931 in September at Middlesex (Tesco plc 2018). The company was first floated on
the London stock exchange during the year 1947 as the Tesco Stores Holding Limited.
Concerning the market and products of Tesco, it is multinational grocery and general
merchandise retailer having its headquarter in Welwyn Garden City UK.
In terms of profit Tesco is regarded as the third largest retailer in the world market
and ninth largest in the world in terms of the revenue. Tesco market its products in 12
countries throughout the Asian and European market. Tesco is regarded as the leader in
grocery market in UK. Concerning the operations Tesco purchases a wide range of goods and
services, covering everything from the marketing to haulage and consumables (Tesco plc
2018). The UK operations of Tesco ranges from Tesco superstore, Tesco express, One stop
etc. Tesco extra store are generally larger because of the out of town hypermarkets that stocks
around all of the products of Tesco. Concerning the trading history of the company it can be
stated that current share price figures suggest a reasonable price of 487p. Particularly it
reflects that Tesco was trading at the historic price earnings of 25p. Presently the outlook of
Tesco appears overcast though the revenue of company continues to expand however the
profit margins have declined. It is difficult for Tesco to return to 487p.
On the other hand, Morrison Plc was founded in the year 1899 by William Morrison
who initially commenced the business as the egg and butter merchant in Bradford England
operating under the name of WM Morrison Ltd. His son in the year 1952 overtook from
William Morrison and became the first store that had price displayed on the products
3ACCOUNTING FINANCIAL ANALYSIS REPORT
(Morrisons-corporate.com 2018). During the year 1967 the company became the listed public
on the London Stock Exchange. WM Supermarkets. Morrison Supermarkets Plc is regarded
as the fourth largest chain of supermarkets in UK. Concerning the market share of Morrison
Plc in the middle part of 2015 the company was still regarded as the big four supermarkets
having a market share of 11% which though marginally declined by 0.3 in 2014.
Not like other supermarkets, Morrison manufacture a substantial amount of their own
food products at 16 sites in the UK. Morrison keeps a thousand of lines products that are sold
as their own brand goods ranging from food and drink. Concerning the present operations of
Morrison, it has around 498 superstores in UK. The superstore is largely located in English
Midlands and North of England. Morrison Supermarkets year on year growth rate has been
negative over the last five years. However, the current trading background suggest that the
average earnings has gone above average with one year earnings growth exceeding yearly
average of 58.2% against the -25.3%.
Financial Analysis:
Profitability Ratio:
The profitability ratio measures the profit deriving capacity of any business. This ratio
assesses the overall performance of the business indicating the extent to which the business
makes profit (Scott 2015).
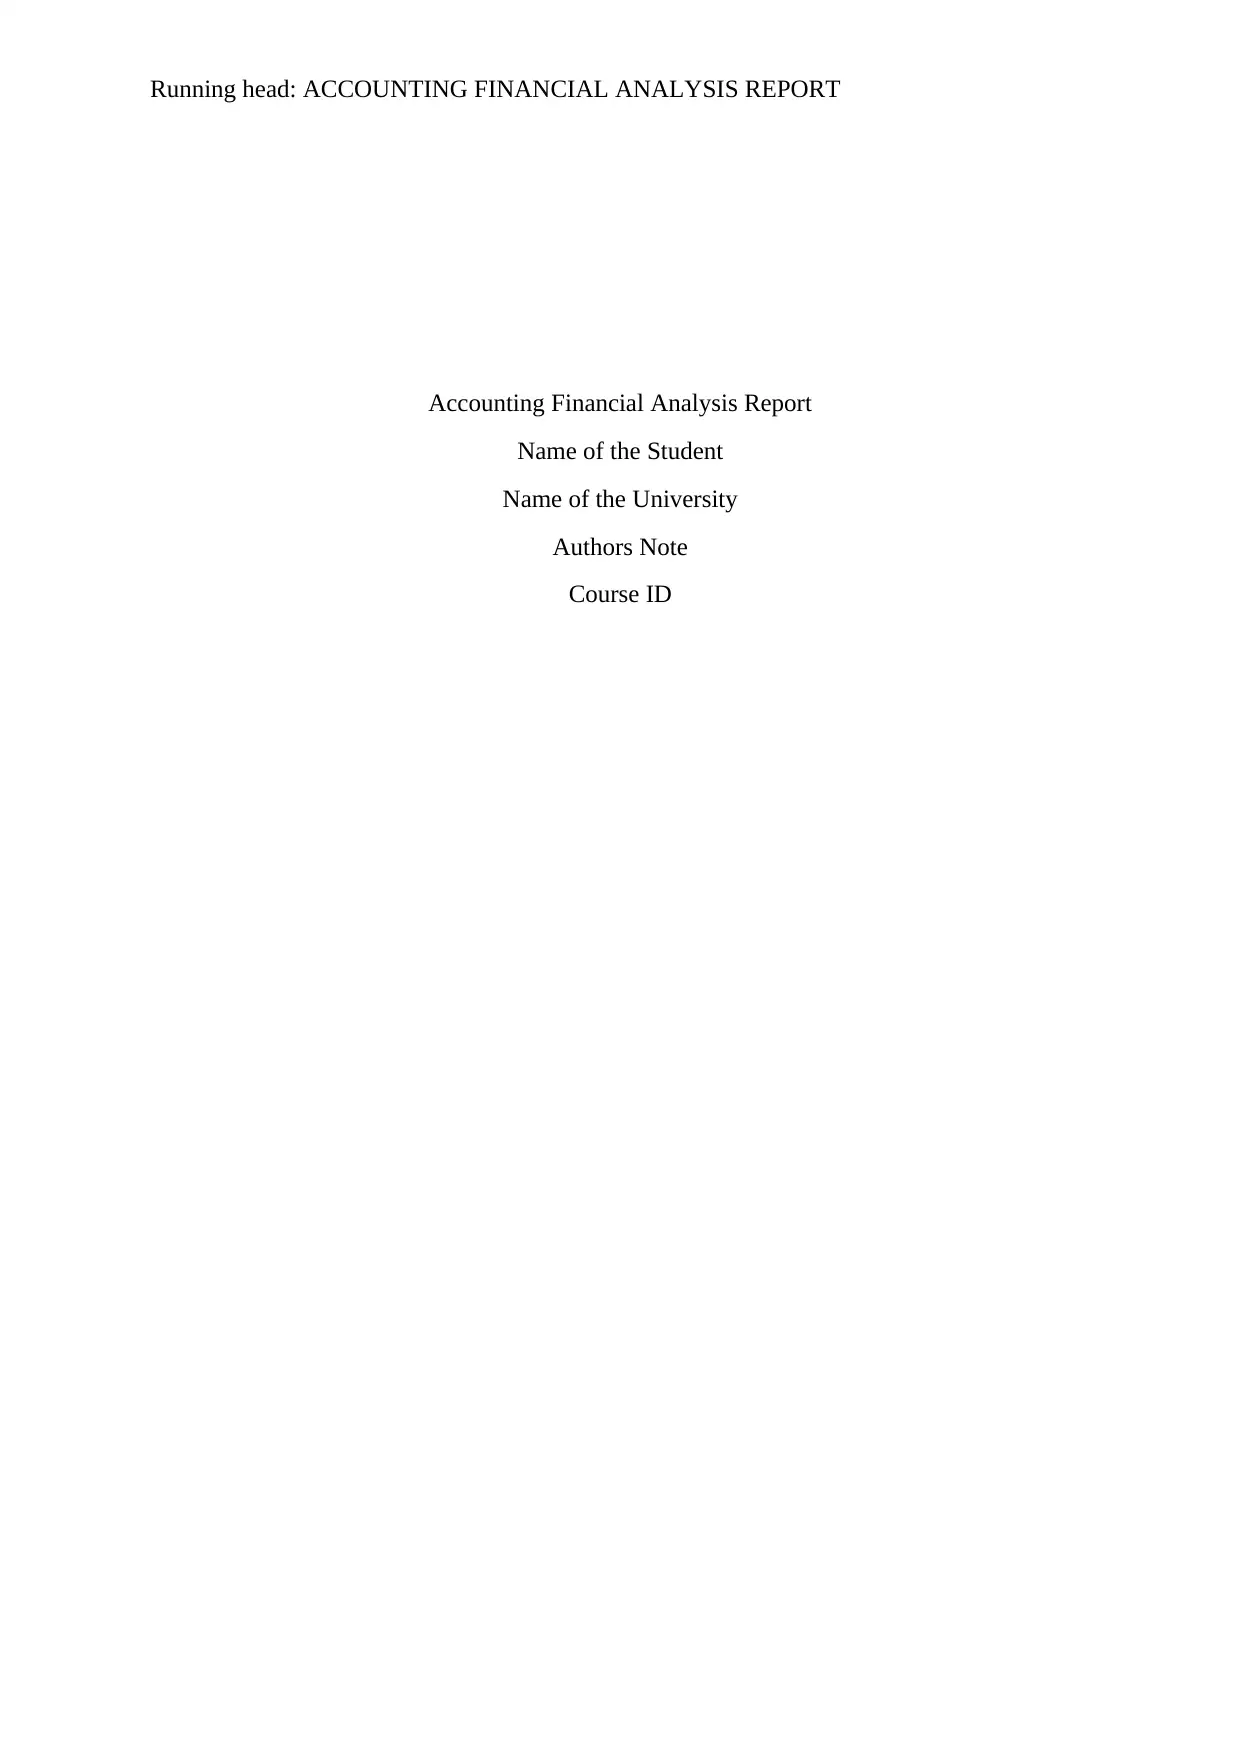
The gross profit ratio reflects the percentage of percentage of profit derived after
paying off the cost of goods sold. The gross profit ratio reported by Tesco stood 5.27% while
in 2017 the ratio stood 5.19%. The net profit margin consequently stood 0.24% and -0.10
respectively in 2016 and 2017. Even though the business has made significant progress
however it continues to face challenging operating environment. Financial factors such as
business rates in UK have been a burden with the company paying biggest amount of tax. On
(Morrisons-corporate.com 2018). During the year 1967 the company became the listed public
on the London Stock Exchange. WM Supermarkets. Morrison Supermarkets Plc is regarded
as the fourth largest chain of supermarkets in UK. Concerning the market share of Morrison
Plc in the middle part of 2015 the company was still regarded as the big four supermarkets
having a market share of 11% which though marginally declined by 0.3 in 2014.
Not like other supermarkets, Morrison manufacture a substantial amount of their own
food products at 16 sites in the UK. Morrison keeps a thousand of lines products that are sold
as their own brand goods ranging from food and drink. Concerning the present operations of
Morrison, it has around 498 superstores in UK. The superstore is largely located in English
Midlands and North of England. Morrison Supermarkets year on year growth rate has been
negative over the last five years. However, the current trading background suggest that the
average earnings has gone above average with one year earnings growth exceeding yearly
average of 58.2% against the -25.3%.
Financial Analysis:
Profitability Ratio:
The profitability ratio measures the profit deriving capacity of any business. This ratio
assesses the overall performance of the business indicating the extent to which the business
makes profit (Scott 2015).
The gross profit ratio reflects the percentage of percentage of profit derived after
paying off the cost of goods sold. The gross profit ratio reported by Tesco stood 5.27% while
in 2017 the ratio stood 5.19%. The net profit margin consequently stood 0.24% and -0.10
respectively in 2016 and 2017. Even though the business has made significant progress
however it continues to face challenging operating environment. Financial factors such as
business rates in UK have been a burden with the company paying biggest amount of tax. On
Secure Best Marks with AI Grader
Need help grading? Try our AI Grader for instant feedback on your assignments.
4ACCOUNTING FINANCIAL ANALYSIS REPORT
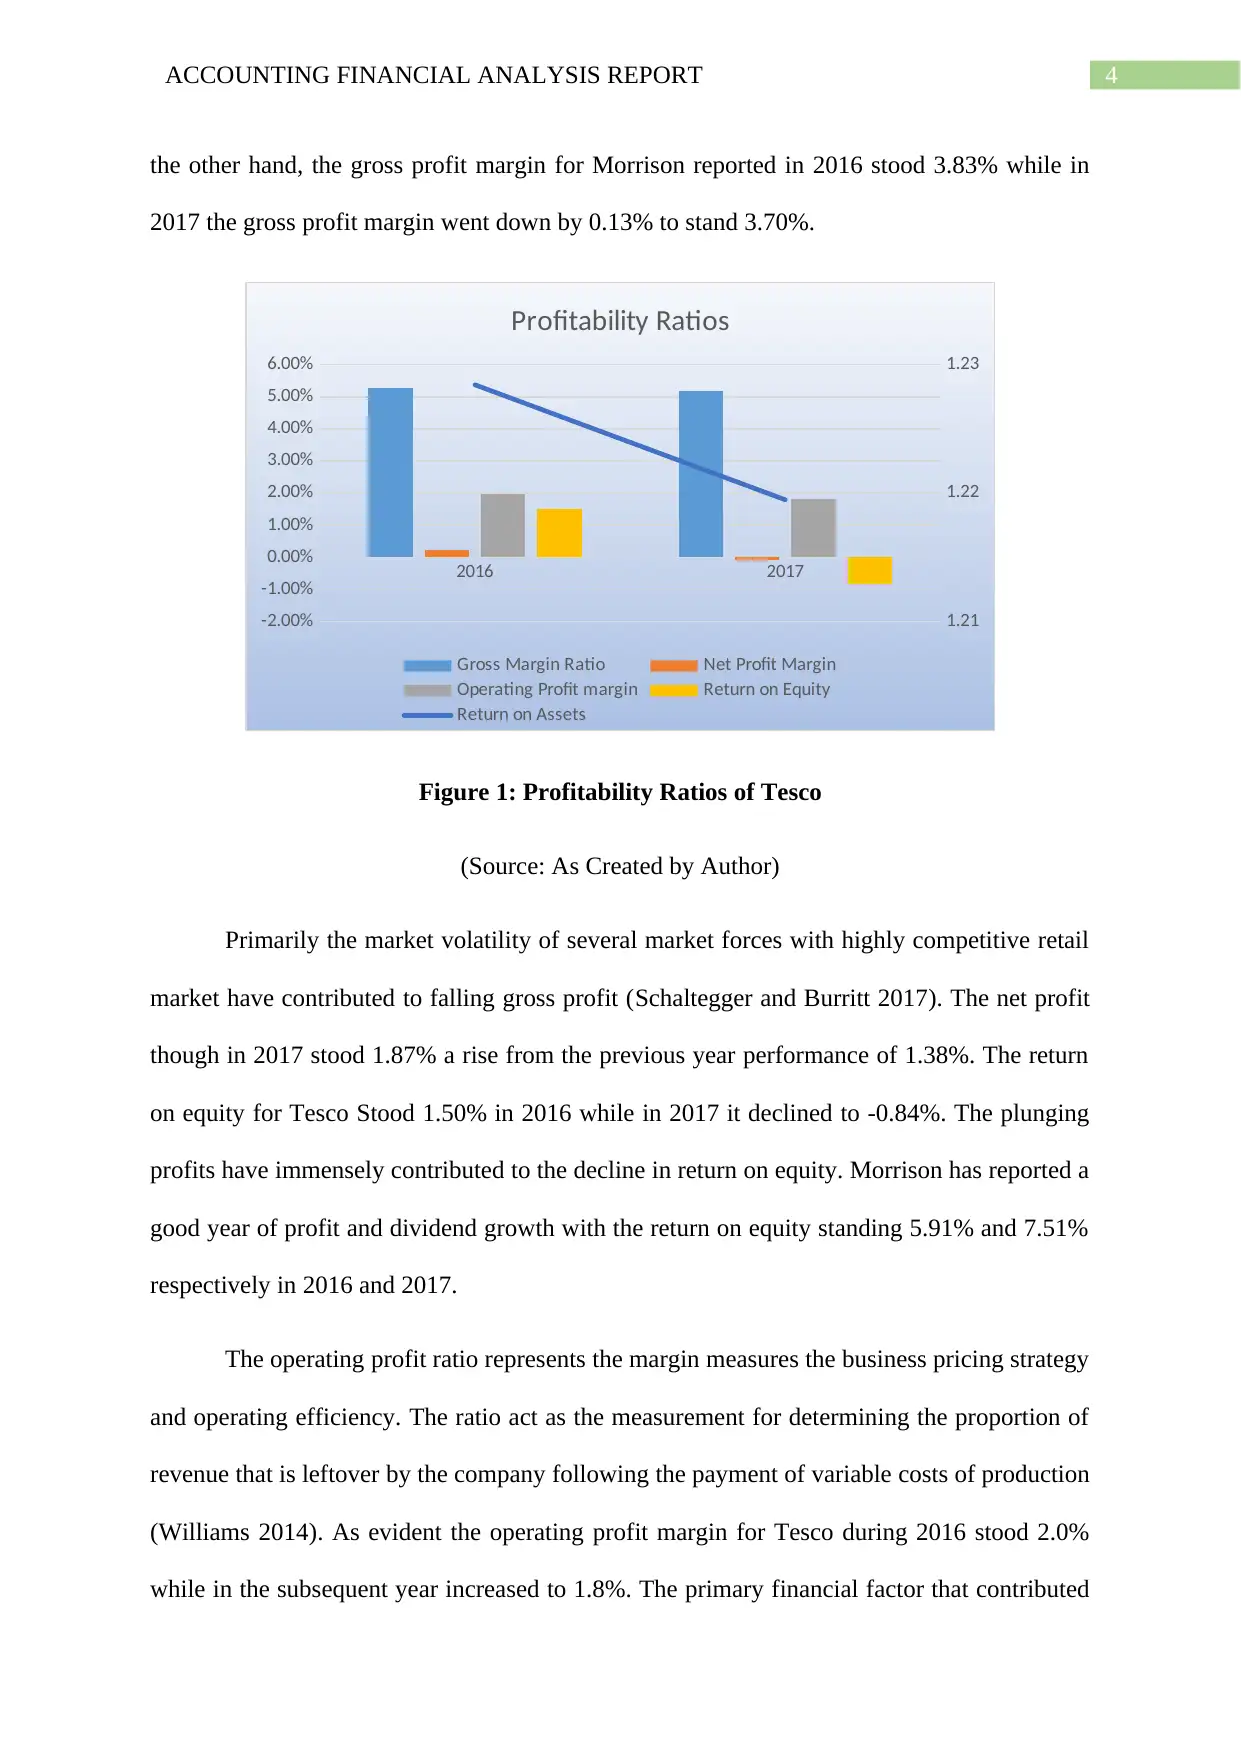
the other hand, the gross profit margin for Morrison reported in 2016 stood 3.83% while in
2017 the gross profit margin went down by 0.13% to stand 3.70%.
2016 2017
-2.00%
-1.00%
0.00%
1.00%
2.00%
3.00%
4.00%
5.00%
6.00%
1.21
1.22
1.23
Profitability Ratios
Gross Margin Ratio Net Profit Margin
Operating Profit margin Return on Equity
Return on Assets
Figure 1: Profitability Ratios of Tesco
(Source: As Created by Author)
Primarily the market volatility of several market forces with highly competitive retail
market have contributed to falling gross profit (Schaltegger and Burritt 2017). The net profit
though in 2017 stood 1.87% a rise from the previous year performance of 1.38%. The return
on equity for Tesco Stood 1.50% in 2016 while in 2017 it declined to -0.84%. The plunging
profits have immensely contributed to the decline in return on equity. Morrison has reported a
good year of profit and dividend growth with the return on equity standing 5.91% and 7.51%
respectively in 2016 and 2017.
The operating profit ratio represents the margin measures the business pricing strategy
and operating efficiency. The ratio act as the measurement for determining the proportion of
revenue that is leftover by the company following the payment of variable costs of production
(Williams 2014). As evident the operating profit margin for Tesco during 2016 stood 2.0%
while in the subsequent year increased to 1.8%. The primary financial factor that contributed
5ACCOUNTING FINANCIAL ANALYSIS REPORT
to the rise in operating profit margin is because of the increase in the exceptional items by
30% for the company.
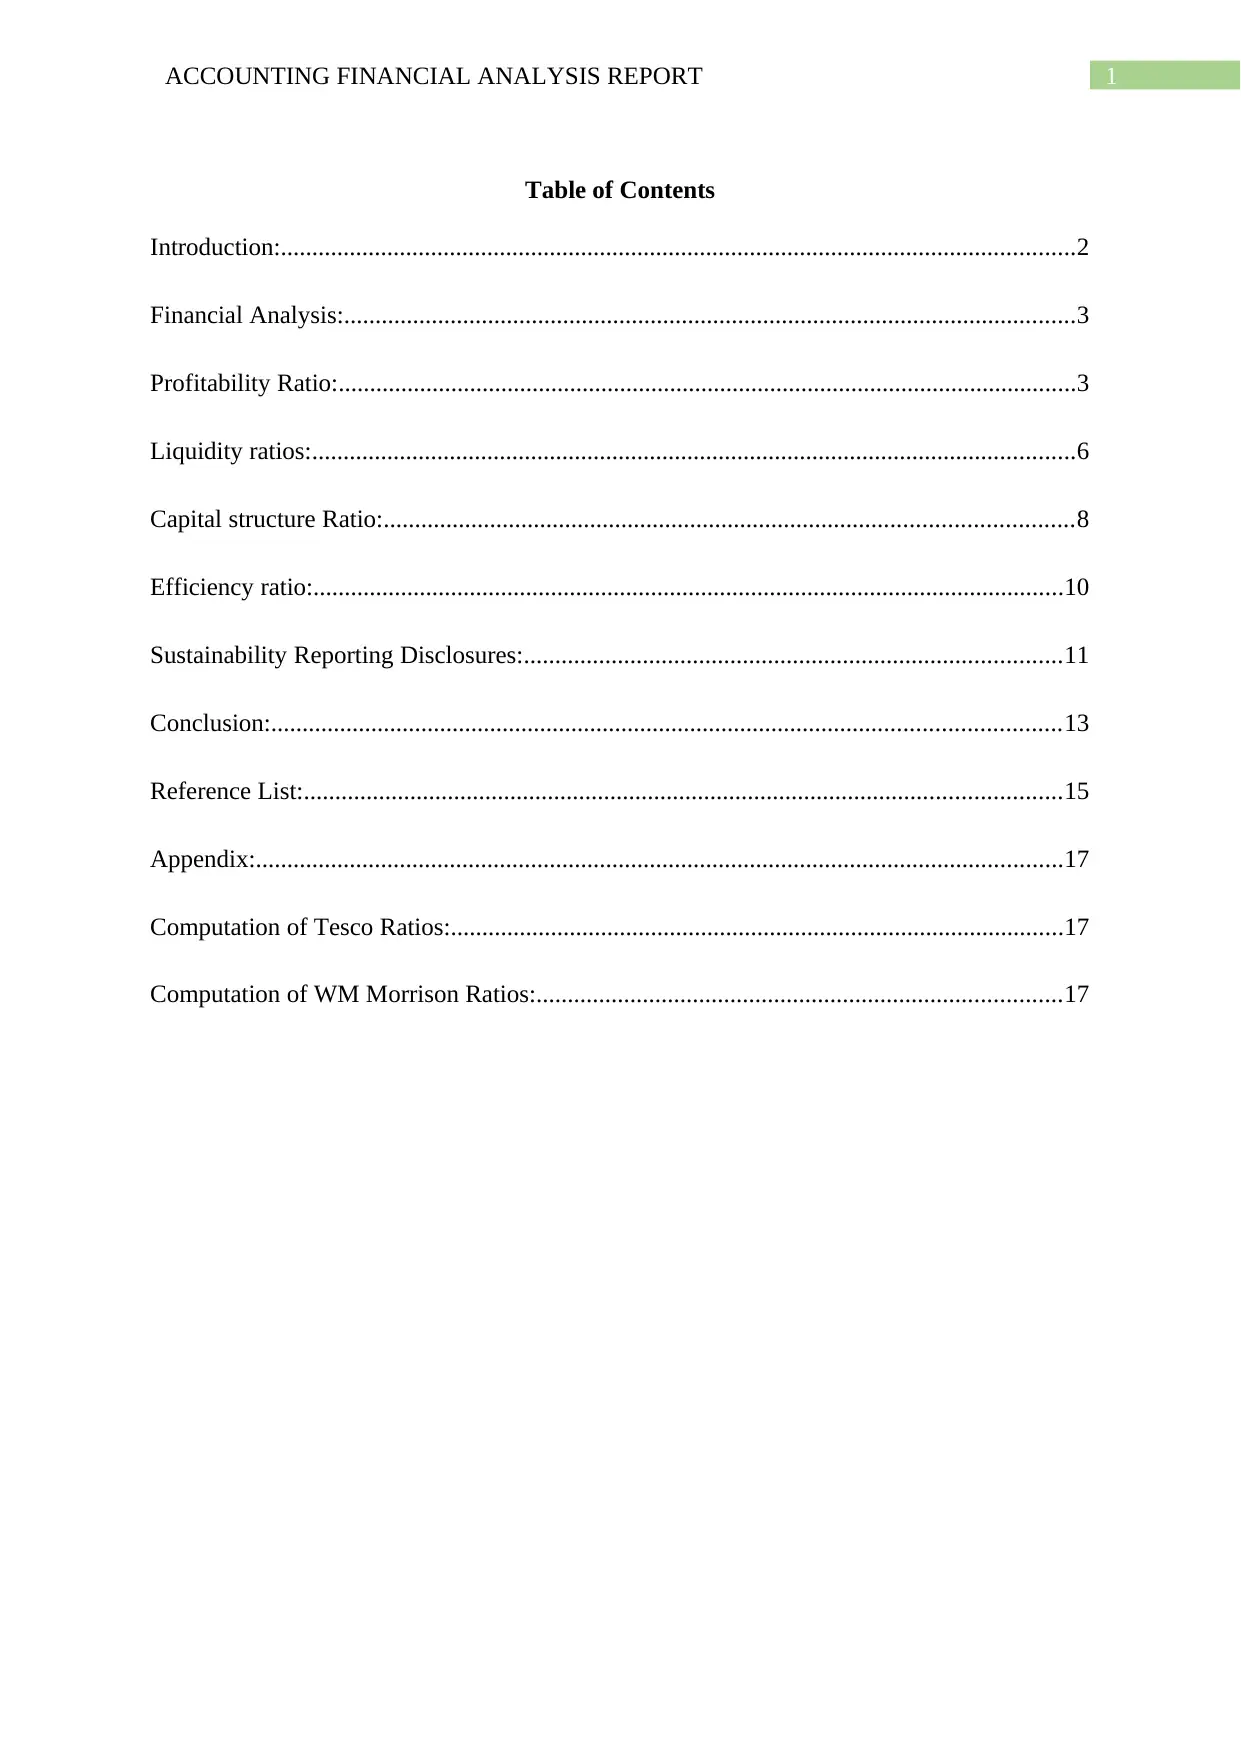
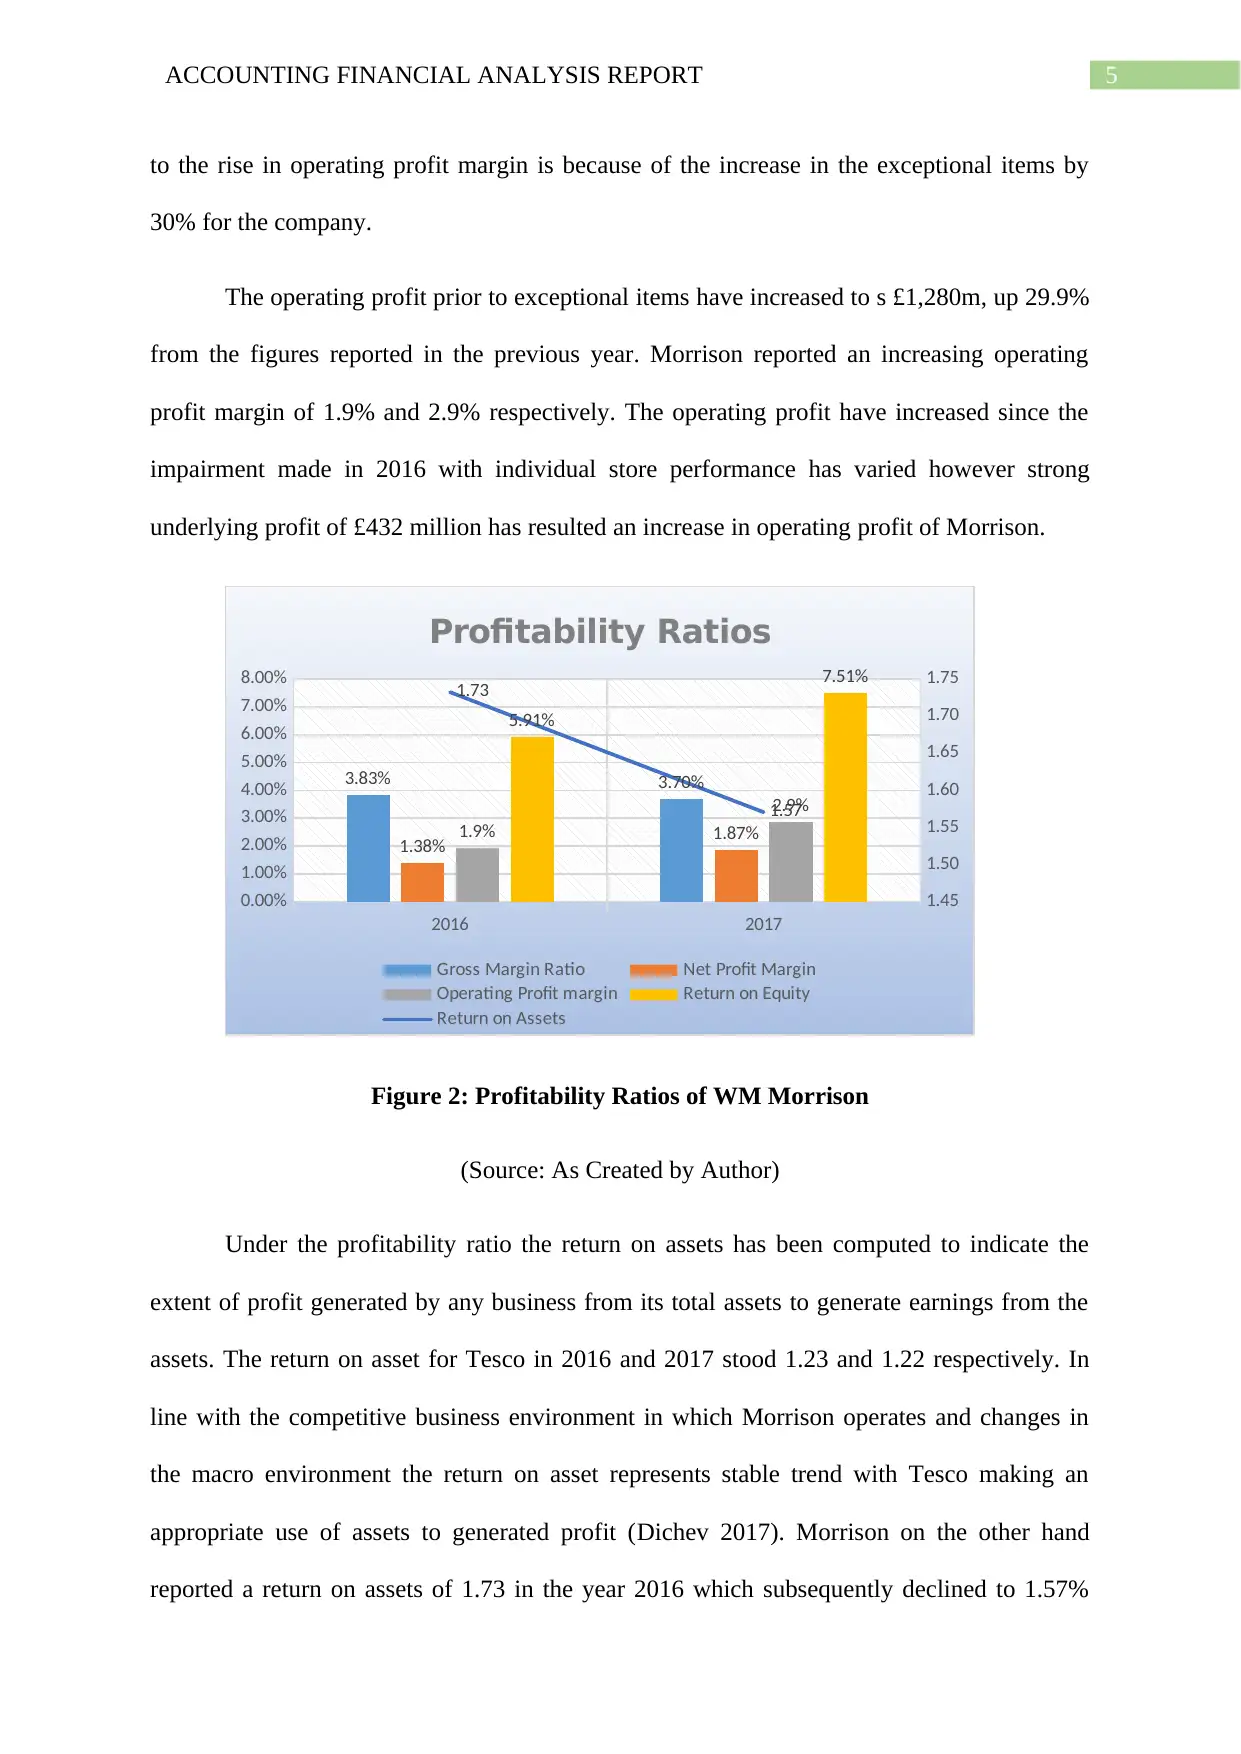
The operating profit prior to exceptional items have increased to s £1,280m, up 29.9%
from the figures reported in the previous year. Morrison reported an increasing operating
profit margin of 1.9% and 2.9% respectively. The operating profit have increased since the
impairment made in 2016 with individual store performance has varied however strong
underlying profit of £432 million has resulted an increase in operating profit of Morrison.
2016 2017
0.00%
1.00%
2.00%
3.00%
4.00%
5.00%
6.00%
7.00%
8.00%
1.45
1.50
1.55
1.60
1.65
1.70
1.75
3.83% 3.70%
1.38% 1.87%1.9%
2.9%
5.91%
7.51%
1.73
1.57
Profitability Ratios
Gross Margin Ratio Net Profit Margin
Operating Profit margin Return on Equity
Return on Assets
Figure 2: Profitability Ratios of WM Morrison
(Source: As Created by Author)
Under the profitability ratio the return on assets has been computed to indicate the
extent of profit generated by any business from its total assets to generate earnings from the
assets. The return on asset for Tesco in 2016 and 2017 stood 1.23 and 1.22 respectively. In
line with the competitive business environment in which Morrison operates and changes in
the macro environment the return on asset represents stable trend with Tesco making an
appropriate use of assets to generated profit (Dichev 2017). Morrison on the other hand
reported a return on assets of 1.73 in the year 2016 which subsequently declined to 1.57%
to the rise in operating profit margin is because of the increase in the exceptional items by
30% for the company.
The operating profit prior to exceptional items have increased to s £1,280m, up 29.9%
from the figures reported in the previous year. Morrison reported an increasing operating
profit margin of 1.9% and 2.9% respectively. The operating profit have increased since the
impairment made in 2016 with individual store performance has varied however strong
underlying profit of £432 million has resulted an increase in operating profit of Morrison.
2016 2017
0.00%
1.00%
2.00%
3.00%
4.00%
5.00%
6.00%
7.00%
8.00%
1.45
1.50
1.55
1.60
1.65
1.70
1.75
3.83% 3.70%
1.38% 1.87%1.9%
2.9%
5.91%
7.51%
1.73
1.57
Profitability Ratios
Gross Margin Ratio Net Profit Margin
Operating Profit margin Return on Equity
Return on Assets
Figure 2: Profitability Ratios of WM Morrison
(Source: As Created by Author)
Under the profitability ratio the return on assets has been computed to indicate the
extent of profit generated by any business from its total assets to generate earnings from the
assets. The return on asset for Tesco in 2016 and 2017 stood 1.23 and 1.22 respectively. In
line with the competitive business environment in which Morrison operates and changes in
the macro environment the return on asset represents stable trend with Tesco making an
appropriate use of assets to generated profit (Dichev 2017). Morrison on the other hand
reported a return on assets of 1.73 in the year 2016 which subsequently declined to 1.57%
6ACCOUNTING FINANCIAL ANALYSIS REPORT
reflecting that the company is not appropriately generating accessible and increasing amount
of returns from its assets.
Liquidity ratios:
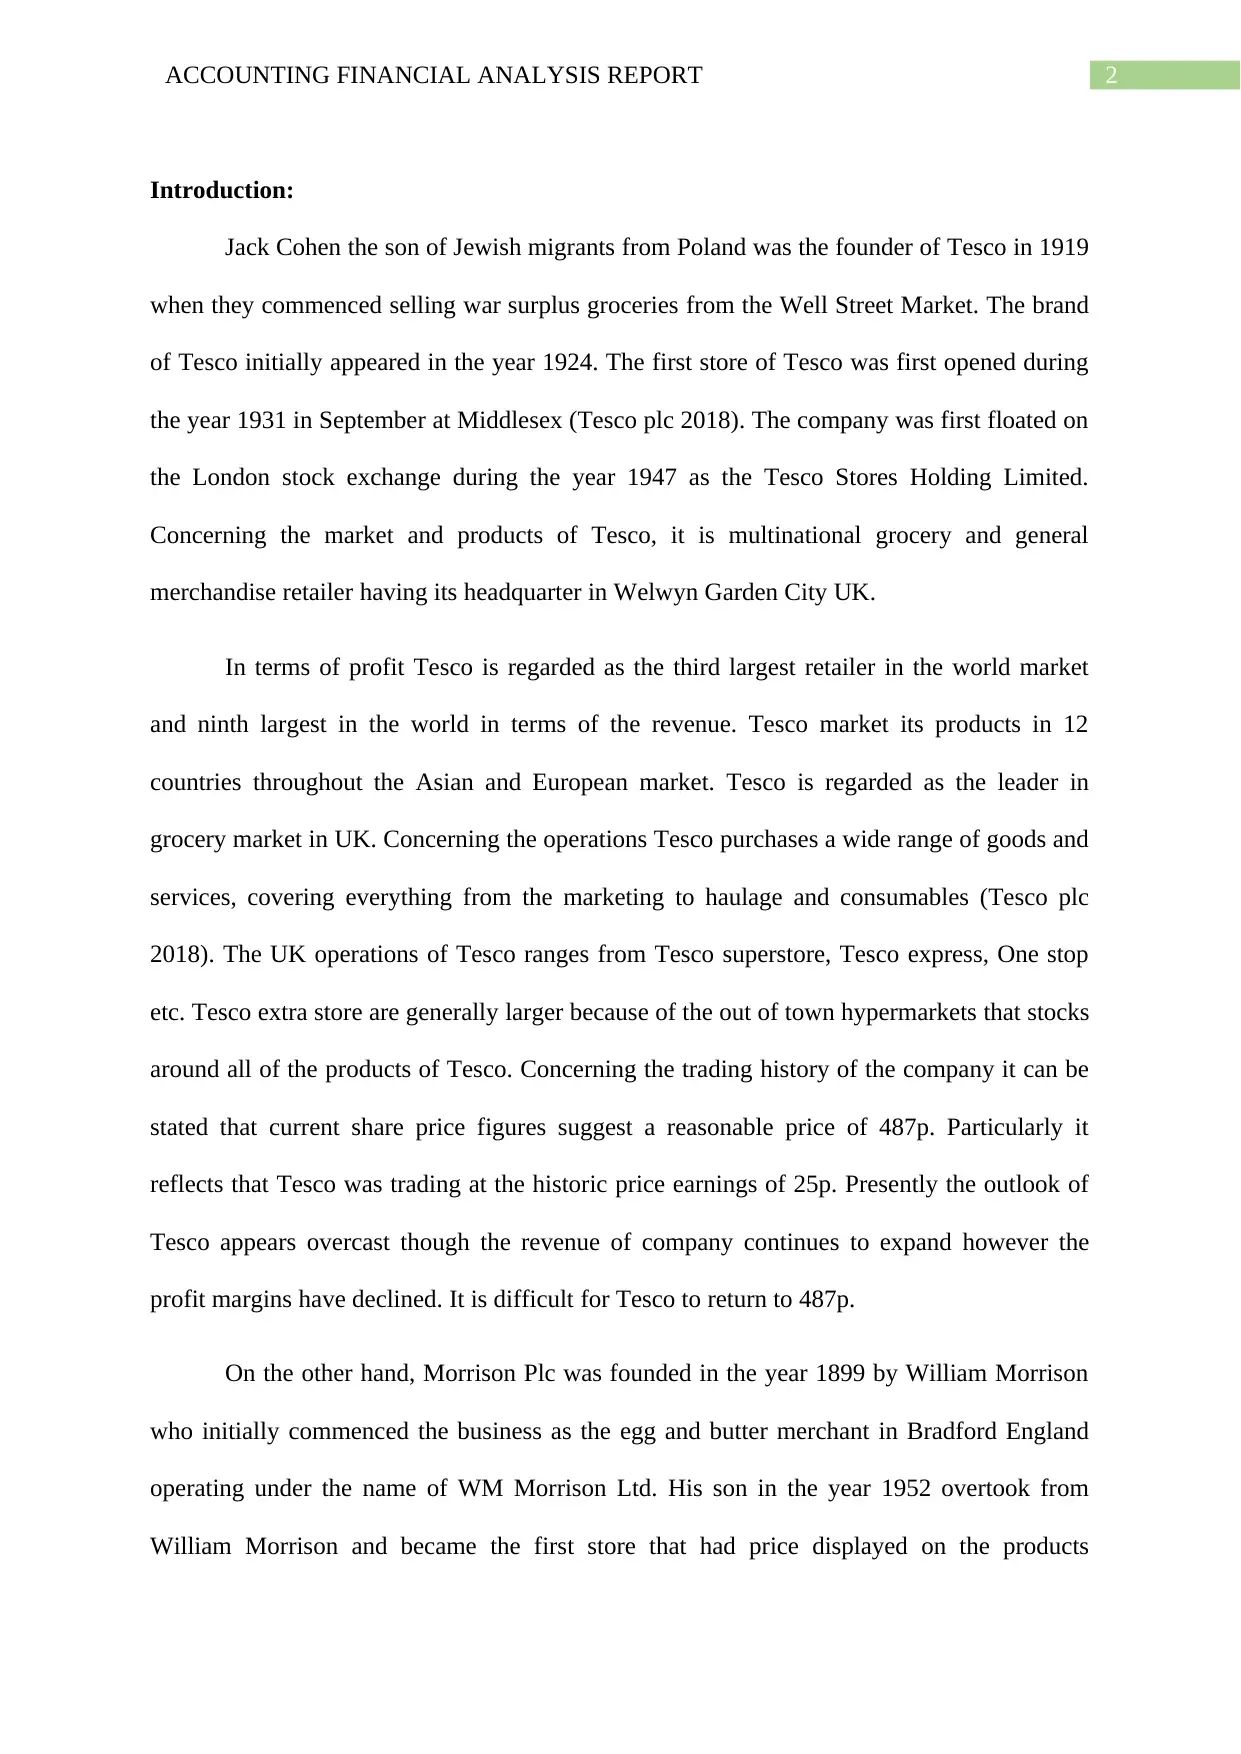
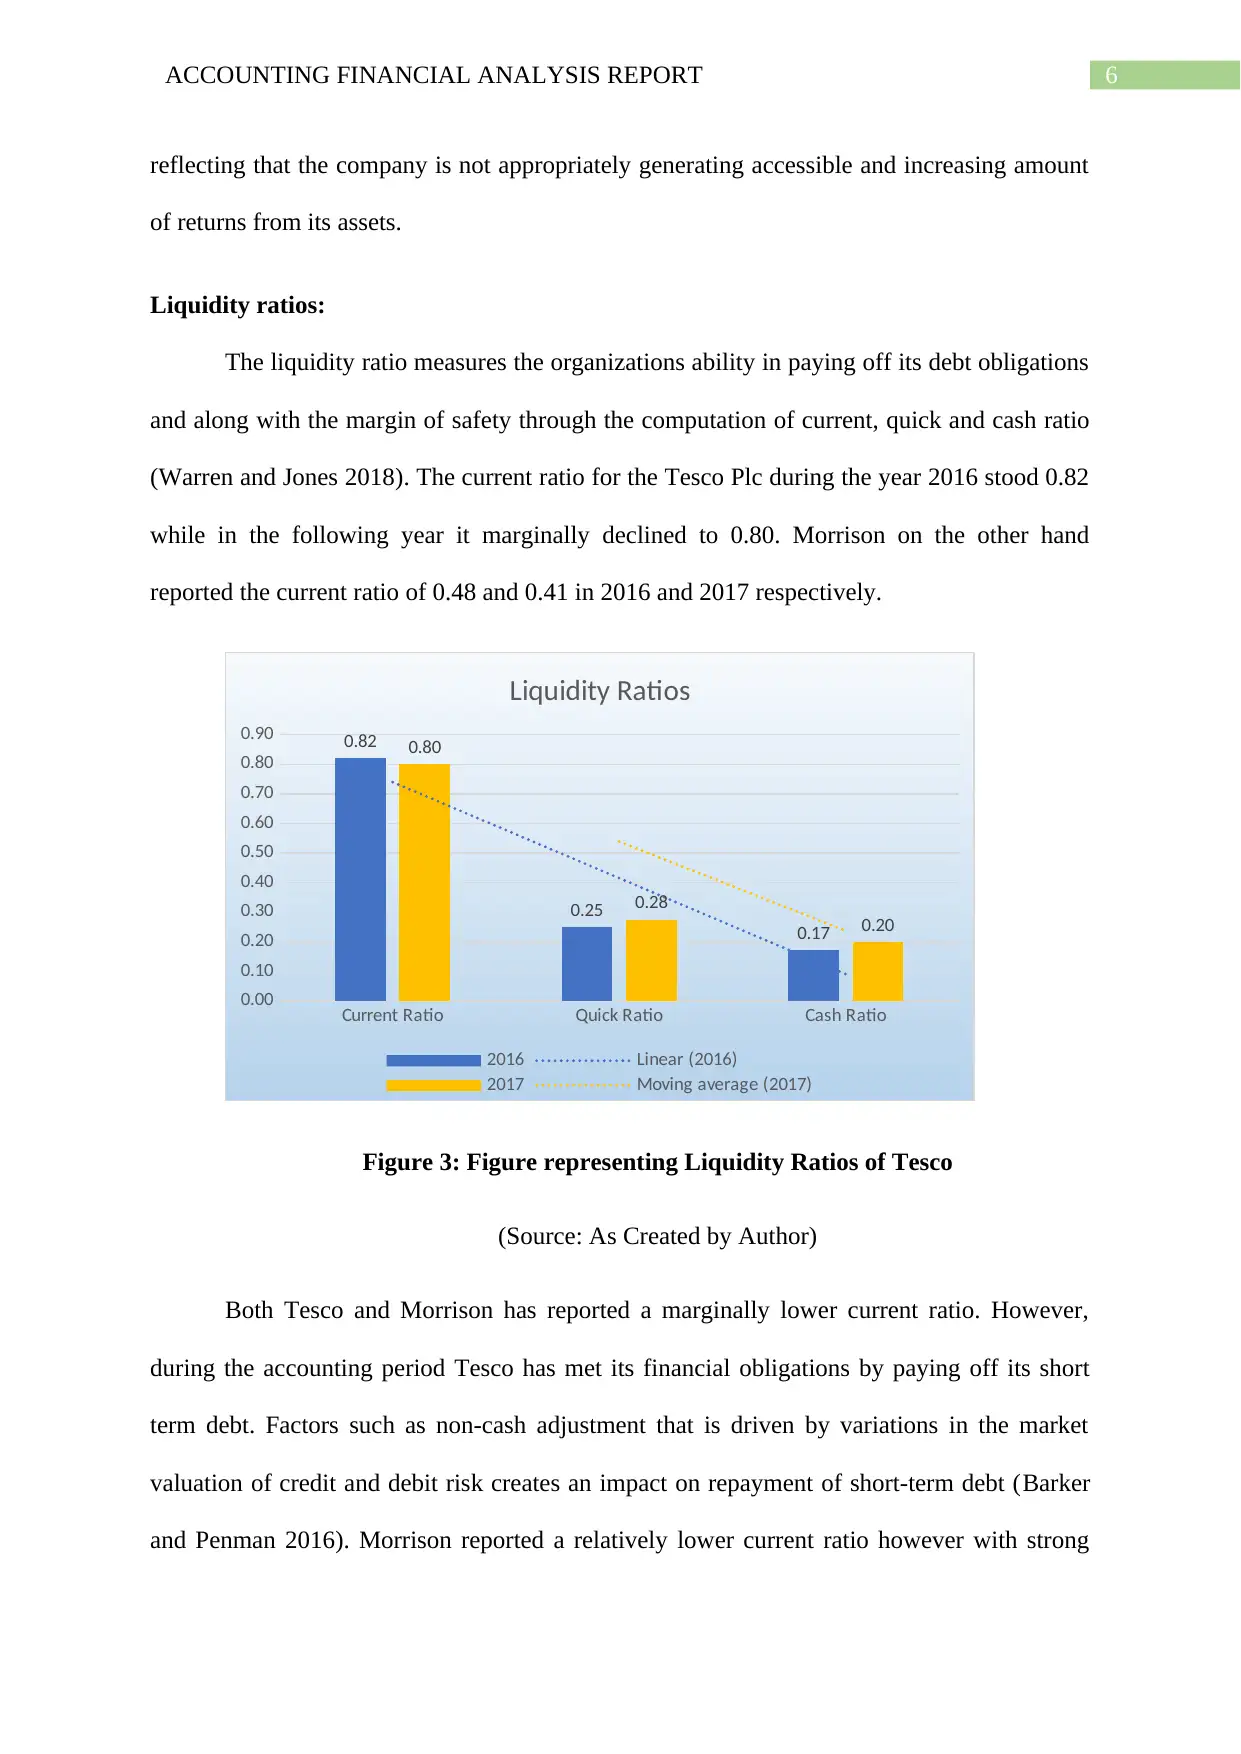
The liquidity ratio measures the organizations ability in paying off its debt obligations
and along with the margin of safety through the computation of current, quick and cash ratio
(Warren and Jones 2018). The current ratio for the Tesco Plc during the year 2016 stood 0.82
while in the following year it marginally declined to 0.80. Morrison on the other hand
reported the current ratio of 0.48 and 0.41 in 2016 and 2017 respectively.
Current Ratio Quick Ratio Cash Ratio
0.00
0.10
0.20
0.30
0.40
0.50
0.60
0.70
0.80
0.90 0.82
0.25
0.17
0.80
0.28
0.20
Liquidity Ratios
2016 Linear (2016)
2017 Moving average (2017)
Figure 3: Figure representing Liquidity Ratios of Tesco
(Source: As Created by Author)
Both Tesco and Morrison has reported a marginally lower current ratio. However,
during the accounting period Tesco has met its financial obligations by paying off its short
term debt. Factors such as non-cash adjustment that is driven by variations in the market
valuation of credit and debit risk creates an impact on repayment of short-term debt (Barker
and Penman 2016). Morrison reported a relatively lower current ratio however with strong
reflecting that the company is not appropriately generating accessible and increasing amount
of returns from its assets.
Liquidity ratios:
The liquidity ratio measures the organizations ability in paying off its debt obligations
and along with the margin of safety through the computation of current, quick and cash ratio
(Warren and Jones 2018). The current ratio for the Tesco Plc during the year 2016 stood 0.82
while in the following year it marginally declined to 0.80. Morrison on the other hand
reported the current ratio of 0.48 and 0.41 in 2016 and 2017 respectively.
Current Ratio Quick Ratio Cash Ratio
0.00
0.10
0.20
0.30
0.40
0.50
0.60
0.70
0.80
0.90 0.82
0.25
0.17
0.80
0.28
0.20
Liquidity Ratios
2016 Linear (2016)
2017 Moving average (2017)
Figure 3: Figure representing Liquidity Ratios of Tesco
(Source: As Created by Author)
Both Tesco and Morrison has reported a marginally lower current ratio. However,
during the accounting period Tesco has met its financial obligations by paying off its short
term debt. Factors such as non-cash adjustment that is driven by variations in the market
valuation of credit and debit risk creates an impact on repayment of short-term debt (Barker
and Penman 2016). Morrison reported a relatively lower current ratio however with strong
Paraphrase This Document
Need a fresh take? Get an instant paraphrase of this document with our AI Paraphraser
7ACCOUNTING FINANCIAL ANALYSIS REPORT
net profit reported the company has been struggling to meet its short term liabilities that have
fallen due in the present accounting year.
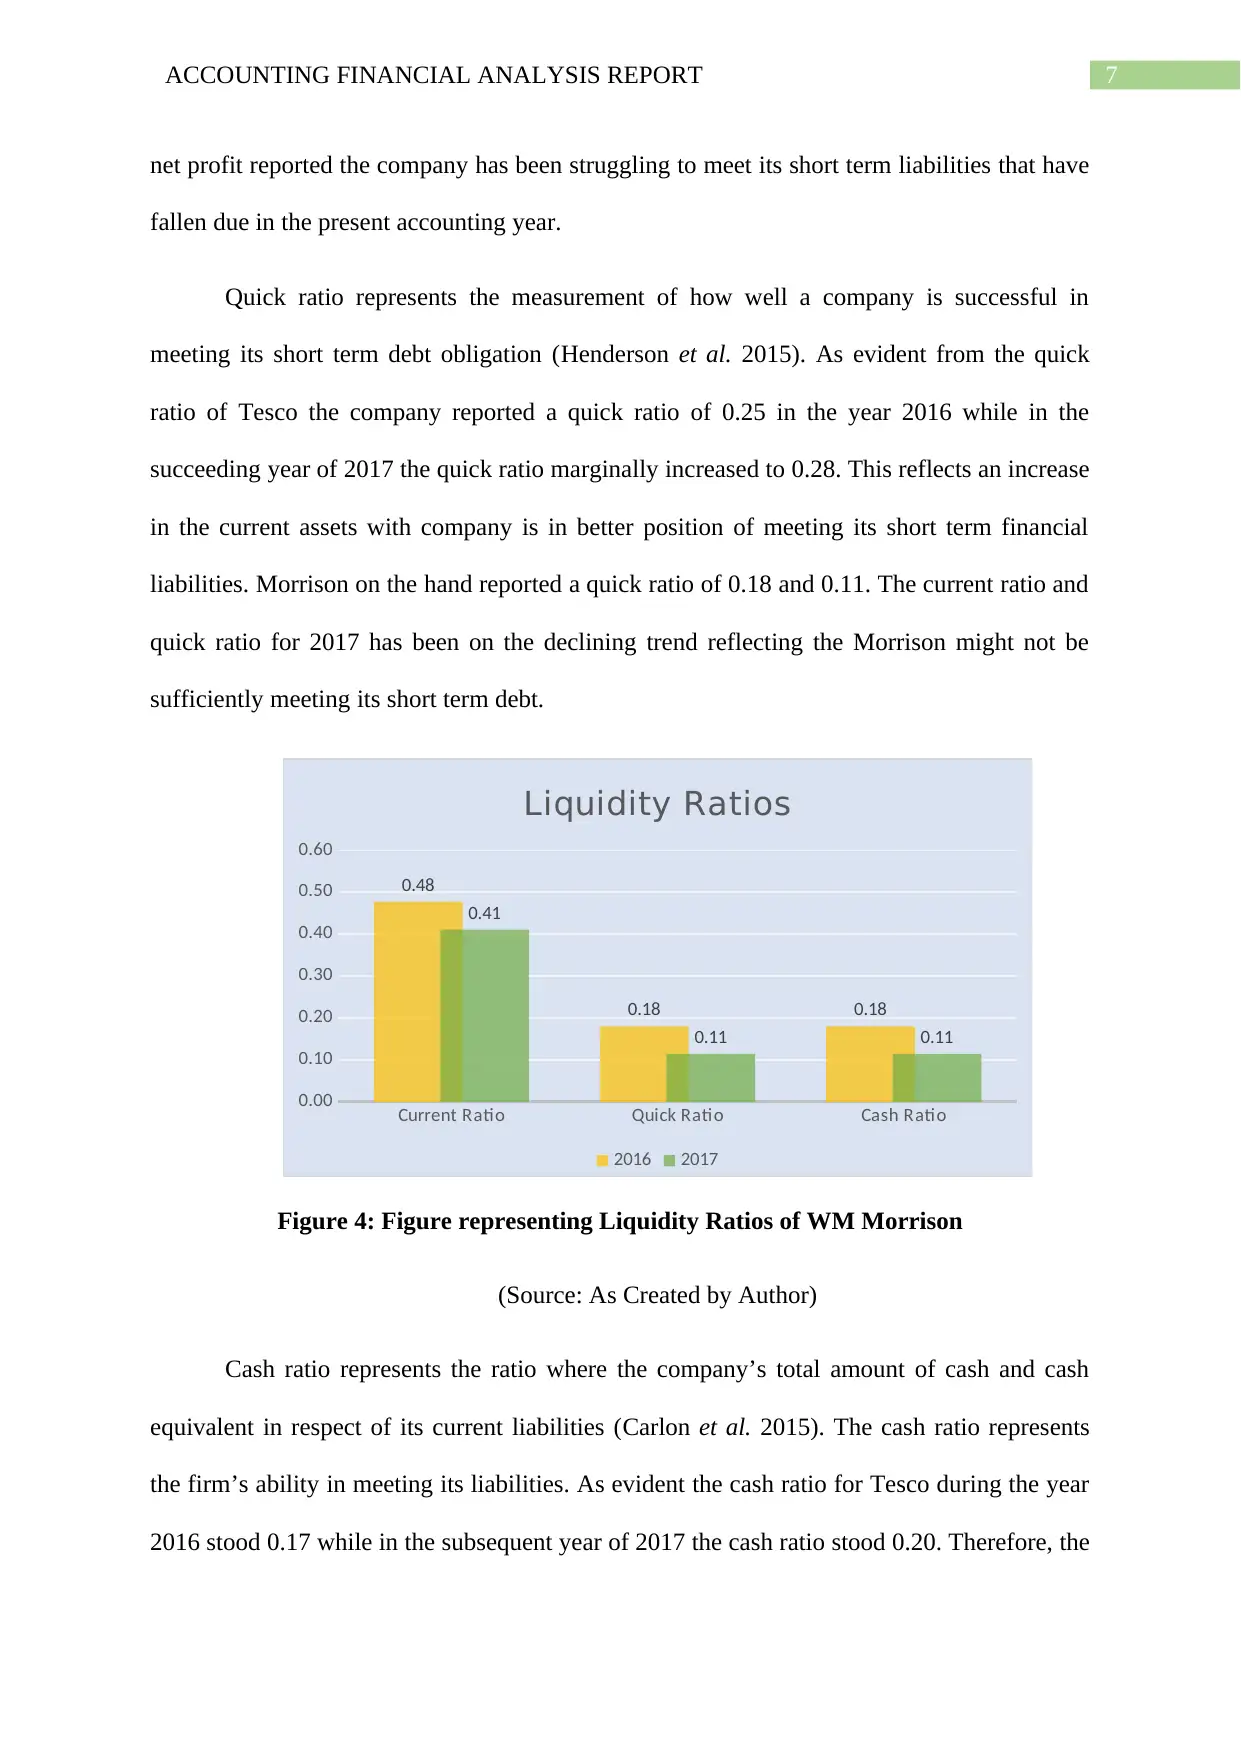
Quick ratio represents the measurement of how well a company is successful in
meeting its short term debt obligation (Henderson et al. 2015). As evident from the quick
ratio of Tesco the company reported a quick ratio of 0.25 in the year 2016 while in the
succeeding year of 2017 the quick ratio marginally increased to 0.28. This reflects an increase
in the current assets with company is in better position of meeting its short term financial
liabilities. Morrison on the hand reported a quick ratio of 0.18 and 0.11. The current ratio and
quick ratio for 2017 has been on the declining trend reflecting the Morrison might not be
sufficiently meeting its short term debt.
Current Ratio Quick Ratio Cash Ratio
0.00
0.10
0.20
0.30
0.40
0.50
0.60
0.48
0.18 0.18
0.41
0.11 0.11
Liquidity Ratios
2016 2017
Figure 4: Figure representing Liquidity Ratios of WM Morrison
(Source: As Created by Author)
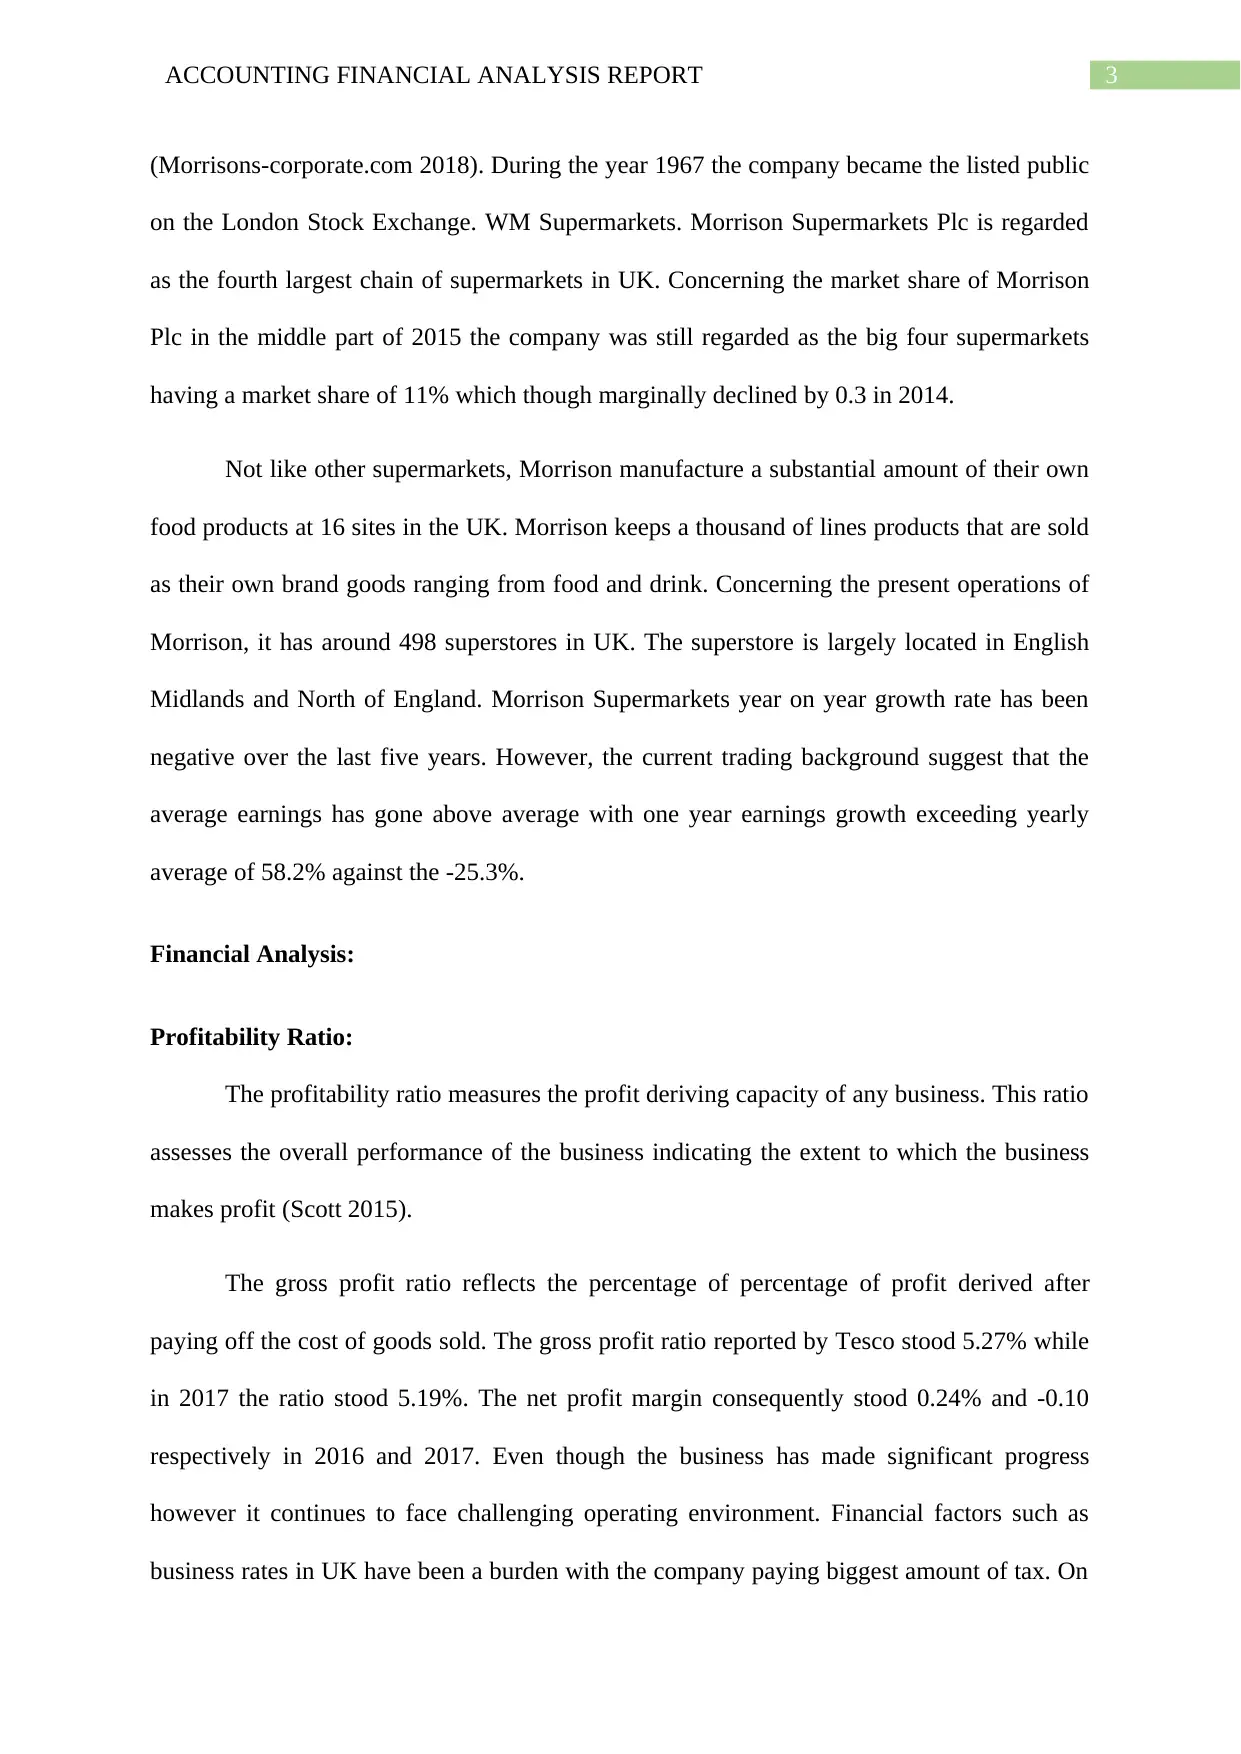
Cash ratio represents the ratio where the company’s total amount of cash and cash
equivalent in respect of its current liabilities (Carlon et al. 2015). The cash ratio represents
the firm’s ability in meeting its liabilities. As evident the cash ratio for Tesco during the year
2016 stood 0.17 while in the subsequent year of 2017 the cash ratio stood 0.20. Therefore, the
net profit reported the company has been struggling to meet its short term liabilities that have
fallen due in the present accounting year.
Quick ratio represents the measurement of how well a company is successful in
meeting its short term debt obligation (Henderson et al. 2015). As evident from the quick
ratio of Tesco the company reported a quick ratio of 0.25 in the year 2016 while in the
succeeding year of 2017 the quick ratio marginally increased to 0.28. This reflects an increase
in the current assets with company is in better position of meeting its short term financial
liabilities. Morrison on the hand reported a quick ratio of 0.18 and 0.11. The current ratio and
quick ratio for 2017 has been on the declining trend reflecting the Morrison might not be
sufficiently meeting its short term debt.
Current Ratio Quick Ratio Cash Ratio
0.00
0.10
0.20
0.30
0.40
0.50
0.60
0.48
0.18 0.18
0.41
0.11 0.11
Liquidity Ratios
2016 2017
Figure 4: Figure representing Liquidity Ratios of WM Morrison
(Source: As Created by Author)
Cash ratio represents the ratio where the company’s total amount of cash and cash
equivalent in respect of its current liabilities (Carlon et al. 2015). The cash ratio represents
the firm’s ability in meeting its liabilities. As evident the cash ratio for Tesco during the year
2016 stood 0.17 while in the subsequent year of 2017 the cash ratio stood 0.20. Therefore, the
8ACCOUNTING FINANCIAL ANALYSIS REPORT
rise in cash ratio is primarily because of the increase in the cash and cash equivalent with
total amount of cash standing 3821 for the year 2017. While Morrison reported a cash ratio of
0.18 and 0.11 reflecting a fall in the ratio. This is primarily because of the repayment of bank
overdraft and offset of current liabilities in the financial year of 2017.
Capital structure Ratio:
The capital structure ratio determines the how the business capitals its whole business
operations and growth by making use of the different sources of funds.
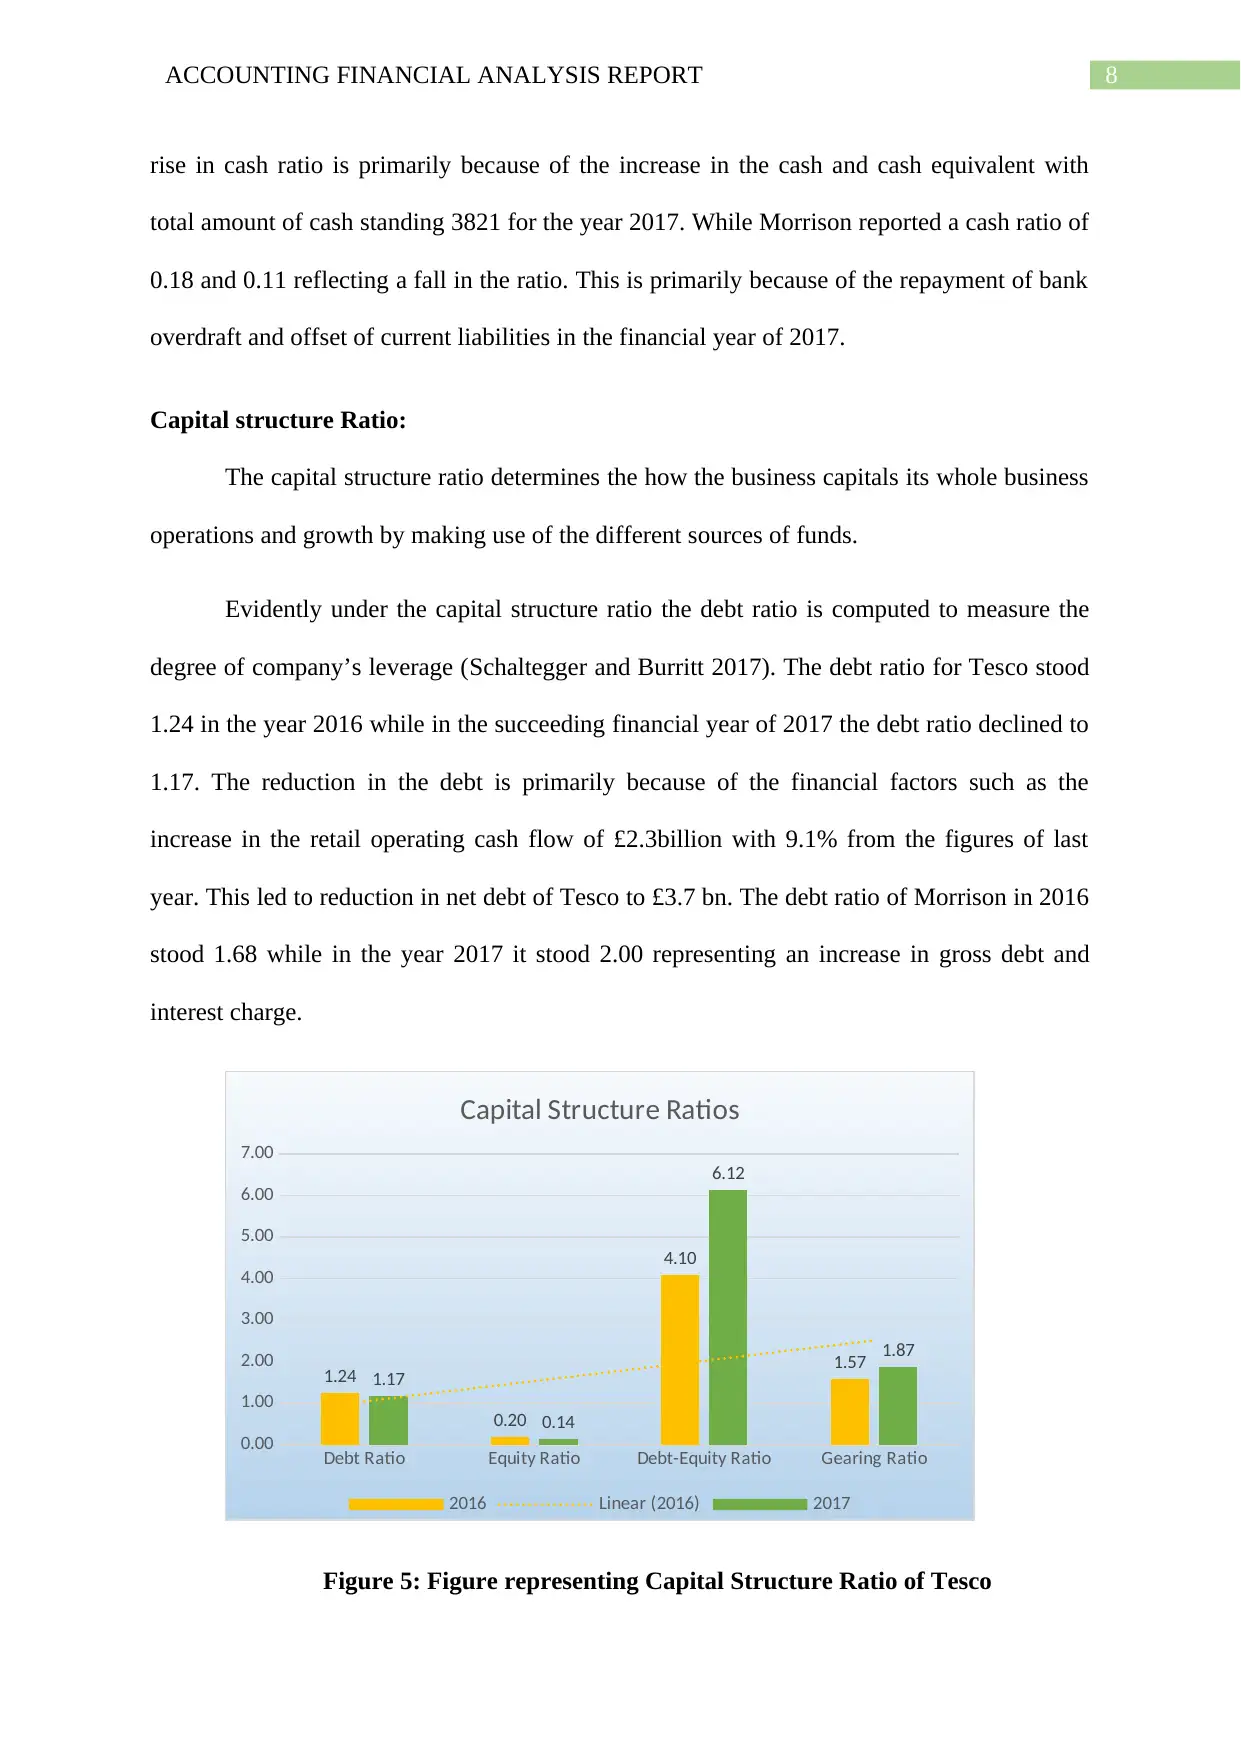
Evidently under the capital structure ratio the debt ratio is computed to measure the
degree of company’s leverage (Schaltegger and Burritt 2017). The debt ratio for Tesco stood
1.24 in the year 2016 while in the succeeding financial year of 2017 the debt ratio declined to
1.17. The reduction in the debt is primarily because of the financial factors such as the
increase in the retail operating cash flow of £2.3billion with 9.1% from the figures of last
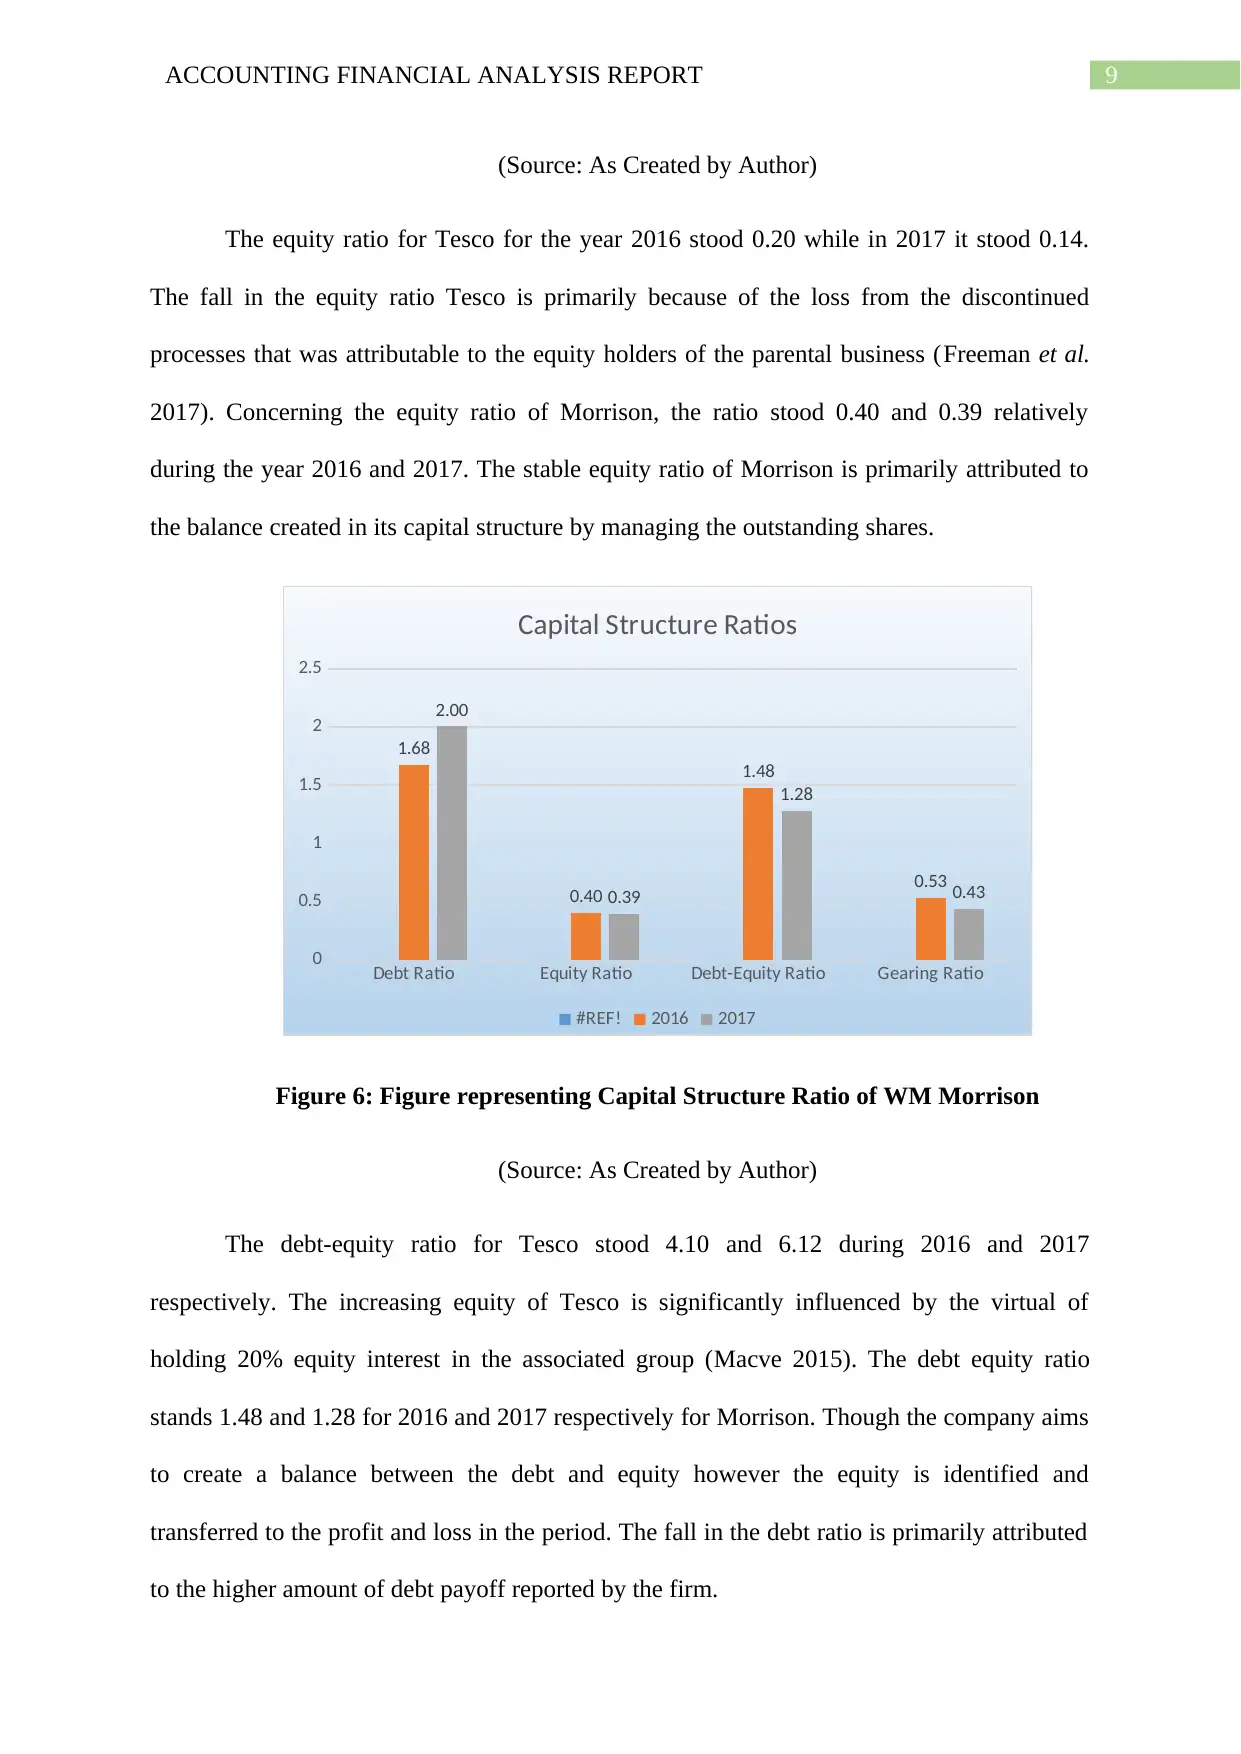
year. This led to reduction in net debt of Tesco to £3.7 bn. The debt ratio of Morrison in 2016
stood 1.68 while in the year 2017 it stood 2.00 representing an increase in gross debt and
interest charge.
Debt Ratio Equity Ratio Debt-Equity Ratio Gearing Ratio
0.00
1.00
2.00
3.00
4.00
5.00
6.00
7.00
1.24
0.20
4.10
1.57
1.17
0.14
6.12
1.87
Capital Structure Ratios
2016 Linear (2016) 2017
Figure 5: Figure representing Capital Structure Ratio of Tesco
rise in cash ratio is primarily because of the increase in the cash and cash equivalent with
total amount of cash standing 3821 for the year 2017. While Morrison reported a cash ratio of
0.18 and 0.11 reflecting a fall in the ratio. This is primarily because of the repayment of bank
overdraft and offset of current liabilities in the financial year of 2017.
Capital structure Ratio:
The capital structure ratio determines the how the business capitals its whole business
operations and growth by making use of the different sources of funds.
Evidently under the capital structure ratio the debt ratio is computed to measure the
degree of company’s leverage (Schaltegger and Burritt 2017). The debt ratio for Tesco stood
1.24 in the year 2016 while in the succeeding financial year of 2017 the debt ratio declined to
1.17. The reduction in the debt is primarily because of the financial factors such as the
increase in the retail operating cash flow of £2.3billion with 9.1% from the figures of last
year. This led to reduction in net debt of Tesco to £3.7 bn. The debt ratio of Morrison in 2016
stood 1.68 while in the year 2017 it stood 2.00 representing an increase in gross debt and
interest charge.
Debt Ratio Equity Ratio Debt-Equity Ratio Gearing Ratio
0.00
1.00
2.00
3.00
4.00
5.00
6.00
7.00
1.24
0.20
4.10
1.57
1.17
0.14
6.12
1.87
Capital Structure Ratios
2016 Linear (2016) 2017
Figure 5: Figure representing Capital Structure Ratio of Tesco
9ACCOUNTING FINANCIAL ANALYSIS REPORT
(Source: As Created by Author)
The equity ratio for Tesco for the year 2016 stood 0.20 while in 2017 it stood 0.14.
The fall in the equity ratio Tesco is primarily because of the loss from the discontinued
processes that was attributable to the equity holders of the parental business (Freeman et al.
2017). Concerning the equity ratio of Morrison, the ratio stood 0.40 and 0.39 relatively
during the year 2016 and 2017. The stable equity ratio of Morrison is primarily attributed to
the balance created in its capital structure by managing the outstanding shares.
Debt Ratio Equity Ratio Debt-Equity Ratio Gearing Ratio
0
0.5
1
1.5
2
2.5
1.68
0.40
1.48
0.53
2.00
0.39
1.28
0.43
Capital Structure Ratios
#REF! 2016 2017
Figure 6: Figure representing Capital Structure Ratio of WM Morrison
(Source: As Created by Author)
The debt-equity ratio for Tesco stood 4.10 and 6.12 during 2016 and 2017
respectively. The increasing equity of Tesco is significantly influenced by the virtual of
holding 20% equity interest in the associated group (Macve 2015). The debt equity ratio
stands 1.48 and 1.28 for 2016 and 2017 respectively for Morrison. Though the company aims
to create a balance between the debt and equity however the equity is identified and
transferred to the profit and loss in the period. The fall in the debt ratio is primarily attributed
to the higher amount of debt payoff reported by the firm.
(Source: As Created by Author)
The equity ratio for Tesco for the year 2016 stood 0.20 while in 2017 it stood 0.14.
The fall in the equity ratio Tesco is primarily because of the loss from the discontinued
processes that was attributable to the equity holders of the parental business (Freeman et al.
2017). Concerning the equity ratio of Morrison, the ratio stood 0.40 and 0.39 relatively
during the year 2016 and 2017. The stable equity ratio of Morrison is primarily attributed to
the balance created in its capital structure by managing the outstanding shares.
Debt Ratio Equity Ratio Debt-Equity Ratio Gearing Ratio
0
0.5
1
1.5
2
2.5
1.68
0.40
1.48
0.53
2.00
0.39
1.28
0.43
Capital Structure Ratios
#REF! 2016 2017
Figure 6: Figure representing Capital Structure Ratio of WM Morrison
(Source: As Created by Author)
The debt-equity ratio for Tesco stood 4.10 and 6.12 during 2016 and 2017
respectively. The increasing equity of Tesco is significantly influenced by the virtual of
holding 20% equity interest in the associated group (Macve 2015). The debt equity ratio
stands 1.48 and 1.28 for 2016 and 2017 respectively for Morrison. Though the company aims
to create a balance between the debt and equity however the equity is identified and
transferred to the profit and loss in the period. The fall in the debt ratio is primarily attributed
to the higher amount of debt payoff reported by the firm.
Secure Best Marks with AI Grader
Need help grading? Try our AI Grader for instant feedback on your assignments.
10ACCOUNTING FINANCIAL ANALYSIS REPORT
The gearing ratio refers to the firm’s long debt in comparison to the equity capital.
The gearing ratio for Tesco stood 1.57 in 2016 while in 2017 it stood 1.87. For Morrison the
gearing ratio stood 0.53 and 0.43 relatively in 2016 and 2017. Evidently throughout the
financial year Morrison has complied with the gearing and fixed charge covenants to its
credit facility. Tesco reported gearing ratio of 1.57 and 1.87 representing a higher level of
long term debt in comparison to the capital employed.
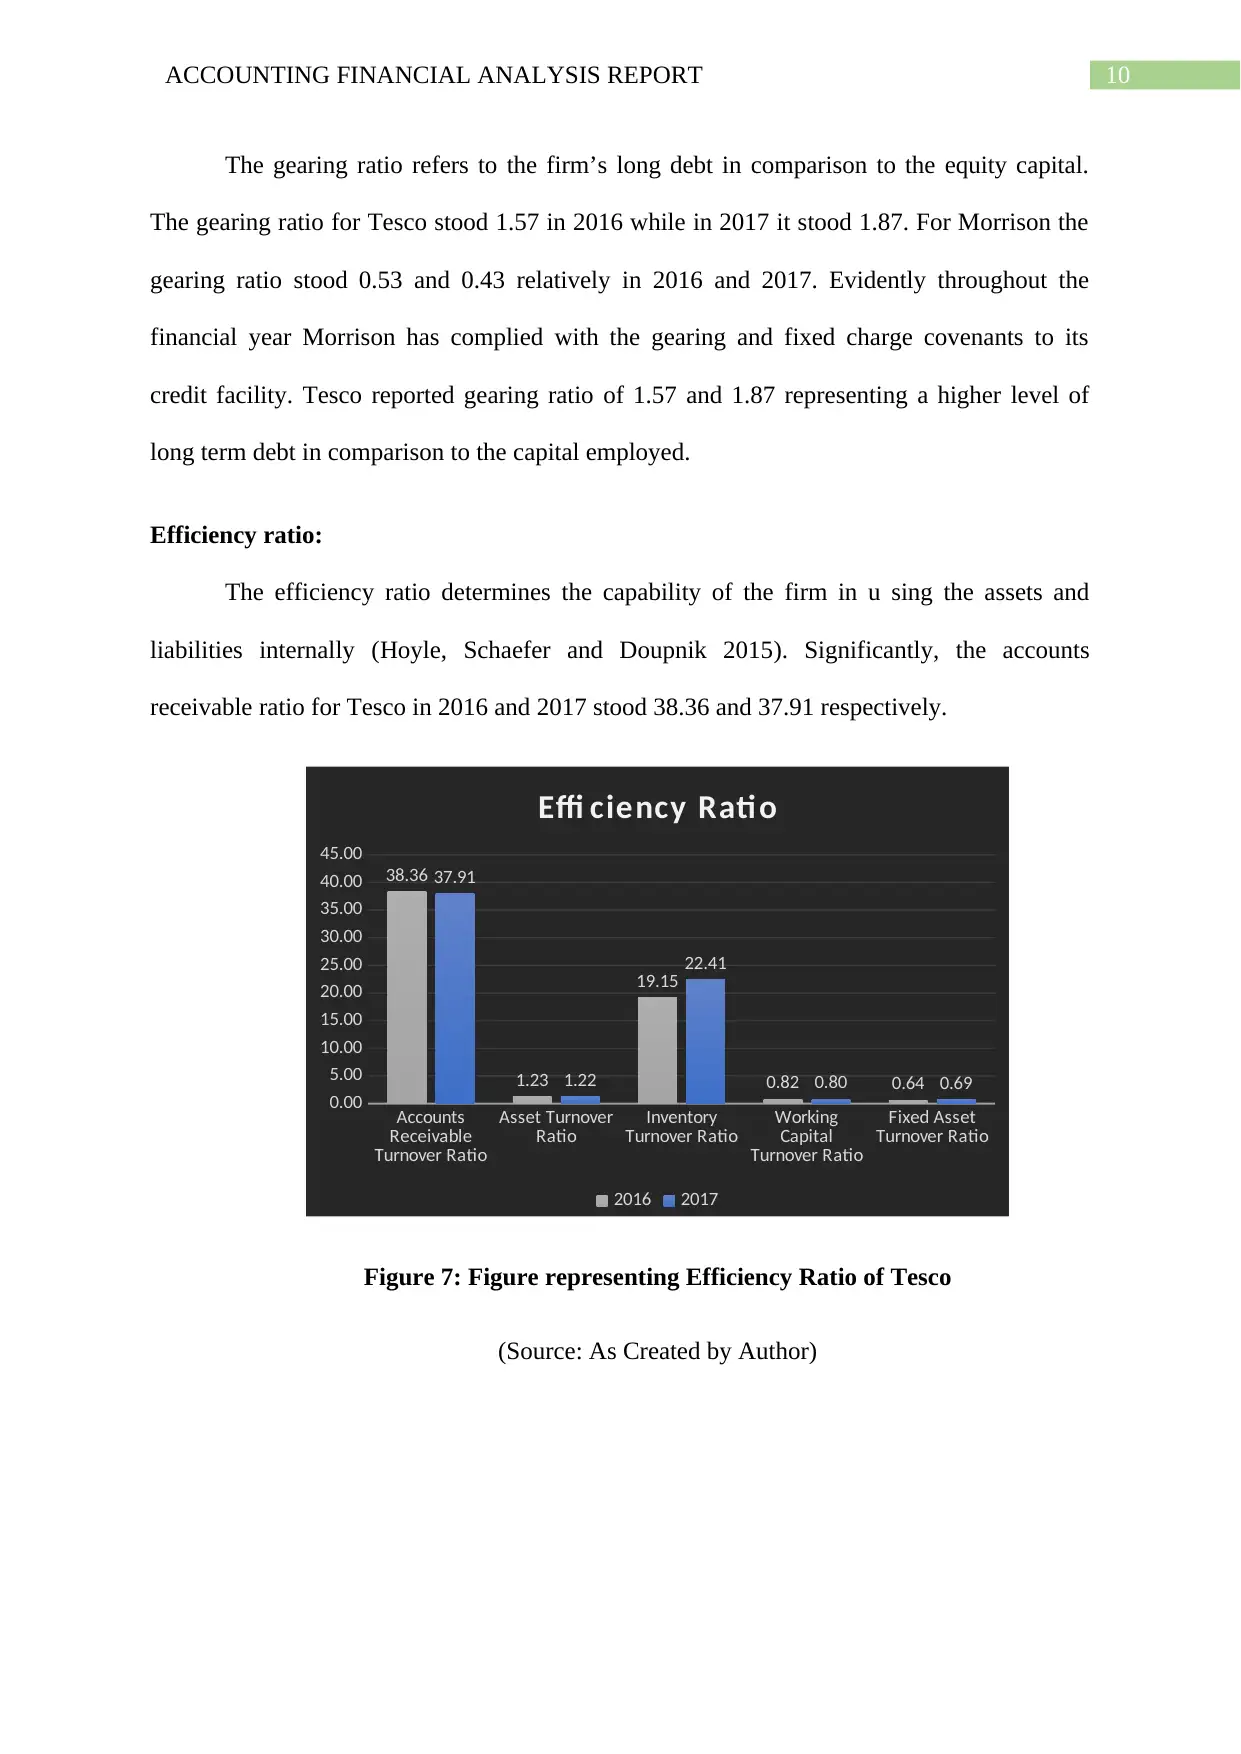
Efficiency ratio:
The efficiency ratio determines the capability of the firm in u sing the assets and
liabilities internally (Hoyle, Schaefer and Doupnik 2015). Significantly, the accounts
receivable ratio for Tesco in 2016 and 2017 stood 38.36 and 37.91 respectively.
Accounts
Receivable
Turnover Ratio
Asset Turnover
Ratio Inventory
Turnover Ratio Working
Capital
Turnover Ratio
Fixed Asset
Turnover Ratio
0.00
5.00
10.00
15.00
20.00
25.00
30.00
35.00
40.00
45.00
38.36
1.23
19.15
0.82 0.64
37.91
1.22
22.41
0.80 0.69
Effi ciency Rati o
2016 2017
Figure 7: Figure representing Efficiency Ratio of Tesco
(Source: As Created by Author)
The gearing ratio refers to the firm’s long debt in comparison to the equity capital.
The gearing ratio for Tesco stood 1.57 in 2016 while in 2017 it stood 1.87. For Morrison the
gearing ratio stood 0.53 and 0.43 relatively in 2016 and 2017. Evidently throughout the
financial year Morrison has complied with the gearing and fixed charge covenants to its
credit facility. Tesco reported gearing ratio of 1.57 and 1.87 representing a higher level of
long term debt in comparison to the capital employed.
Efficiency ratio:
The efficiency ratio determines the capability of the firm in u sing the assets and
liabilities internally (Hoyle, Schaefer and Doupnik 2015). Significantly, the accounts
receivable ratio for Tesco in 2016 and 2017 stood 38.36 and 37.91 respectively.
Accounts
Receivable
Turnover Ratio
Asset Turnover
Ratio Inventory
Turnover Ratio Working
Capital
Turnover Ratio
Fixed Asset
Turnover Ratio
0.00
5.00
10.00
15.00
20.00
25.00
30.00
35.00
40.00
45.00
38.36
1.23
19.15
0.82 0.64
37.91
1.22
22.41
0.80 0.69
Effi ciency Rati o
2016 2017
Figure 7: Figure representing Efficiency Ratio of Tesco
(Source: As Created by Author)
11ACCOUNTING FINANCIAL ANALYSIS REPORT
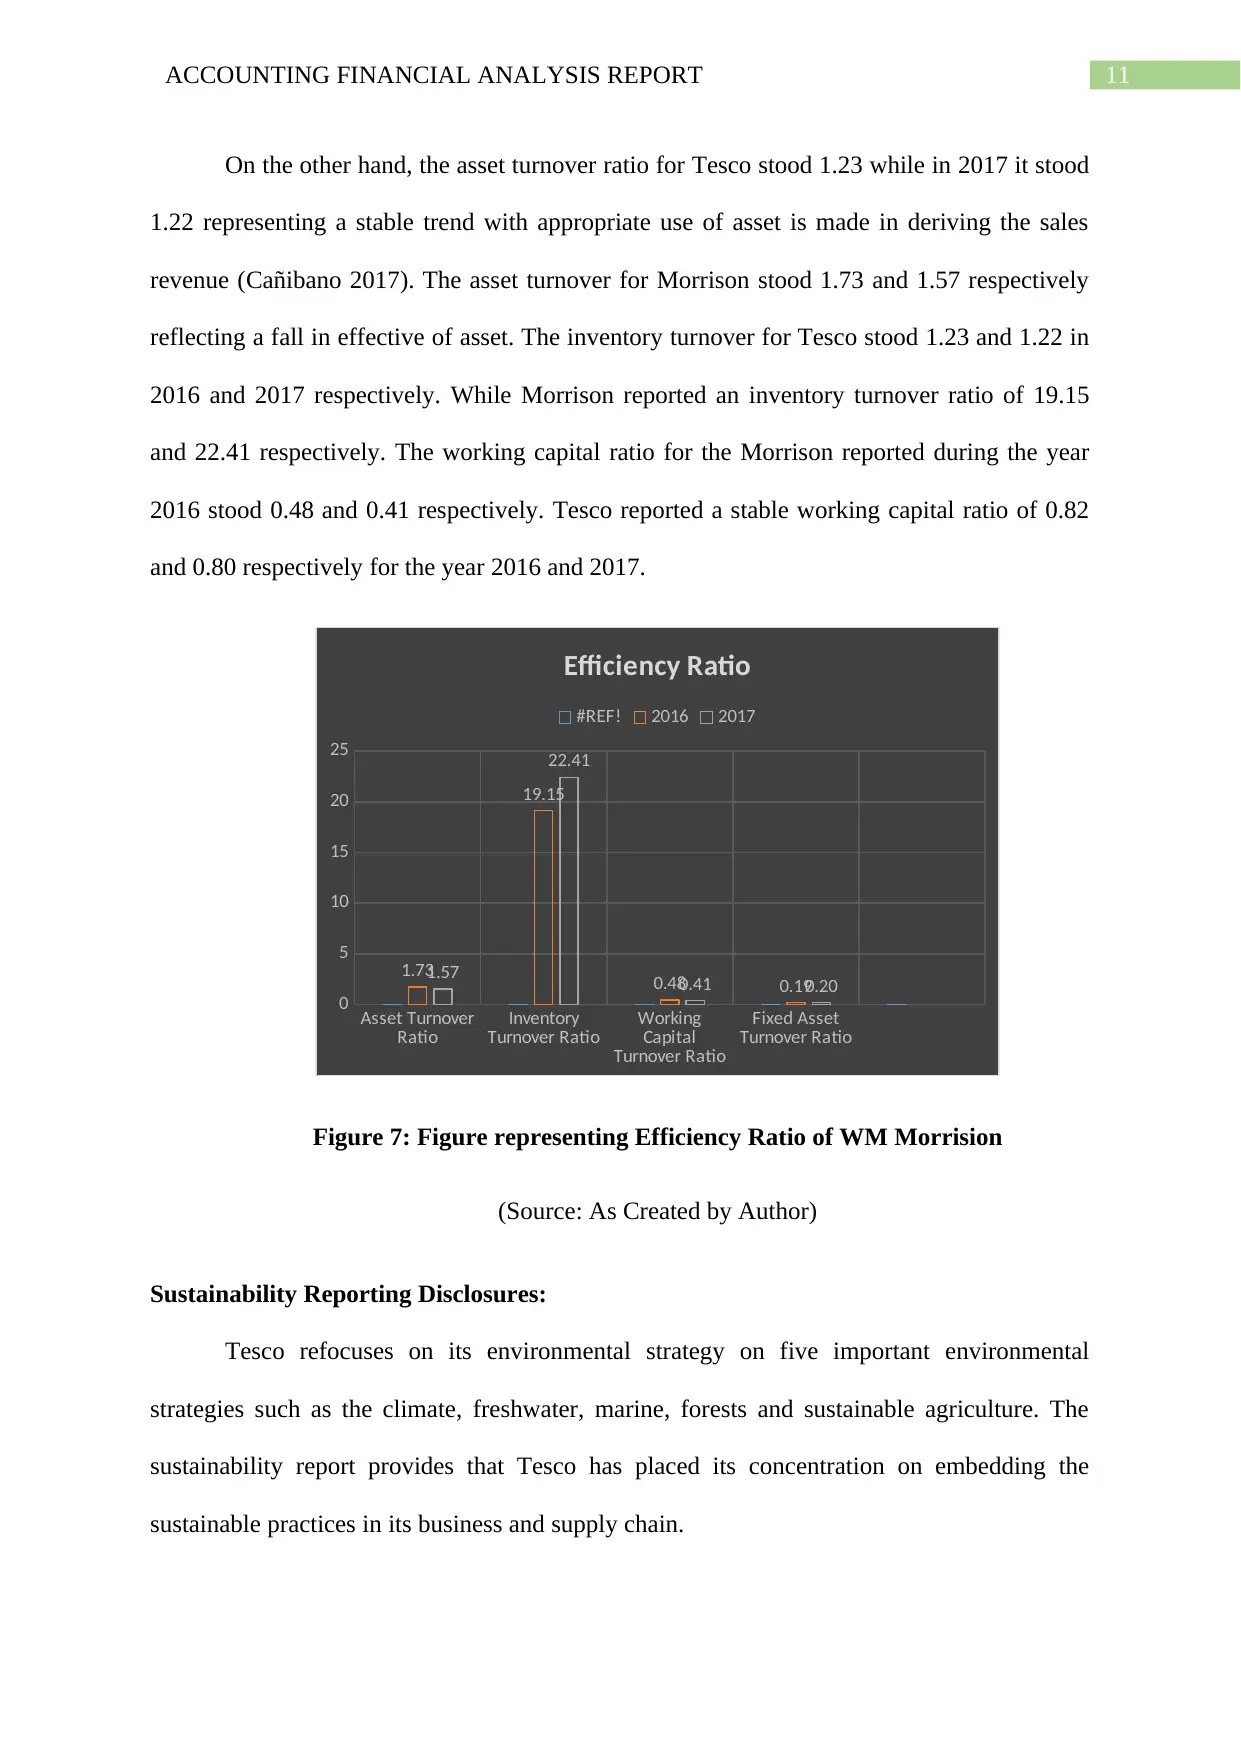
On the other hand, the asset turnover ratio for Tesco stood 1.23 while in 2017 it stood
1.22 representing a stable trend with appropriate use of asset is made in deriving the sales
revenue (Cañibano 2017). The asset turnover for Morrison stood 1.73 and 1.57 respectively
reflecting a fall in effective of asset. The inventory turnover for Tesco stood 1.23 and 1.22 in
2016 and 2017 respectively. While Morrison reported an inventory turnover ratio of 19.15
and 22.41 respectively. The working capital ratio for the Morrison reported during the year
2016 stood 0.48 and 0.41 respectively. Tesco reported a stable working capital ratio of 0.82
and 0.80 respectively for the year 2016 and 2017.
Asset Turnover
Ratio Inventory
Turnover Ratio Working
Capital
Turnover Ratio
Fixed Asset
Turnover Ratio
0
5
10
15
20
25
1.73
19.15
0.48 0.19
1.57
22.41
0.41 0.20
Efficiency Ratio
#REF! 2016 2017
Figure 7: Figure representing Efficiency Ratio of WM Morrision
(Source: As Created by Author)
Sustainability Reporting Disclosures:
Tesco refocuses on its environmental strategy on five important environmental
strategies such as the climate, freshwater, marine, forests and sustainable agriculture. The
sustainability report provides that Tesco has placed its concentration on embedding the
sustainable practices in its business and supply chain.
12ACCOUNTING FINANCIAL ANALYSIS REPORT
Tesco has been constantly focussed on reducing the carbon concentration of its
supplies and delivery centres and it is making development towards the 2020 target of
halving the carbon emission per square foot of its supplies and delivery centres with 25%
decrease in carbon emission per unit of goods that is distributed. Considering the key
achievement of the Tesco during the last financial year has partnered with Maritime
Stewardship council (MSC) (Tesco.ie 2018). The label of MSC enables Tesco customers to
easily recognize the fish which meet the highest standards of sustainability.
Additionally, Tesco has formed a devoted team of contractor indulgence and Tesco
network of suppliers which is an online public community of supplier (Watts and Zuo 2016).
Creation of such team can be regarded as the vital steps in creating a closer channels of
communication among the suppliers and producers across the world. this provides This
provides Tesco with the opportunity of sharing ideas, being innovative and driving
sustainability both in terms of supply chain and ultimately in its products that is enjoyed by
its customers.
Tesco has continued to maintain the utmost criterions of integrity and belief in its
business activities (Tesco.ie 2018). The tactical drivers are considered to generate a
sustainable worth for its shareholders and stakeholders in its industry. The sustainability
reporting disclosure of Tesco provides that the company is also dedicated to making an
accelerated progress in the direction of UN sustainable Development Goals to cut up the per
capita global waste of food by 2030. Overall, Tesco has duly followed the sustainable
reporting disclosure by remaining committed to its supplies, producers, shareholders and
customers.
WM Morrison is underpinned by the gratified legacy that is driven by the strong
philosophies with the superiority, value and truthfulness in the execution of the business
Paraphrase This Document
Need a fresh take? Get an instant paraphrase of this document with our AI Paraphraser
13ACCOUNTING FINANCIAL ANALYSIS REPORT
policy. The company has the vision of being the food expert for its customers and
acknowledges the wider communal and conservational accountabilities (Ethicalconsumer.org
2018). The sustainability reporting disclosure of WM Morrison provides that the company is
committed to investing in the local and sustainable sourcing and allowing its consumers to eat
healthy, while it makes sure that a wide range of quality, fresh and reasonable foods is
provided.
The sustainability reporting disclosure provides that the BioEthanol is derived from
wide range of agricultural produce together with the forest residue, sugar cane with entirely
renewable and sustainable fuel source (Barth 2015). A limitation is found in the packaging of
WM Morrison where the company packs the product to essentially protect and arrive the
products without damage however more sustainable approach is required to reduce the non-
renewable resource that is used in packaging.
A large number of its products are pack with polythene and cardboard which can be
regarded as the highest contributors of waste produced from WM Morrison stores. An
integrated approach is required to avert the unused through sustainable waste management
strategy for optimising, reducing and recycling the waste (Morrisons-corporate.com 2018).
Therefore, the sustainability reporting disclosure provides that Tesco has adopted more
integrated approach towards carbon reduction while WM Morrison needs to place greater
emphasis on promoting integrated sustainable practices.
Conclusion:
An overall conclusion can be drawn by stating that though the net profit of Tesco has
declined however the overall financial performance of the company has been better than
Morrison. The consumer retail market is presently volatile with changing customer taste and
preference makes it difficult for both Tesco and Morrison. Conclusively, the stable equity
14ACCOUNTING FINANCIAL ANALYSIS REPORT
ratio of Morrison is primarily attributed to the balance that is created in capital structure by
administering the outstanding shares. While Tesco reported a lower equity ratio primarily
because of the loss from the discontinued operations that was attributable to the equity
holders of the parent company. The overall sustainability disclosure of Tesco is
comparatively better than Morrison as the company has undertaken initiatives towards
environmental commitment.
15ACCOUNTING FINANCIAL ANALYSIS REPORT
Reference List:
Barker, R. and Penman, S., 2016. Moving the conceptual framework forward: Accounting for
uncertainty. Unpublished paper, Oxford University and Columbia University.
Barth, M.E., 2015. Financial accounting research, practice, and financial
accountability. Abacus, 51(4), pp.499-510.
Cañibano, L., 2017. Accounting and intangibles.
Carlon, S., McAlpine-Mladenovic, R., Palm, C., Mitrione, L., Kirk, N. and Wong, L.,
2015. Financial Accounting: Reporting, Analysis and Decision Making. John Wiley and Sons
Australia.
Dichev, I.D., 2017. On the conceptual foundations of financial reporting. Accounting and
Business Research, 47(6), pp.617-632.
Ethicalconsumer.org. (2018). Wm Morrison Supermarkets plc - Environmental Reporting.
[online] Available at: http://www.ethicalconsumer.org/companystories.aspx?
CompanyId=18343&CategoryId=271 [Accessed 17 Feb. 2018].
Freeman, R.J., Shoulders, C.D., McSwain, D.N. and Scott, R.B., 2017. Governmental and
nonprofit accounting. Pearson.
Henderson, S., Peirson, G., Herbohn, K. and Howieson, B., 2015. Issues in financial
accounting. Pearson Higher Education AU.
Hoyle, J.B., Schaefer, T. and Doupnik, T., 2015. Advanced accounting. McGraw Hill.
Macve, R., 2015. A Conceptual Framework for Financial Accounting and Reporting: Vision,
Tool, Or Threat?. Routledge.
Secure Best Marks with AI Grader
Need help grading? Try our AI Grader for instant feedback on your assignments.
16ACCOUNTING FINANCIAL ANALYSIS REPORT
Morrisons-corporate.com. (2018). Corporate Responsibility - Morrisons. [online] Available
at: https://www.morrisons-corporate.com/cr/ [Accessed 17 Feb. 2018].
Schaltegger, S. and Burritt, R., 2017. Contemporary environmental accounting: issues,
concepts and practice. Routledge.
Schaltegger, S. and Burritt, R., 2017. Contemporary environmental accounting: issues,
concepts and practice. Routledge.
Scott, W.R., 2015. Financial accounting theory (Vol. 2, No. 0, p. 0). Prentice Hall.
Tesco plc. (2018). Annual Report 2017. [online] Available at:
https://www.tescoplc.com/investors/reports-results-and-presentations/annual-report-2017/
[Accessed 17 Feb. 2018].
Tesco.ie. (2018). Corporate Responsibility | Tesco. [online] Available at:
https://www.tesco.ie/corporate-responsibility/ [Accessed 17 Feb. 2018].
Warren, C.S. and Jones, J., 2018. Corporate financial accounting. Cengage Learning.
Watts, R.L. and Zuo, L., 2016. Understanding practice and institutions: A historical
perspective. Accounting Horizons, 30(3), pp.409-423.
Williams, J., 2014. Financial accounting. McGraw-Hill Higher Education.
Zhang, Y. and Andrew, J., 2014. Financialisation and the conceptual framework. Critical
perspectives on accounting, 25(1), pp.17-26.
17ACCOUNTING FINANCIAL ANALYSIS REPORT
Appendix:
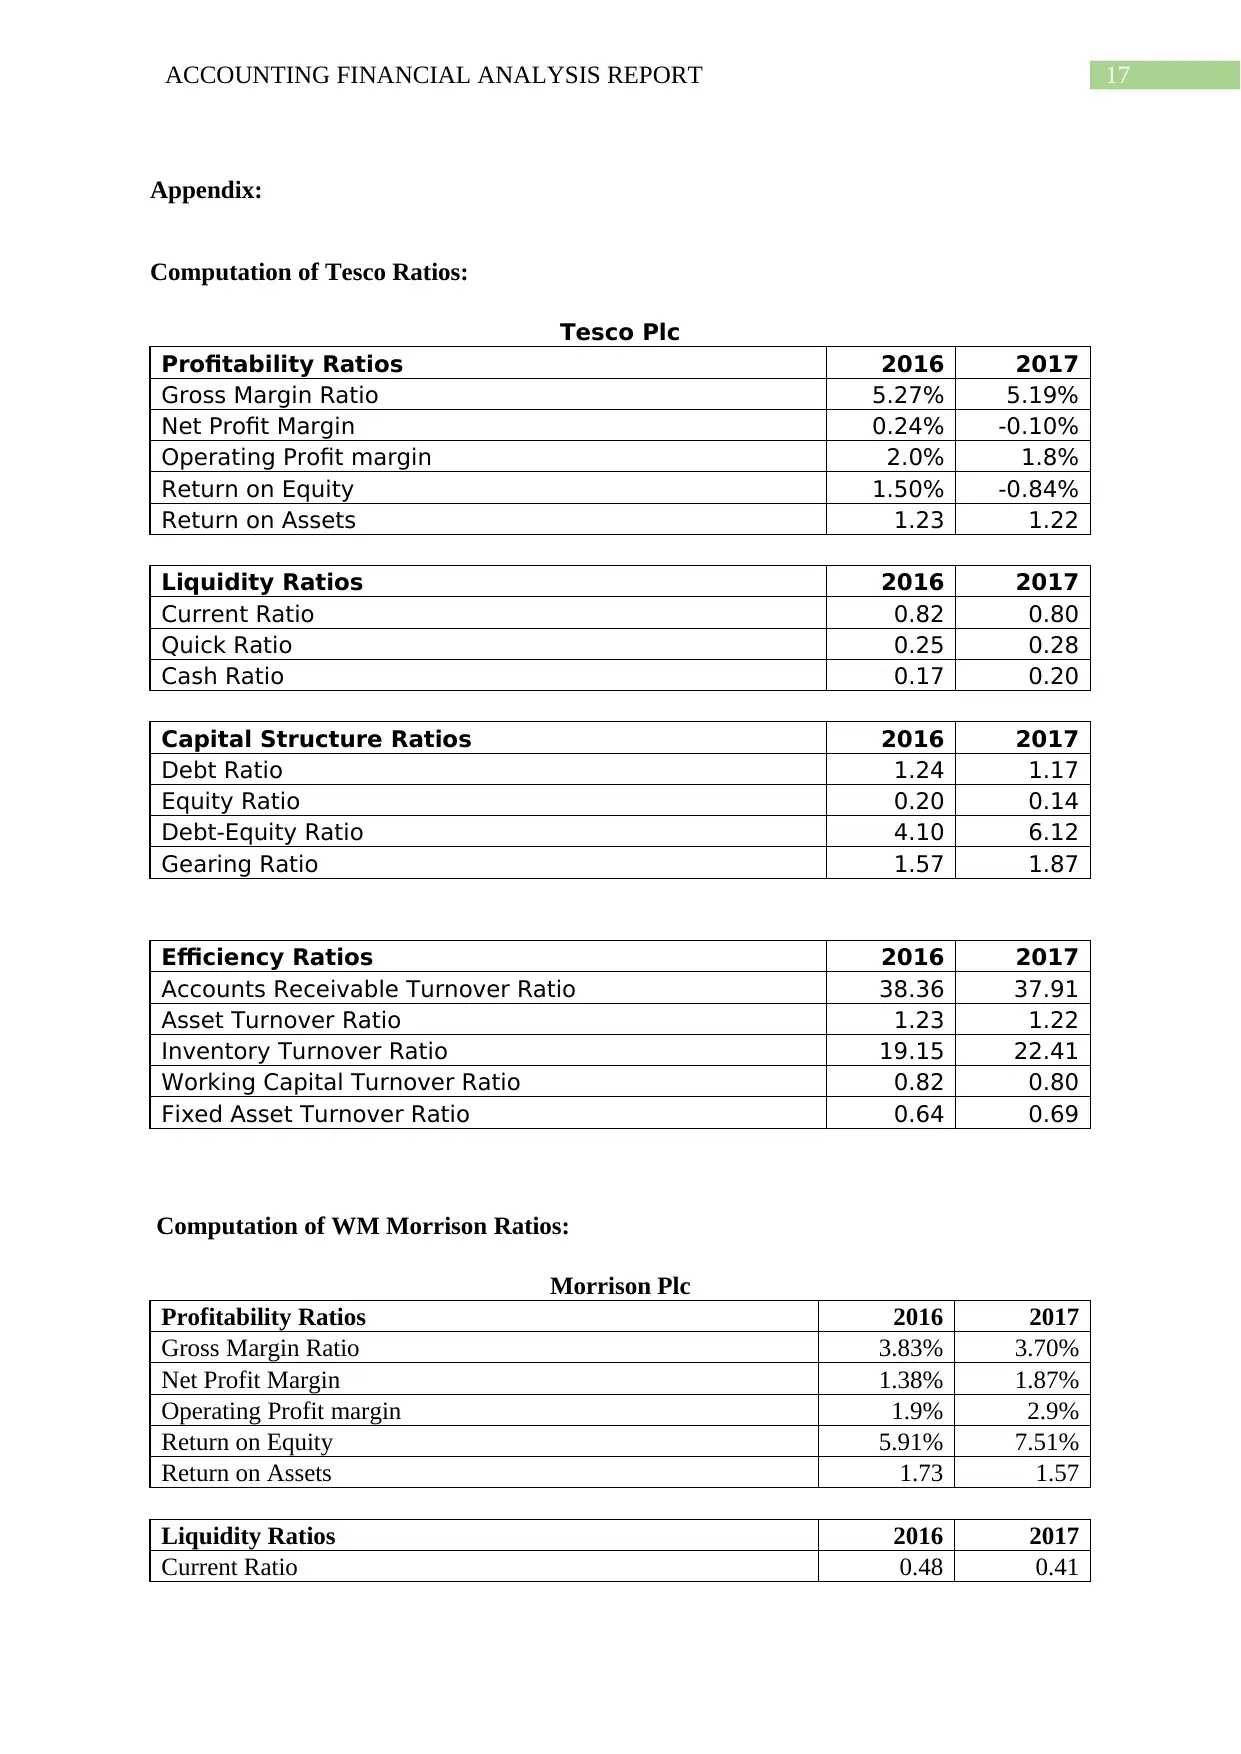
Computation of Tesco Ratios:
Tesco Plc
Profitability Ratios 2016 2017
Gross Margin Ratio 5.27% 5.19%
Net Profit Margin 0.24% -0.10%
Operating Profit margin 2.0% 1.8%
Return on Equity 1.50% -0.84%
Return on Assets 1.23 1.22
Liquidity Ratios 2016 2017
Current Ratio 0.82 0.80
Quick Ratio 0.25 0.28
Cash Ratio 0.17 0.20
Capital Structure Ratios 2016 2017
Debt Ratio 1.24 1.17
Equity Ratio 0.20 0.14
Debt-Equity Ratio 4.10 6.12
Gearing Ratio 1.57 1.87
Efficiency Ratios 2016 2017
Accounts Receivable Turnover Ratio 38.36 37.91
Asset Turnover Ratio 1.23 1.22
Inventory Turnover Ratio 19.15 22.41
Working Capital Turnover Ratio 0.82 0.80
Fixed Asset Turnover Ratio 0.64 0.69
Computation of WM Morrison Ratios:
Morrison Plc
Profitability Ratios 2016 2017
Gross Margin Ratio 3.83% 3.70%
Net Profit Margin 1.38% 1.87%
Operating Profit margin 1.9% 2.9%
Return on Equity 5.91% 7.51%
Return on Assets 1.73 1.57
Liquidity Ratios 2016 2017
Current Ratio 0.48 0.41
Appendix:
Computation of Tesco Ratios:
Tesco Plc
Profitability Ratios 2016 2017
Gross Margin Ratio 5.27% 5.19%
Net Profit Margin 0.24% -0.10%
Operating Profit margin 2.0% 1.8%
Return on Equity 1.50% -0.84%
Return on Assets 1.23 1.22
Liquidity Ratios 2016 2017
Current Ratio 0.82 0.80
Quick Ratio 0.25 0.28
Cash Ratio 0.17 0.20
Capital Structure Ratios 2016 2017
Debt Ratio 1.24 1.17
Equity Ratio 0.20 0.14
Debt-Equity Ratio 4.10 6.12
Gearing Ratio 1.57 1.87
Efficiency Ratios 2016 2017
Accounts Receivable Turnover Ratio 38.36 37.91
Asset Turnover Ratio 1.23 1.22
Inventory Turnover Ratio 19.15 22.41
Working Capital Turnover Ratio 0.82 0.80
Fixed Asset Turnover Ratio 0.64 0.69
Computation of WM Morrison Ratios:
Morrison Plc
Profitability Ratios 2016 2017
Gross Margin Ratio 3.83% 3.70%
Net Profit Margin 1.38% 1.87%
Operating Profit margin 1.9% 2.9%
Return on Equity 5.91% 7.51%
Return on Assets 1.73 1.57
Liquidity Ratios 2016 2017
Current Ratio 0.48 0.41
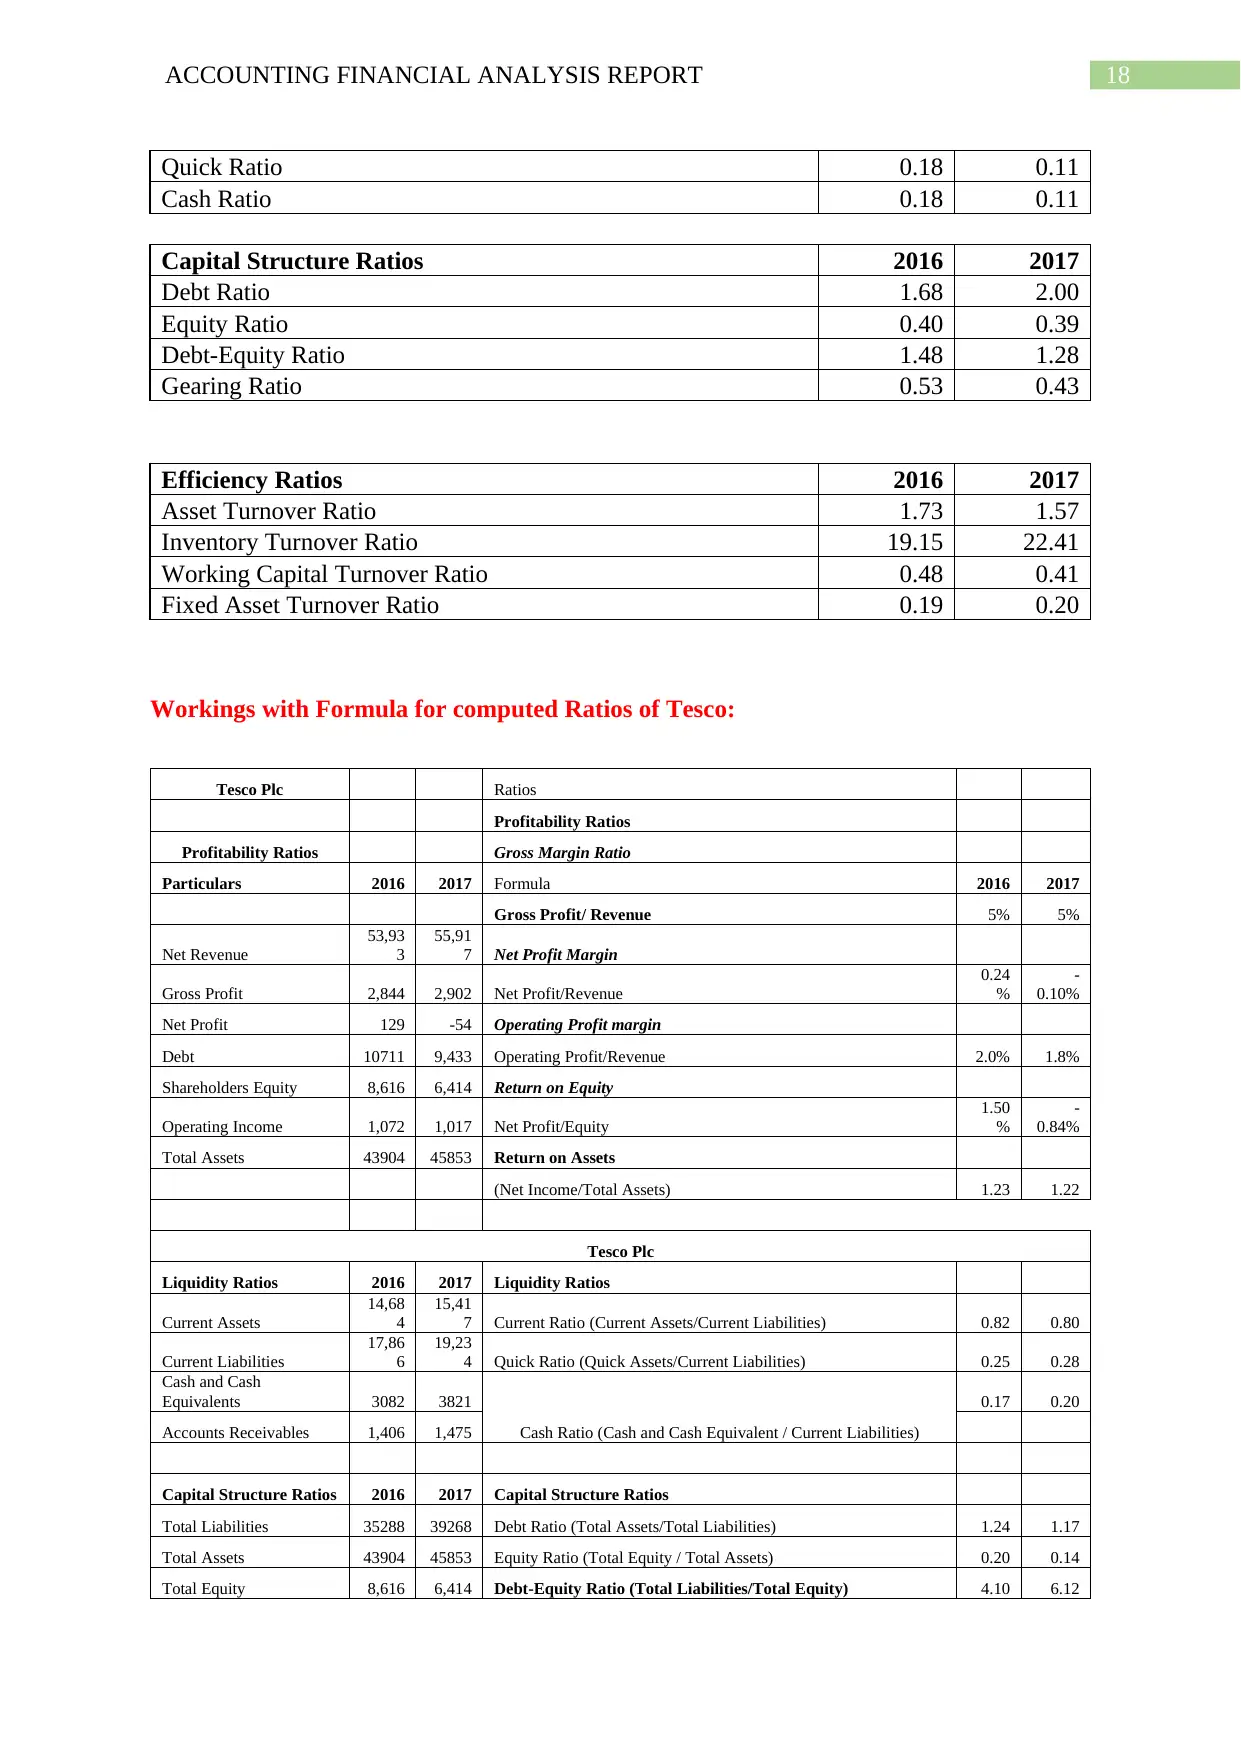
18ACCOUNTING FINANCIAL ANALYSIS REPORT
Quick Ratio 0.18 0.11
Cash Ratio 0.18 0.11
Capital Structure Ratios 2016 2017
Debt Ratio 1.68 2.00
Equity Ratio 0.40 0.39
Debt-Equity Ratio 1.48 1.28
Gearing Ratio 0.53 0.43
Efficiency Ratios 2016 2017
Asset Turnover Ratio 1.73 1.57
Inventory Turnover Ratio 19.15 22.41
Working Capital Turnover Ratio 0.48 0.41
Fixed Asset Turnover Ratio 0.19 0.20
Workings with Formula for computed Ratios of Tesco:
Tesco Plc Ratios
Profitability Ratios
Profitability Ratios Gross Margin Ratio
Particulars 2016 2017 Formula 2016 2017
Gross Profit/ Revenue 5% 5%
Net Revenue
53,93
3
55,91
7 Net Profit Margin
Gross Profit 2,844 2,902 Net Profit/Revenue
0.24
%
-
0.10%
Net Profit 129 -54 Operating Profit margin
Debt 10711 9,433 Operating Profit/Revenue 2.0% 1.8%
Shareholders Equity 8,616 6,414 Return on Equity
Operating Income 1,072 1,017 Net Profit/Equity
1.50
%
-
0.84%
Total Assets 43904 45853 Return on Assets
(Net Income/Total Assets) 1.23 1.22
Tesco Plc
Liquidity Ratios 2016 2017 Liquidity Ratios
Current Assets
14,68
4
15,41
7 Current Ratio (Current Assets/Current Liabilities) 0.82 0.80
Current Liabilities
17,86
6
19,23
4 Quick Ratio (Quick Assets/Current Liabilities) 0.25 0.28
Cash and Cash
Equivalents 3082 3821
Cash Ratio (Cash and Cash Equivalent / Current Liabilities)
0.17 0.20
Accounts Receivables 1,406 1,475
Capital Structure Ratios 2016 2017 Capital Structure Ratios
Total Liabilities 35288 39268 Debt Ratio (Total Assets/Total Liabilities) 1.24 1.17
Total Assets 43904 45853 Equity Ratio (Total Equity / Total Assets) 0.20 0.14
Total Equity 8,616 6,414 Debt-Equity Ratio (Total Liabilities/Total Equity) 4.10 6.12
Paraphrase This Document
Need a fresh take? Get an instant paraphrase of this document with our AI Paraphraser
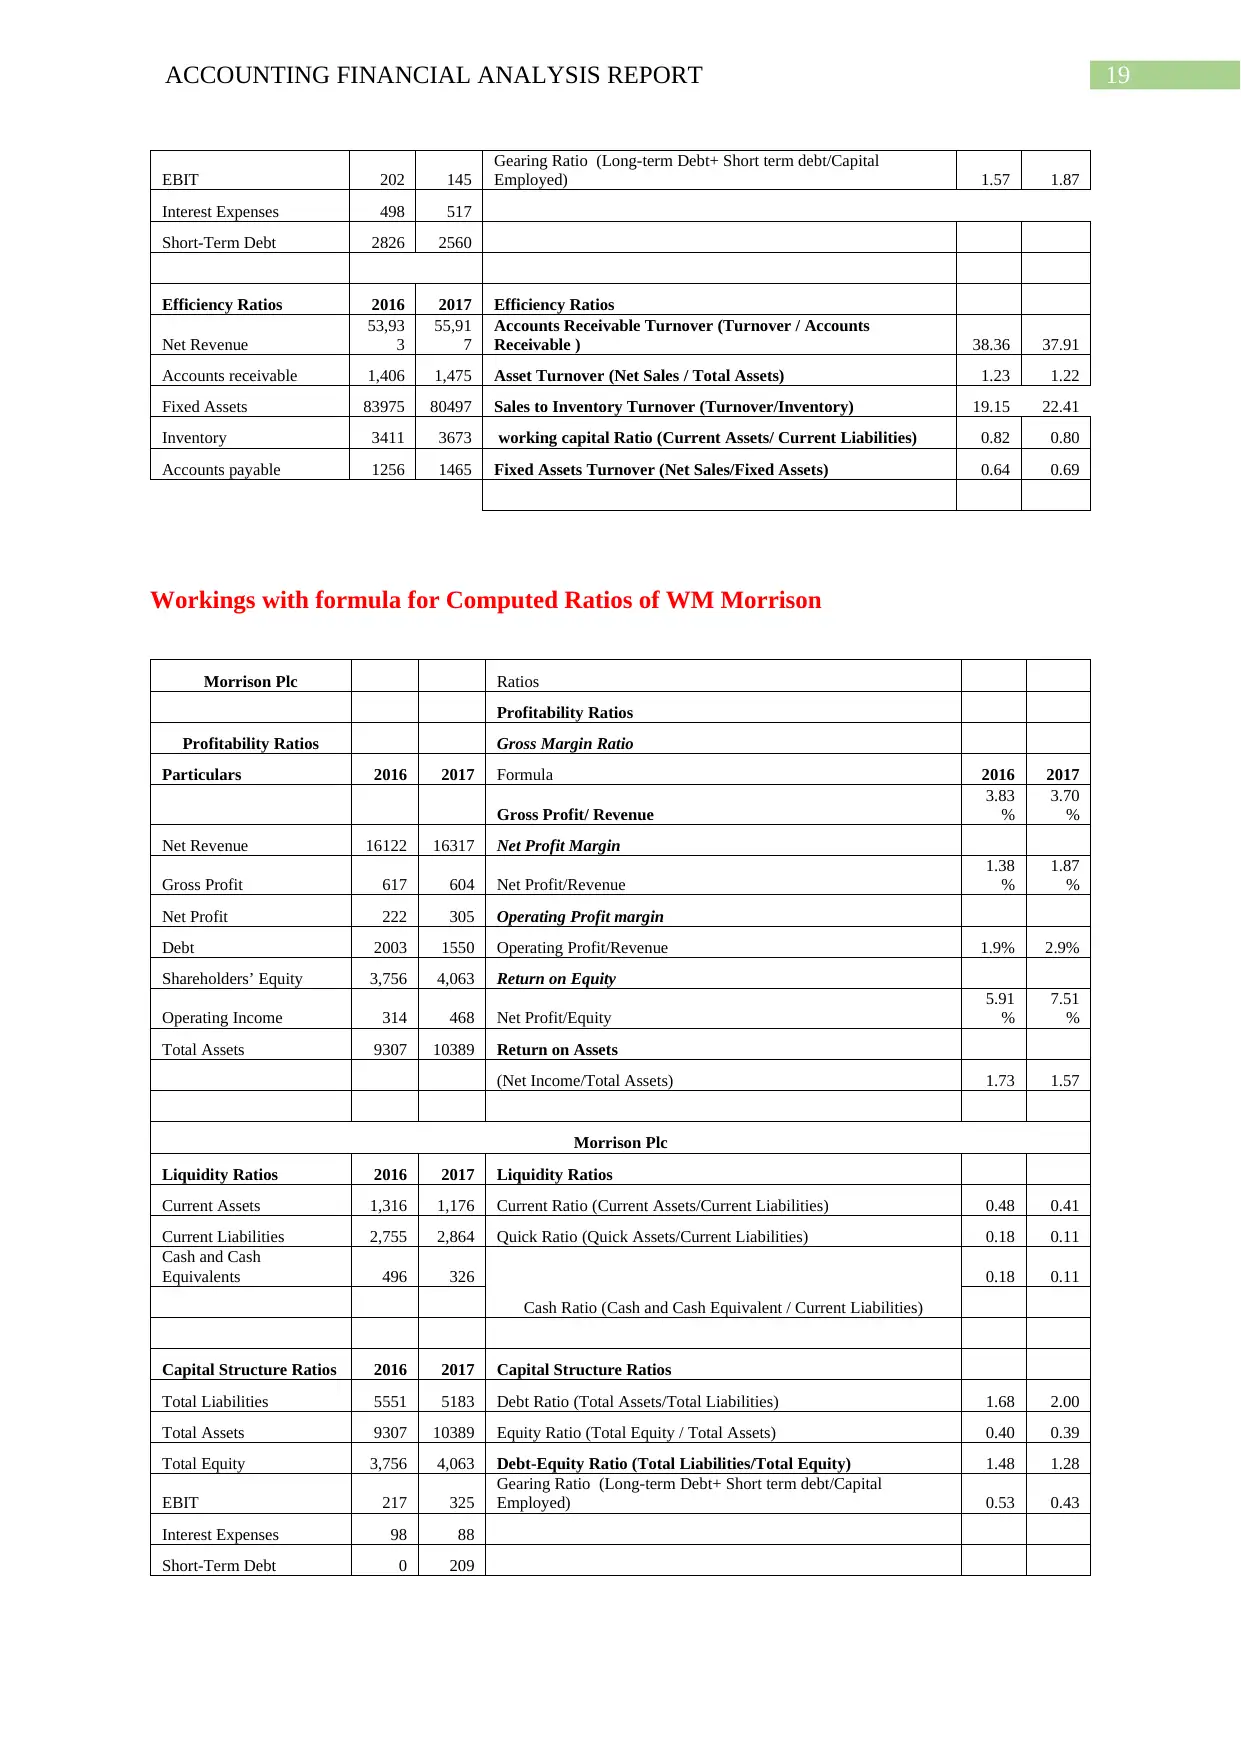
19ACCOUNTING FINANCIAL ANALYSIS REPORT
EBIT 202 145
Gearing Ratio (Long-term Debt+ Short term debt/Capital
Employed) 1.57 1.87
Interest Expenses 498 517
Short-Term Debt 2826 2560
Efficiency Ratios 2016 2017 Efficiency Ratios
Net Revenue
53,93
3
55,91
7
Accounts Receivable Turnover (Turnover / Accounts
Receivable ) 38.36 37.91
Accounts receivable 1,406 1,475 Asset Turnover (Net Sales / Total Assets) 1.23 1.22
Fixed Assets 83975 80497 Sales to Inventory Turnover (Turnover/Inventory) 19.15 22.41
Inventory 3411 3673 working capital Ratio (Current Assets/ Current Liabilities) 0.82 0.80
Accounts payable 1256 1465 Fixed Assets Turnover (Net Sales/Fixed Assets) 0.64 0.69
Workings with formula for Computed Ratios of WM Morrison
Morrison Plc Ratios
Profitability Ratios
Profitability Ratios Gross Margin Ratio
Particulars 2016 2017 Formula 2016 2017
Gross Profit/ Revenue
3.83
%
3.70
%
Net Revenue 16122 16317 Net Profit Margin
Gross Profit 617 604 Net Profit/Revenue
1.38
%
1.87
%
Net Profit 222 305 Operating Profit margin
Debt 2003 1550 Operating Profit/Revenue 1.9% 2.9%
Shareholders’ Equity 3,756 4,063 Return on Equity
Operating Income 314 468 Net Profit/Equity
5.91
%
7.51
%
Total Assets 9307 10389 Return on Assets
(Net Income/Total Assets) 1.73 1.57
Morrison Plc
Liquidity Ratios 2016 2017 Liquidity Ratios
Current Assets 1,316 1,176 Current Ratio (Current Assets/Current Liabilities) 0.48 0.41
Current Liabilities 2,755 2,864 Quick Ratio (Quick Assets/Current Liabilities) 0.18 0.11
Cash and Cash
Equivalents 496 326
Cash Ratio (Cash and Cash Equivalent / Current Liabilities)
0.18 0.11
Capital Structure Ratios 2016 2017 Capital Structure Ratios
Total Liabilities 5551 5183 Debt Ratio (Total Assets/Total Liabilities) 1.68 2.00
Total Assets 9307 10389 Equity Ratio (Total Equity / Total Assets) 0.40 0.39
Total Equity 3,756 4,063 Debt-Equity Ratio (Total Liabilities/Total Equity) 1.48 1.28
EBIT 217 325
Gearing Ratio (Long-term Debt+ Short term debt/Capital
Employed) 0.53 0.43
Interest Expenses 98 88
Short-Term Debt 0 209
20ACCOUNTING FINANCIAL ANALYSIS REPORT
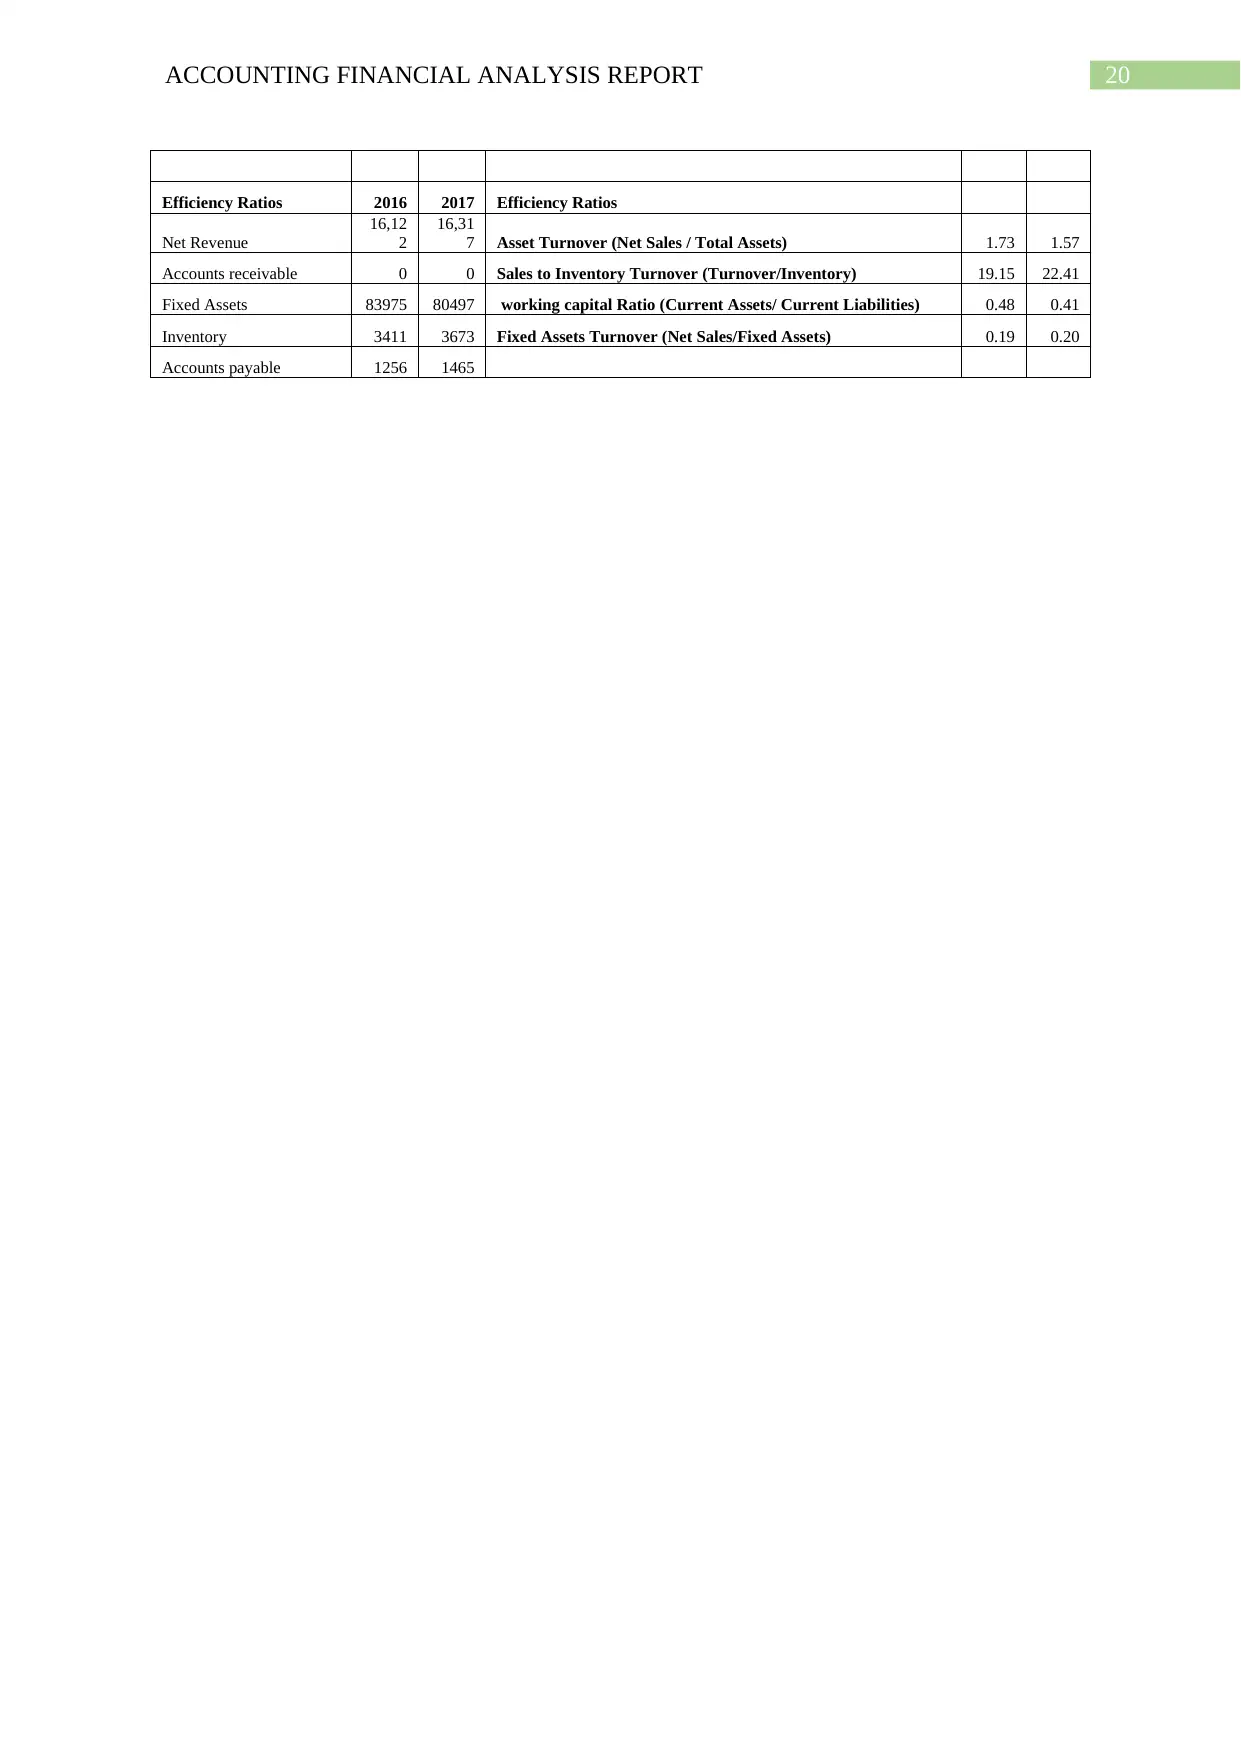
Efficiency Ratios 2016 2017 Efficiency Ratios
Net Revenue
16,12
2
16,31
7 Asset Turnover (Net Sales / Total Assets) 1.73 1.57
Accounts receivable 0 0 Sales to Inventory Turnover (Turnover/Inventory) 19.15 22.41
Fixed Assets 83975 80497 working capital Ratio (Current Assets/ Current Liabilities) 0.48 0.41
Inventory 3411 3673 Fixed Assets Turnover (Net Sales/Fixed Assets) 0.19 0.20
Accounts payable 1256 1465
1 out of 21
Related Documents


Your All-in-One AI-Powered Toolkit for Academic Success.
+13062052269
info@desklib.com
Available 24*7 on WhatsApp / Email
![[object Object]](/_next/static/media/star-bottom.7253800d.svg)
Unlock your academic potential
© 2024 | Zucol Services PVT LTD | All rights reserved.