FINANCIAL AND BUSINESS ANALYSIS TABLE OF CONTENTS EXECUTIVE SUMMARY
Added on 2020-07-23
24 Pages5174 Words119 Views
FINANCIAL ANDBUSINESS ANALYSIS
TABLE OF CONTENTSEXECUTIVE SUMMARY.............................................................................................................1INDUSTRY ANALYSIS................................................................................................................3Rivalry among existing competitors.......................................................................................4Threat of new entrants............................................................................................................4Threat of substitute products..................................................................................................4Bargaining power of buyers...................................................................................................5Bargaining power of suppliers................................................................................................5FINANCIAL RATIOS.....................................................................................................................5Liquidity ratios.......................................................................................................................5Solvency ratios.......................................................................................................................6Profitability ratios...................................................................................................................7Employee count measures......................................................................................................9Accuracy of the Financial statements...................................................................................10Absolute Valuation with Gordan Growth Model.................................................................11Free cash flow valuation.......................................................................................................17Relative Valuation based on comparable data......................................................................17REFERENCES..............................................................................................................................19
ILLUSTRATION INDEXIllustration 1: Revenue on International Platform...........................................................................2Illustration 2: Porter's five force model...........................................................................................4Illustration 3: Current ratio..............................................................................................................6Illustration 4: Debt to equity ratio....................................................................................................7Illustration 5: Interest coverage ratio...............................................................................................7Illustration 6: Gross profit ratio.......................................................................................................8Illustration 7: Operating profit ratio.................................................................................................8Illustration 8: Net profit ratio...........................................................................................................9Illustration 9: Revenue per employee............................................................................................10Illustration 10: Comparison of earning per share..........................................................................14Index of TablesTable 1: Calculation of liquidity ratio..............................................................................................5Table 2: Solvency Ratios.................................................................................................................6Table 3: Calculation of Profitability ratios......................................................................................7Table 4: Calculation of Employee count measures..........................................................................9Table 5: Balance Sheet based accrual ratio....................................................................................10Table 6: Cash Flow based accrual ratio.........................................................................................11Table 7: Calculation of operating cash flow to operating income.................................................11Table 8: Estimated Return on Equity.............................................................................................12Table 9: Forecasted Net income....................................................................................................12Table 10: Calculation of Retention rate.........................................................................................13Table 11: Calculation of Sensitivity Analysis...............................................................................16Table 12: Free Cash Flow Valuation.............................................................................................17
EXECUTIVE SUMMARYIn order to make analysis of business performance there are mainly two aspects includedwhich are financial and non-financial. In the present study, financial aspect is covered forassessing company's performance in the relevant industry. In the current research, Netflixcompany is taken as a base which is one of the largest firm operating in entertainment industry. Itis American based public enterprise and having presence in more than 190 countries. The presentstudy focuses on industry analysis using Porter’s five force model. Apart from this, financialratios are calculated up to five accounting periods and financial statements on the basis ofaccuracy are prepared. In addition to this, valuation process is shown of the company afterconsisting Gordon Growth Model. Free cash flow valuation of Netflix entertainment entity isalso described in the present study. At the end of report, technical analysis is presented of thecited firm and then business performance is analysed in proper direction. Company profile – NetflixNetflix is an America – based company which is the world's leading organisation in theinternet television network. It has total subscribers list of 104 million in around 190 countrieswith 5 million + subscribers in United Kingdom and 52 million in United States and anemployee count of 3500 employees. It earned a total revenue of US $ 8.83 billion in the year2016. Netflix has an incredible count of 125 million hours of TV shows and movies per day. Anysubscriber is allowed to play, pause, and resume any video with any commercial commitments.The company has an offering capacity of more than 15,000 titles and also maintains an inventoryof more than 5 million discs of movies and TV series. Netflix provides its streaming services ona number of compatible devices which include Blu-ray Disc players, tablet computers, mobilephones, high definition television (HDTV) receivers, home theatre systems, set top boxes, andvideo game consoles. Company's biggest competitors are Amazon Prime Inc. and Hulu plus,these two companies cover a market share of 13% and 6.5% respectively against the huge marketshare of 36% hold by Netflix of the American households.Revenues of can be divided as follows: The company have been planning to opt forglobal expansion in order to expand its business. It has already been present in most of thecountries of the world. Revenues of can be divided as follows :1
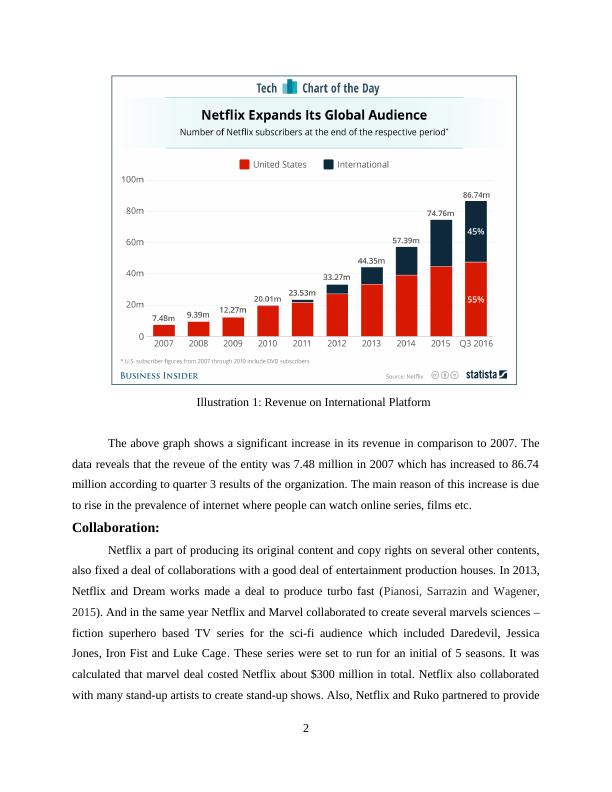
The above graph shows a significant increase in its revenue in comparison to 2007. Thedata reveals that the reveue of the entity was 7.48 million in 2007 which has increased to 86.74million according to quarter 3 results of the organization. The main reason of this increase is dueto rise in the prevalence of internet where people can watch online series, films etc. Collaboration:Netflix a part of producing its original content and copy rights on several other contents,also fixed a deal of collaborations with a good deal of entertainment production houses. In 2013,Netflix and Dream works made a deal to produce turbo fast (Pianosi, Sarrazin and Wagener,2015). And in the same year Netflix and Marvel collaborated to create several marvels sciences –fiction superhero based TV series for the sci-fi audience which included Daredevil, JessicaJones, Iron Fist and Luke Cage. These series were set to run for an initial of 5 seasons. It wascalculated that marvel deal costed Netflix about $300 million in total. Netflix also collaboratedwith many stand-up artists to create stand-up shows. Also, Netflix and Ruko partnered to provide2Illustration 1: Revenue on International Platform
super high definition content to the subscribers. Netflix also have a huge base with acollaboration made with Leonardo DiCaprio for his documentaries. Deal between Netflix andDisney was made in 2012 by creation of movies. Strategy to expand business : Strategy to expand business: Netflix opted for an excellent strategy to co produce shows with other entertainment unitswhose content was already a success in other sources available giving it a boost to the revenue. Italso gave a decent focus on the R&D activities to keep the content updated and attractive to thesubscribers (Tian, 2013).Exchange rate risk: As, Netflix operates in 190 countries it's risk of exchange rate is particularly high. Itsrate risk between United Kingdom and America has been good for the company as it has jumpedfor $1.8-1.3 to every one euro. Netflix also shares big risks in the countries like India, China asthe exchange rate is quite high of 0.15 US dollar to one Chinese Yuan and 0.016 US$ to 1 IndianRupee.It is an important driving factor which is considered by Netflix while planning for globalexpansion. The currency exchange rate and economy of the country helps in deciding that howmuch revenue it can generate from the same. The prices are decided according to the purchasingpower of the company and this is the reason why prices of the entity fluctuates among thecountries. INDUSTRY ANALYSISEntertainment industry is one of the fastest growing and having high contribution ingrowth rate of every economy. For analysing particular sector there are several kinds of methodsavailable with the analyst and one of them is Porter's five forces model. By using this, basicallyfour aspects of the overall industry are analysed in appropriate direction. In this respectivemarket segment, there are various companies operating in the present era but level of substituteproducts is very low (Porter's Five Forces, 2016). Moreover, industry analysis of entertainmentwith the help of Porter's five forces is such as follows:3
End of preview
Want to access all the pages? Upload your documents or become a member.
Related Documents
Situation Analysis Of Shale Gas Industrylg...
|22
|4425
|15
Financial Performance of Netflix: Subscribers Growth, Covid-19 Impact, and Dividend Policylg...
|20
|4474
|83
Financial Statement Analysis Report PDFlg...
|21
|4223
|9
Financial Statement Analysis of CSL Limitedlg...
|21
|4218
|269
Calculation and Analysis of Performance Ratios of TPG Telecom Limitedlg...
|18
|3903
|228
Financial Decision Making in Harvey Homes Plc : Case Studylg...
|16
|5699
|44