Financial and Economic Literacy for Managers Assignment Report
VerifiedAdded on 2020/01/15
|16
|3384
|287
Report
AI Summary
This report delves into the fundamentals of financial and economic literacy, targeting managers. It begins by classifying production methods (job, batch, mass), followed by an explanation of opportunity costs and their significance. The report then explores the UK's Standard Industrial Classification (SIC) system and its evolution. It analyzes the shifts and movements along demand curves, including the income and substitution effects of price changes. The second part of the report examines market types (perfect competition and monopoly), public goods, and government interventions. It outlines macroeconomic policy objectives and the circular flow of income. The final section covers finance areas, determinants of interest rates, financial statements (balance sheet, income statement, cash flow statement, and statement of shareholders' equity), and concludes with a ratio analysis of Marks and Spencer for 2014. This report provides a comprehensive overview of financial and economic concepts essential for effective management.

Financial and Economic
Literacy for Managers
Literacy for Managers
Paraphrase This Document
Need a fresh take? Get an instant paraphrase of this document with our AI Paraphraser
a) Three classifications of production
The main types of production includes Job Production, Batch production and Mass or
flow production, however, the selection of production system depends on the nature of the
product and quantity. These production system includes Job production, Batch production and
Mass production.
Under, the job production system, special products are produced in accordance with the
order placed by the customers. In this method, each product requires separate job for
production. The job production system requires large number of workers to be employed who
must conversant with different jobs. As per illustration, ship building, Construction business
and printing houses operates under job production system (Sloman, Norris and Garrett, 2013).
Batch production is a method of production which is used at the sites where repetitive
production requires. The products under batch production methods are produced in advance as
per the current and expected demand from market. Under this system, the work is divided as per
different operations and only a single batch is produced at one time. This production system is
followed for motor manufacturing, pharmaceutical companies and for manufacturing small
hand tools.
The main production method is Mass or flow production which is referred as constant
production of standardized products in large amount. The method is used for reducing direct
manufacturing cost along with this, process layout system is followed to produce various units.
Examples: household appliances and automobile parts (Sloman, Norris and Garrett, 2013).
b) Opportunity costs
Within the economic field, opportunity cost is termed as a fundamental cost under which
one alternative is lost in search and selection of other alternatives. This cost is bear in the form
of non-monetary terms. The opportunity cost of resources refers to value of the next-highest-
valued alternative use of such resource. The major use of such cost is in calculating cost benefit
analysis of an investment. This is further denoted as a kind of benefit that is to be raised from an
alternative use of the same resource. This concept is applied under various areas like consumer
choices, production capabilities (Armendáriz and Morduch, 2010). Cost of capital, time
management, career choices etc. The main use of opportunity cost is in optimal use of scare
resources. For example: Individual has £20,000, which can be either invested for purchasing
stocks whose prices are expected to be increased, on the hand has, other person has opportunity
to apply for higher education. The person has chosen the option of stock purchase, however, he
lost the opportunity to have increased earning for lifetime, if he /she completes higher
education. Thus, one forgone opportunity of lifetime earning is lost for purchasing stocks.
c) The purpose and evolution of the UK standard industrial classification (SIC) since 1948
The Standard Industrial Classification (SIC) has been introduced within the UK in 1948
with a purpose to classify business institutions in accordance to the economic activities which
they carry. The government and authorised regulatory bodies make specific classification for
commercial activities of business, while using SIC guidelines. However, it is used for
administrative purpose to categorize commercial activities in a common structure. Many of
changes have been done in Standard Industrial Classification and SIC 2007 is the main revision
of Standard Industrial Classification system since 1992, nonetheless, a minor revision was done
in 2003. On the basis of classification, the non-statistical activities can be classified as per
⊘ This is a preview!⊘
Do you want full access?
Subscribe today to unlock all pages.
Trusted by 1+ million students worldwide
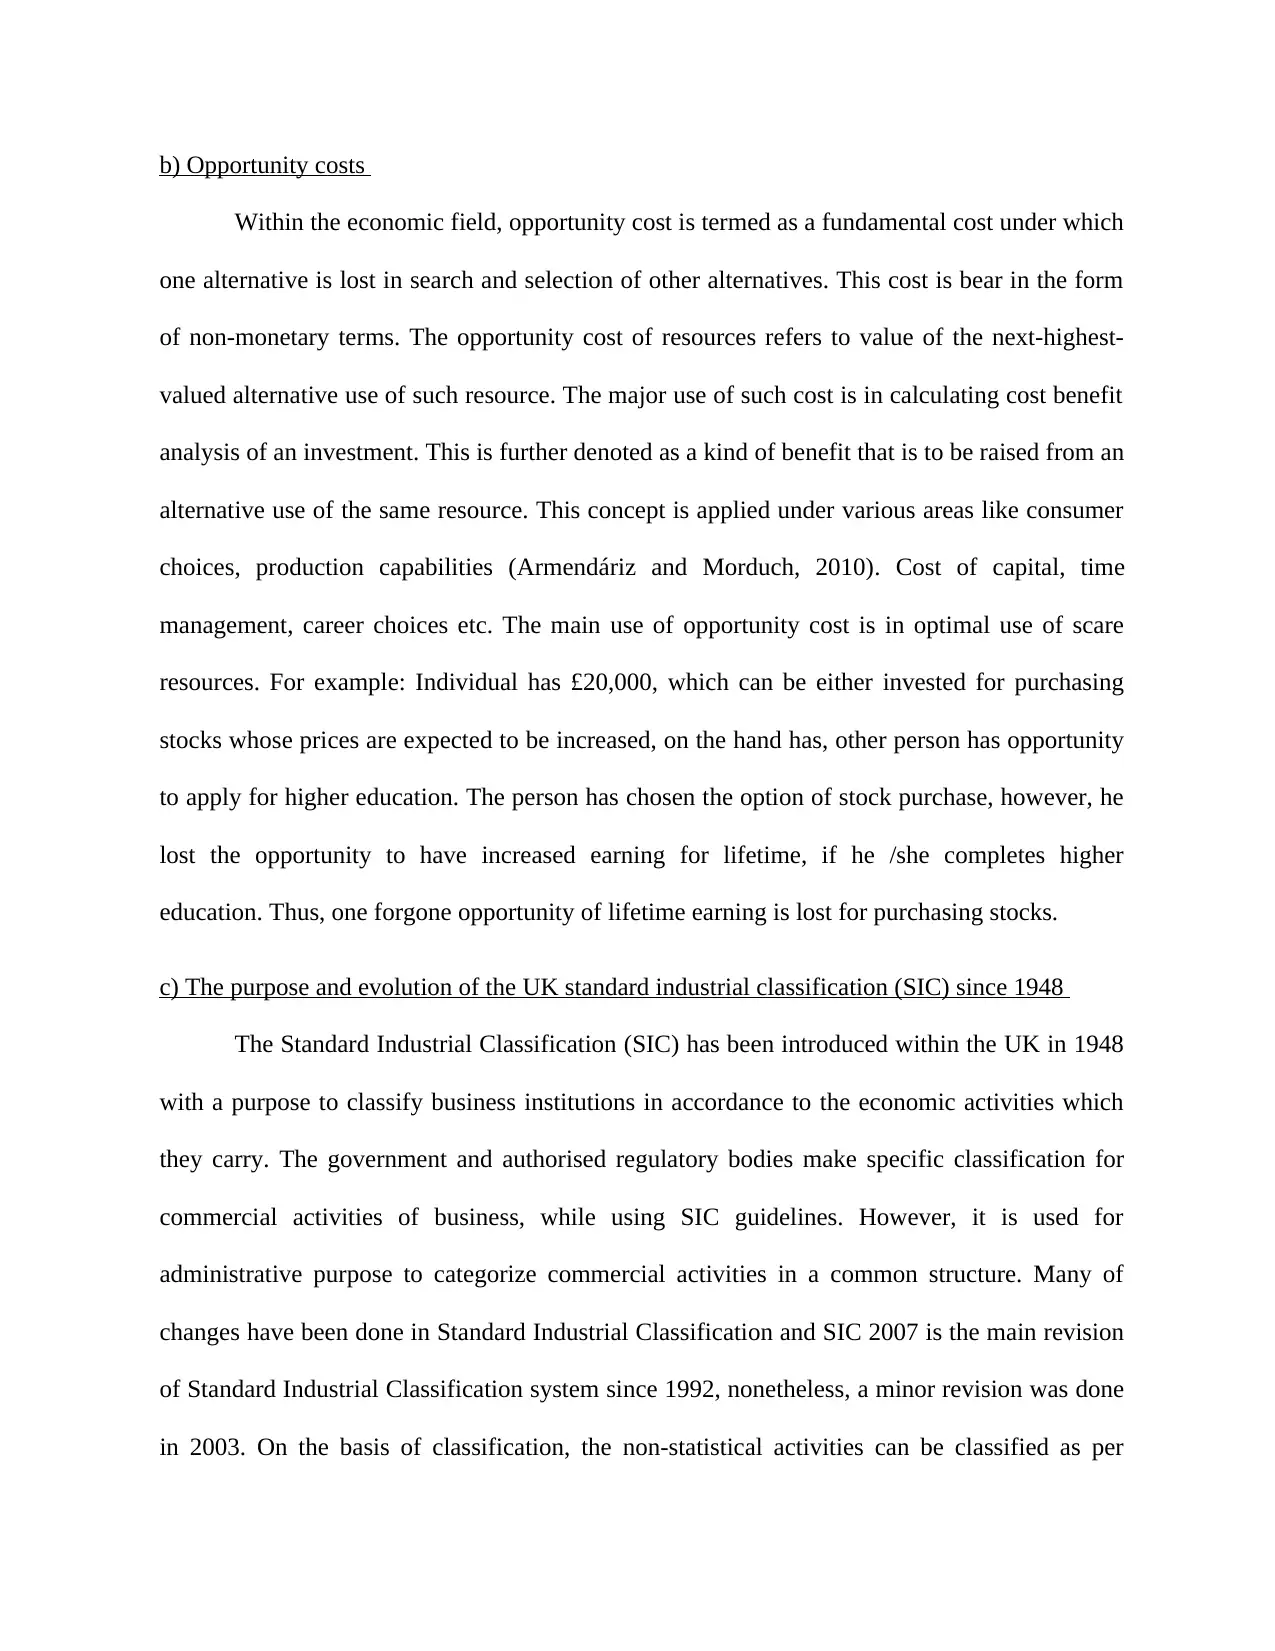
economic activities and the particular framework is used for collection, tabulation, presentation
and analysis of data and to promote uniformity (National Statistics, 2007).
Figure 1 UK Standard Industrial Classification of Economic Activities 2007 (SIC 2007)
d) The shift in the demand curve and the movement along the demand curve
The demand curve is a graphical representation of relationship among demand and
price of the commodity, at a specific time period.
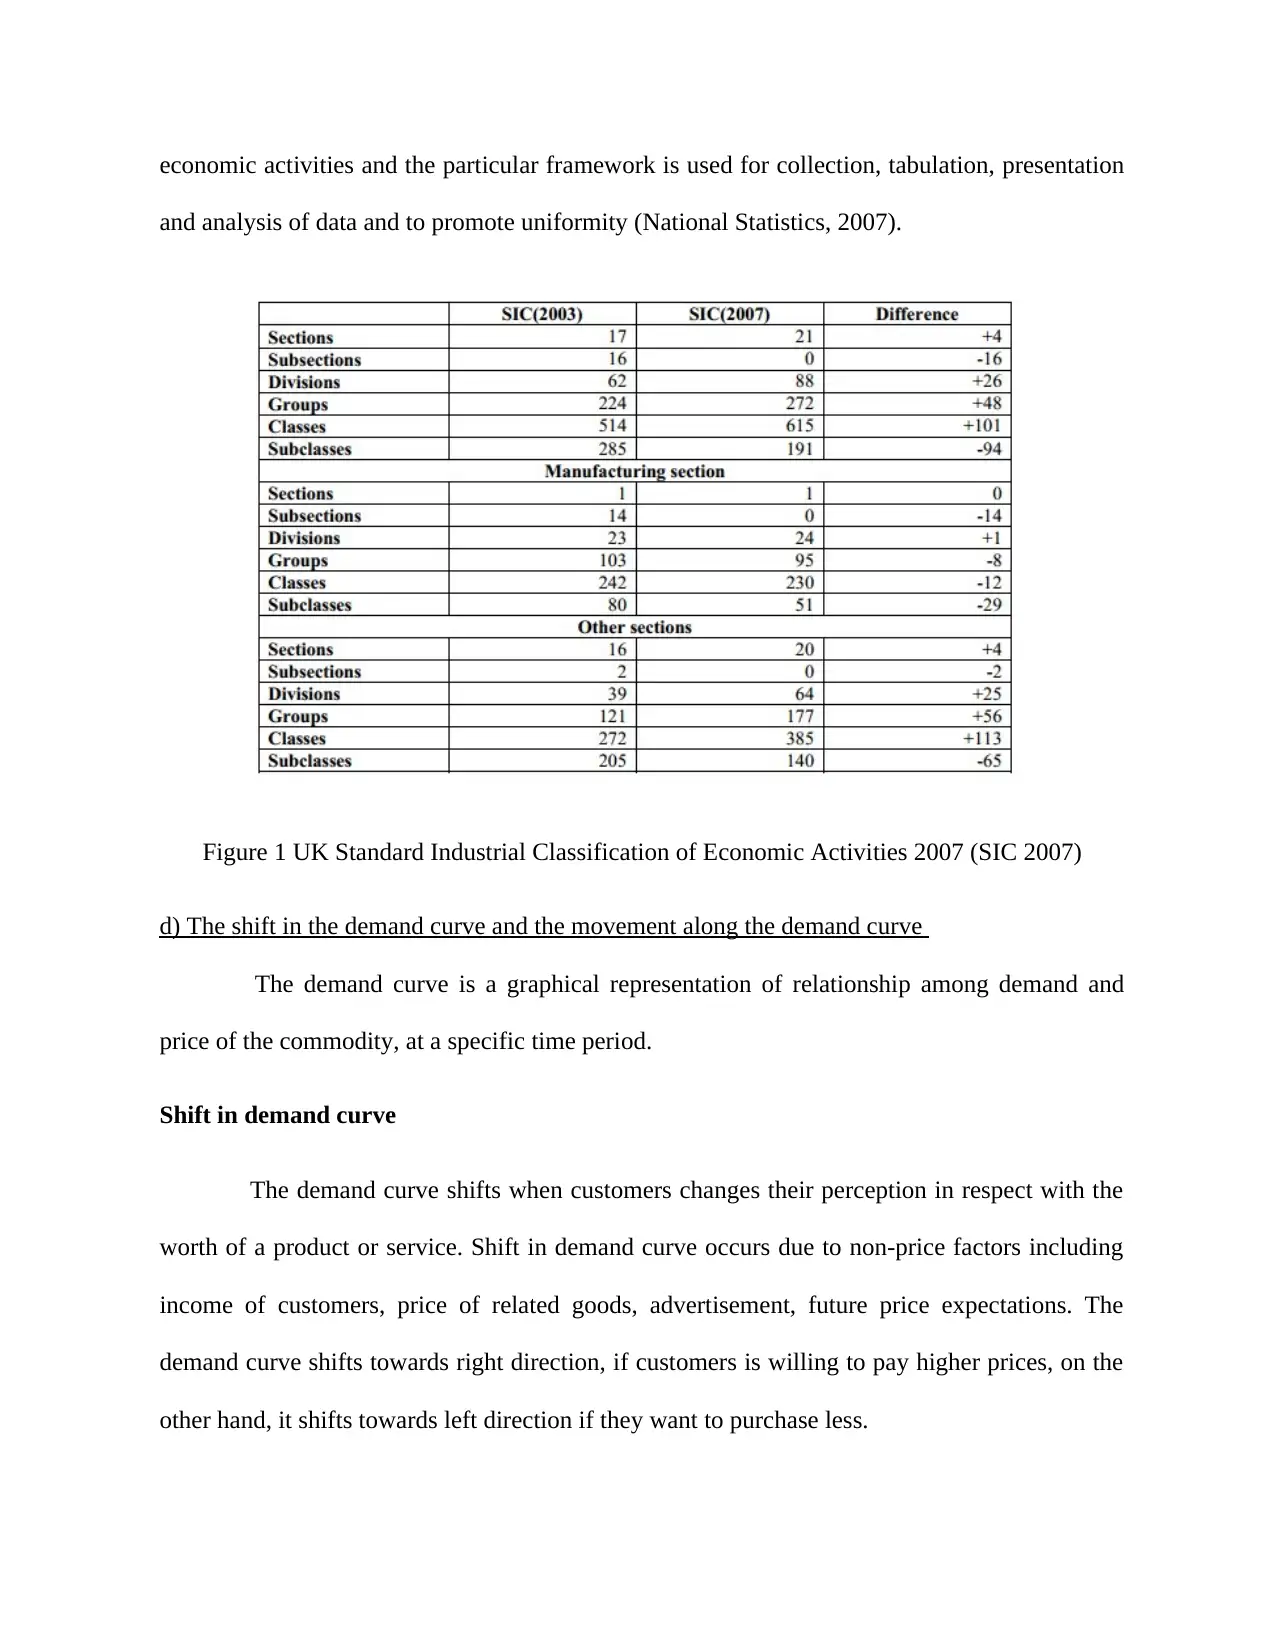
Shift in demand curve
The demand curve shifts when customers changes their perception in respect with the
worth of a product or service. Shift in demand curve occurs due to non-price factors including
income of customers, price of related goods, advertisement, future price expectations. The
demand curve shifts towards right direction, if customers is willing to pay higher prices, on the
other hand, it shifts towards left direction if they want to purchase less.
and analysis of data and to promote uniformity (National Statistics, 2007).
Figure 1 UK Standard Industrial Classification of Economic Activities 2007 (SIC 2007)
d) The shift in the demand curve and the movement along the demand curve
The demand curve is a graphical representation of relationship among demand and
price of the commodity, at a specific time period.
Shift in demand curve
The demand curve shifts when customers changes their perception in respect with the
worth of a product or service. Shift in demand curve occurs due to non-price factors including
income of customers, price of related goods, advertisement, future price expectations. The
demand curve shifts towards right direction, if customers is willing to pay higher prices, on the
other hand, it shifts towards left direction if they want to purchase less.
Paraphrase This Document
Need a fresh take? Get an instant paraphrase of this document with our AI Paraphraser
Figure 2 Shift in Demand Curve
(Source: Demand and Supply. 2014)
Movement along with demand curve
The movement in the demand curve occurs due to changes held in prices of the
products. For example: in case the prices of a product decreases the demand increases, however,
in case of price increase the demand decreases, hence, it could be noticed that curve itself does
not move; somewhat, there is movement along the curve.
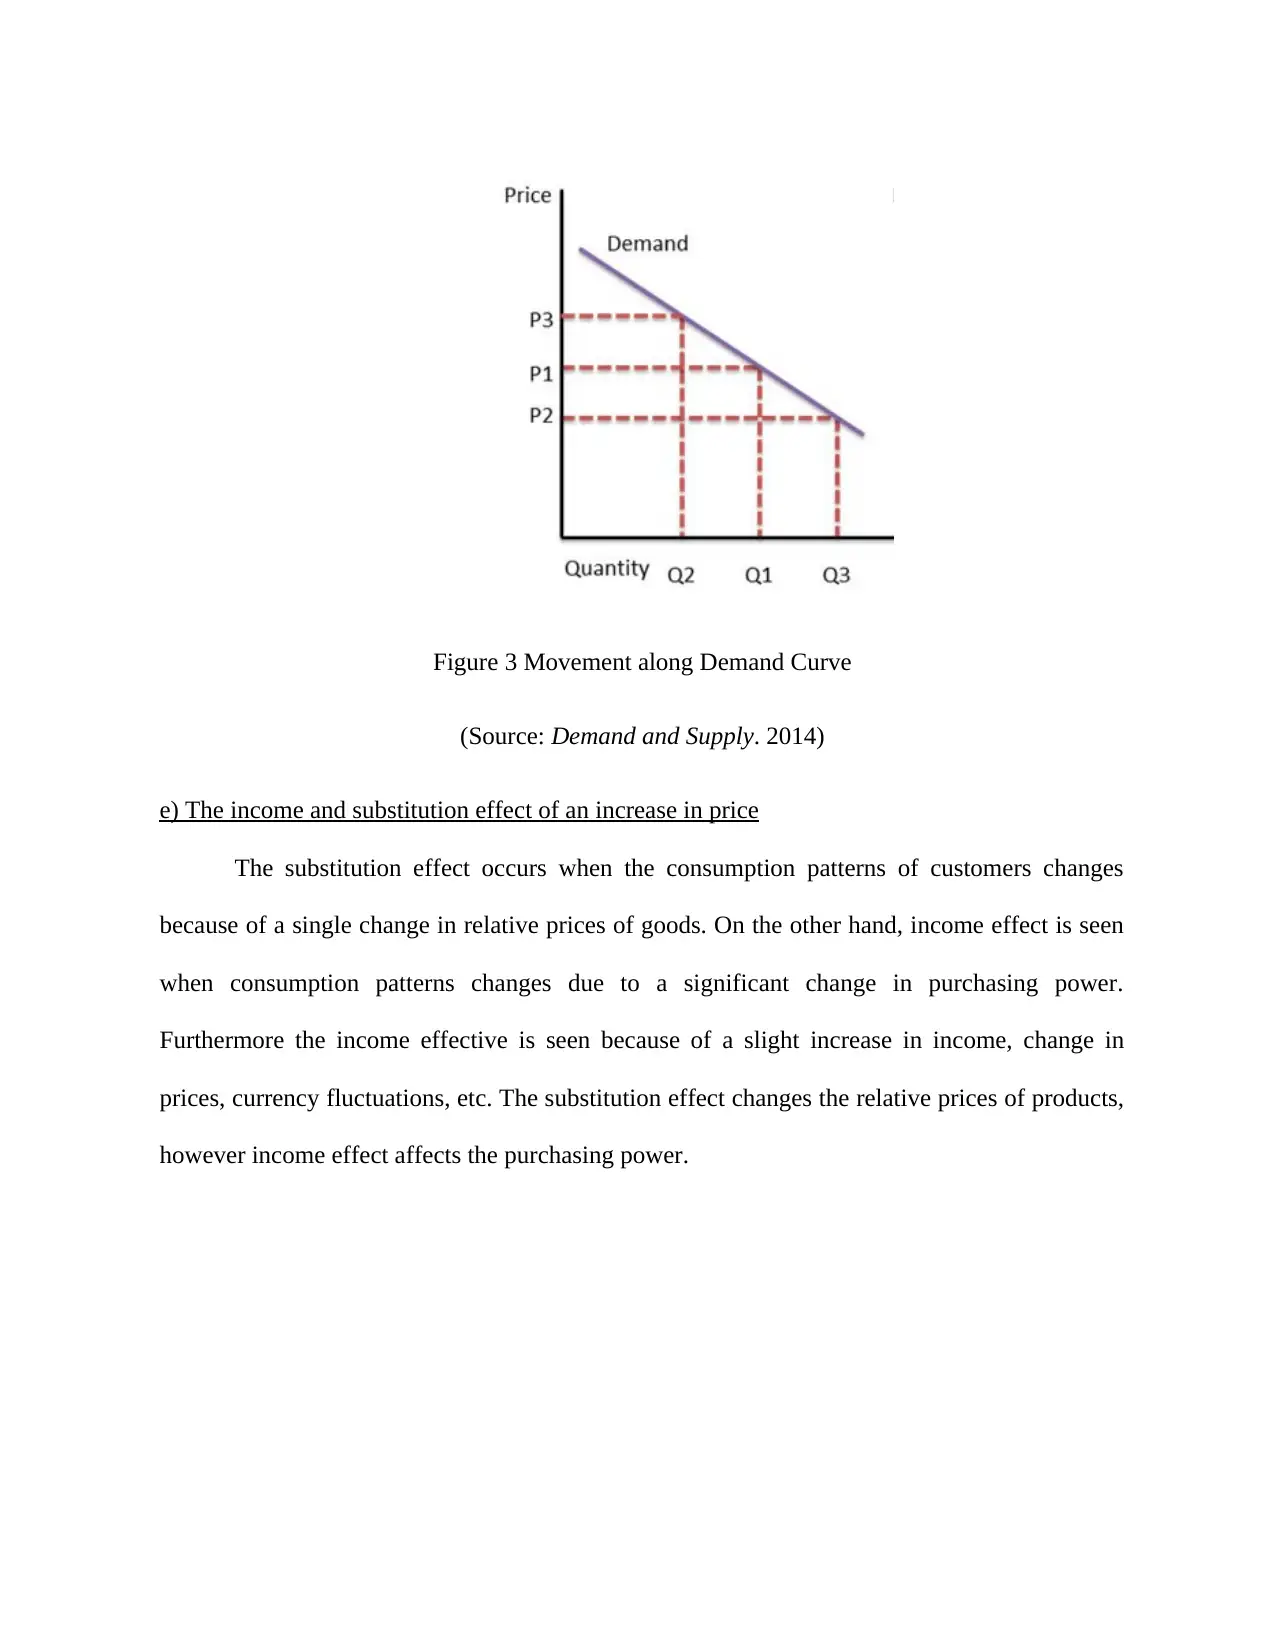
Figure 3 Movement along Demand Curve
(Source: Demand and Supply. 2014)
e) The income and substitution effect of an increase in price
The substitution effect occurs when the consumption patterns of customers changes
because of a single change in relative prices of goods. On the other hand, income effect is seen
when consumption patterns changes due to a significant change in purchasing power.
Furthermore the income effective is seen because of a slight increase in income, change in
prices, currency fluctuations, etc. The substitution effect changes the relative prices of products,
however income effect affects the purchasing power.
⊘ This is a preview!⊘
Do you want full access?
Subscribe today to unlock all pages.
Trusted by 1+ million students worldwide
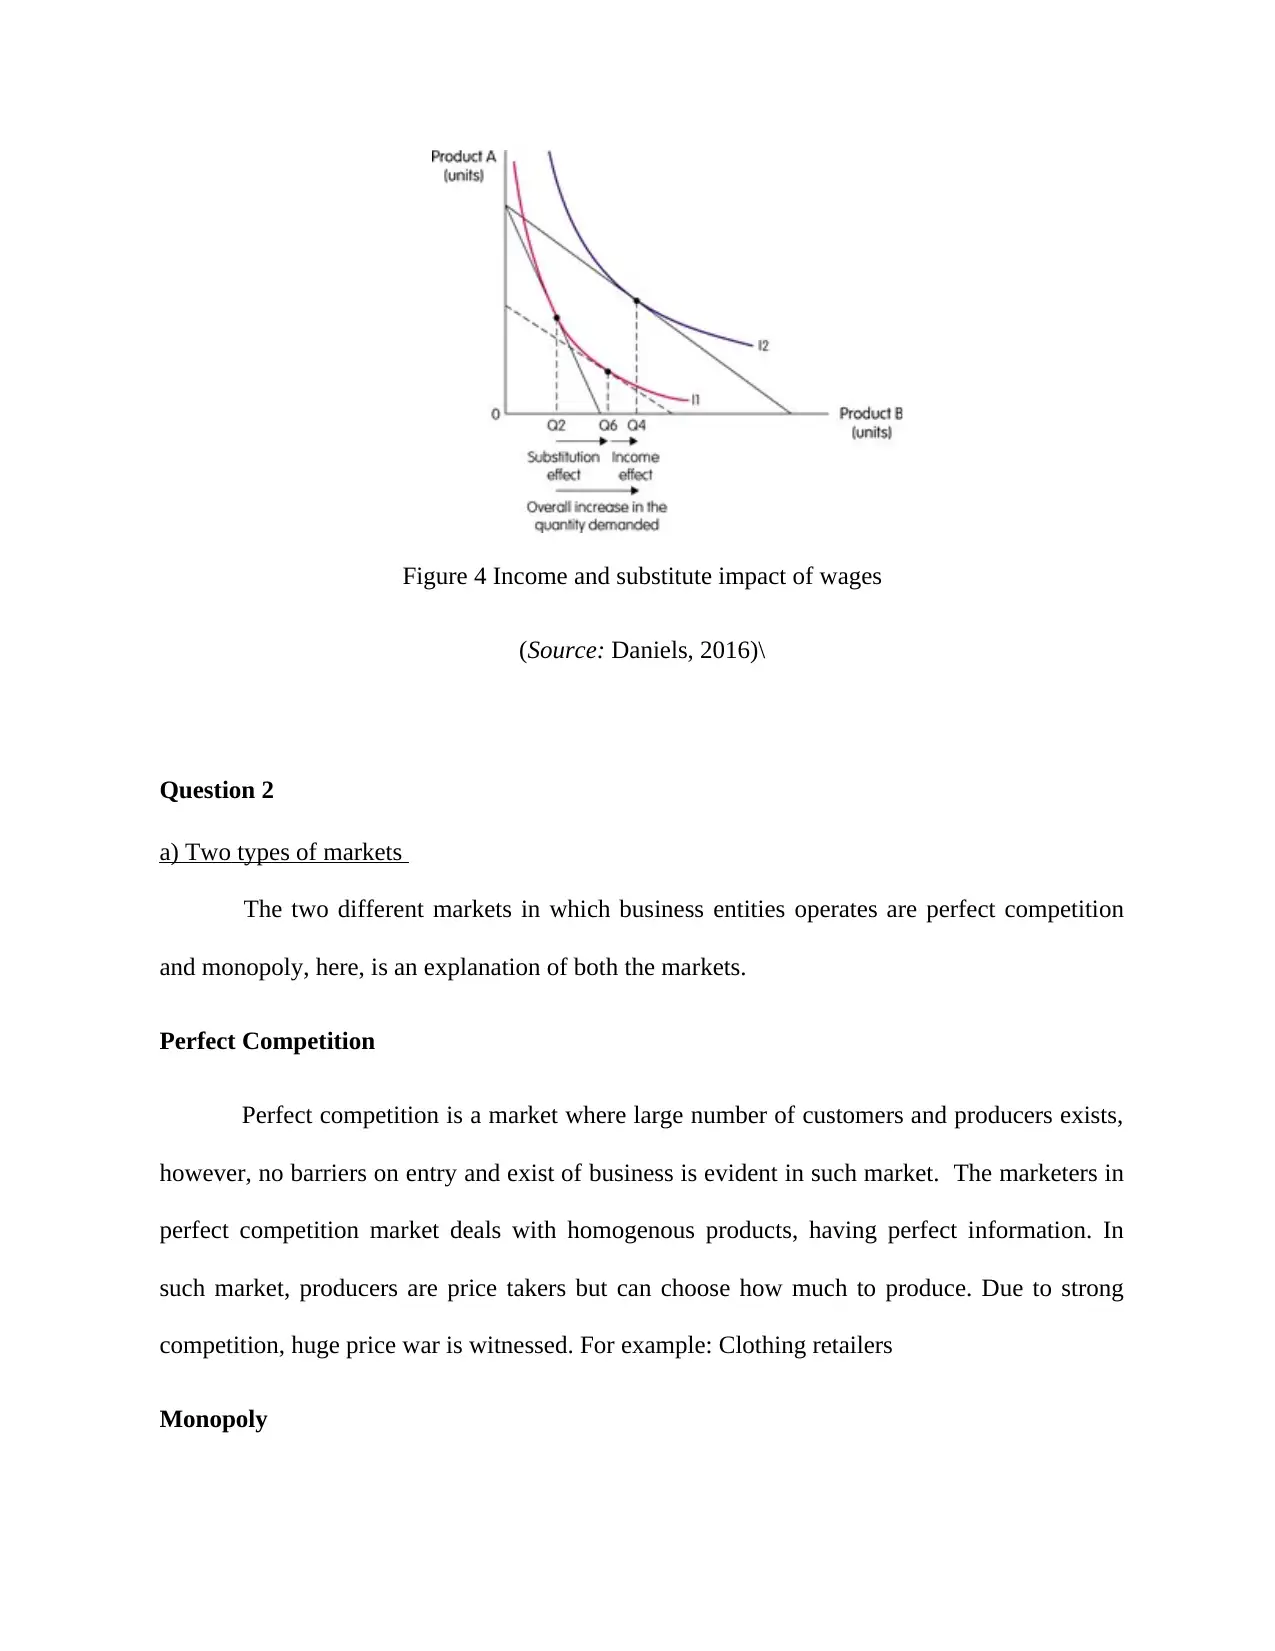
Figure 4 Income and substitute impact of wages
(Source: Daniels, 2016)\
Question 2
a) Two types of markets
The two different markets in which business entities operates are perfect competition
and monopoly, here, is an explanation of both the markets.
Perfect Competition
Perfect competition is a market where large number of customers and producers exists,
however, no barriers on entry and exist of business is evident in such market. The marketers in
perfect competition market deals with homogenous products, having perfect information. In
such market, producers are price takers but can choose how much to produce. Due to strong
competition, huge price war is witnessed. For example: Clothing retailers
Monopoly
Paraphrase This Document
Need a fresh take? Get an instant paraphrase of this document with our AI Paraphraser
The monopoly market is one in which there are large number of customers exists but only one
producer is there to serve market customers. The monopoly market does not have any
substitutive hence companies are free to charge prices. There are huge barriers to dissuade entry
of any potential competitors (Bjørnskov and Foss, 2010)
(b) Public good
Public good are defied as economic good which are used by people in common or
society at large. These good are non-rivalrous and non-excludable and are also known as
collective consumption goods. These services include broadcasting services, public water
supplies, street lighting for roads and motorways and other infrastructural services, national
defense services. In addition to that, sanitation, schools, police and fire protection are some
public goods which are consumed collectively. These kinds of good are provided by public
business owners and government, and in return taxes are charged by public (Fischbacher and
Gächter, 2010)
c) Three ways in which government intervenes in the market
Government intervenes are always argued by economist’s as it has been assumed that
such intervention causes an inefficient allocation of resources, however, government
intervention promotes greater equality overcome prolonged recessions, reduce unemployment
and overcome market failures. The one ways to overcome market failure is to spend on
education and trainings and from which occupational immobility can be reduced from the
market. On the other side, government can cut down the barriers of trade by promoting
favorable regulations (Stiglitz, 2010) The regulations can be reduced on trade so that business
can work more freely. The changes into indirect taxation is a major intervention which can be
taken by government by levying taxes on goods and services. By making changes in fiscal and
monetary policy, the government can reduces the level of spending and supply and demand of
money (Government intervention in the market, 2016).
d) Four key macroeconomic policy objectives that governments typically pursue
The major microeconomic policies are implemented through changing fiscal and
monetary policy. The major aim of government to design macroeconomic policy is to stabilize
the economy. Here is the list of four key macroeconomic policy objectives:
Improvements in productivity
Sustainable growth
High employment
Rising living standards
Along with this, other objectives to design macroeconomic policy are includes balancing
payments, equal distribution of income, environmental sustainability, attaining GDP growth
(Macroeconomic Objectives and Macro Stability. 2016).
e) The circular flow of income including the inner flow, withdrawals and injections
The connection among various activities of economy is seen with the help of circular
flow of income which further helps in computing national income and GDP (Gross Domestic
Product). The income (Y) flow in the economy through households nonetheless, people save
money aside from their incomes called savings (S) and even some part of income goes for
taxation (T). The withdrawals shows that increase in savings and imports reduces circular flow
of income. Other side, injections are the elements which are additions of investment,
government spending or exports. These activities significantly affects circular flow of income
⊘ This is a preview!⊘
Do you want full access?
Subscribe today to unlock all pages.
Trusted by 1+ million students worldwide
and output, hence, it increases. The equilibrium within the economy exists when the rate of
injections equals to the rate of withdrawals.
Question 3
a) Examples of each of the four major areas of finance
Finance is an integral part of business that helps in smooth operations for corporate
entity. There are five major areas of finance which helps of management of finances including
corporate Finance, financial Markets, financial Institutions, and Investments. All these areas of
finance are important in taking viable decisions about financing. Corporate finance includes
actions that are taken by companies to make viable financial decisions. This area of finance
includes budgeting, financial analysis as well as working capital management. Financial market
area is also called as money and capital market under which securities, bonds are traded.
Investment are the areas include range of option where business and individuals can invest and
gain returns. In addition to that, financial institutions plays main role as intermediaries between
corporate and savers.
b) Determinants of market interest rates including the various types of risk premiums
Interest rates are major element of monetary policy that are changes with the time to
facilitate economic stabilization. There are five major parts of interest rates which are called
major determinants of interest rates. These include real risk-free rate, Default-Risk Premium,
Liquidity Premium, Expected Inflation and Maturity Premium. The riskiness of securities is
evident through rate of return (Knight, 2012. ). Including this, risk premium includes Default
Risk Premium, Liquidity Premium, inflation premium and Maturity Premium. Inflation
premium facilitates investors to add real risk free rate of return because it affects interest rates.
The interest rate is reflected by maturity risk premium. The difference between interest rates on
Paraphrase This Document
Need a fresh take? Get an instant paraphrase of this document with our AI Paraphraser
US bond treasury and corporate bond is called as Default risk premium. Liquidity premium is
added to rate of security which is convertible into cash (De Jong and Driessen, 2012).
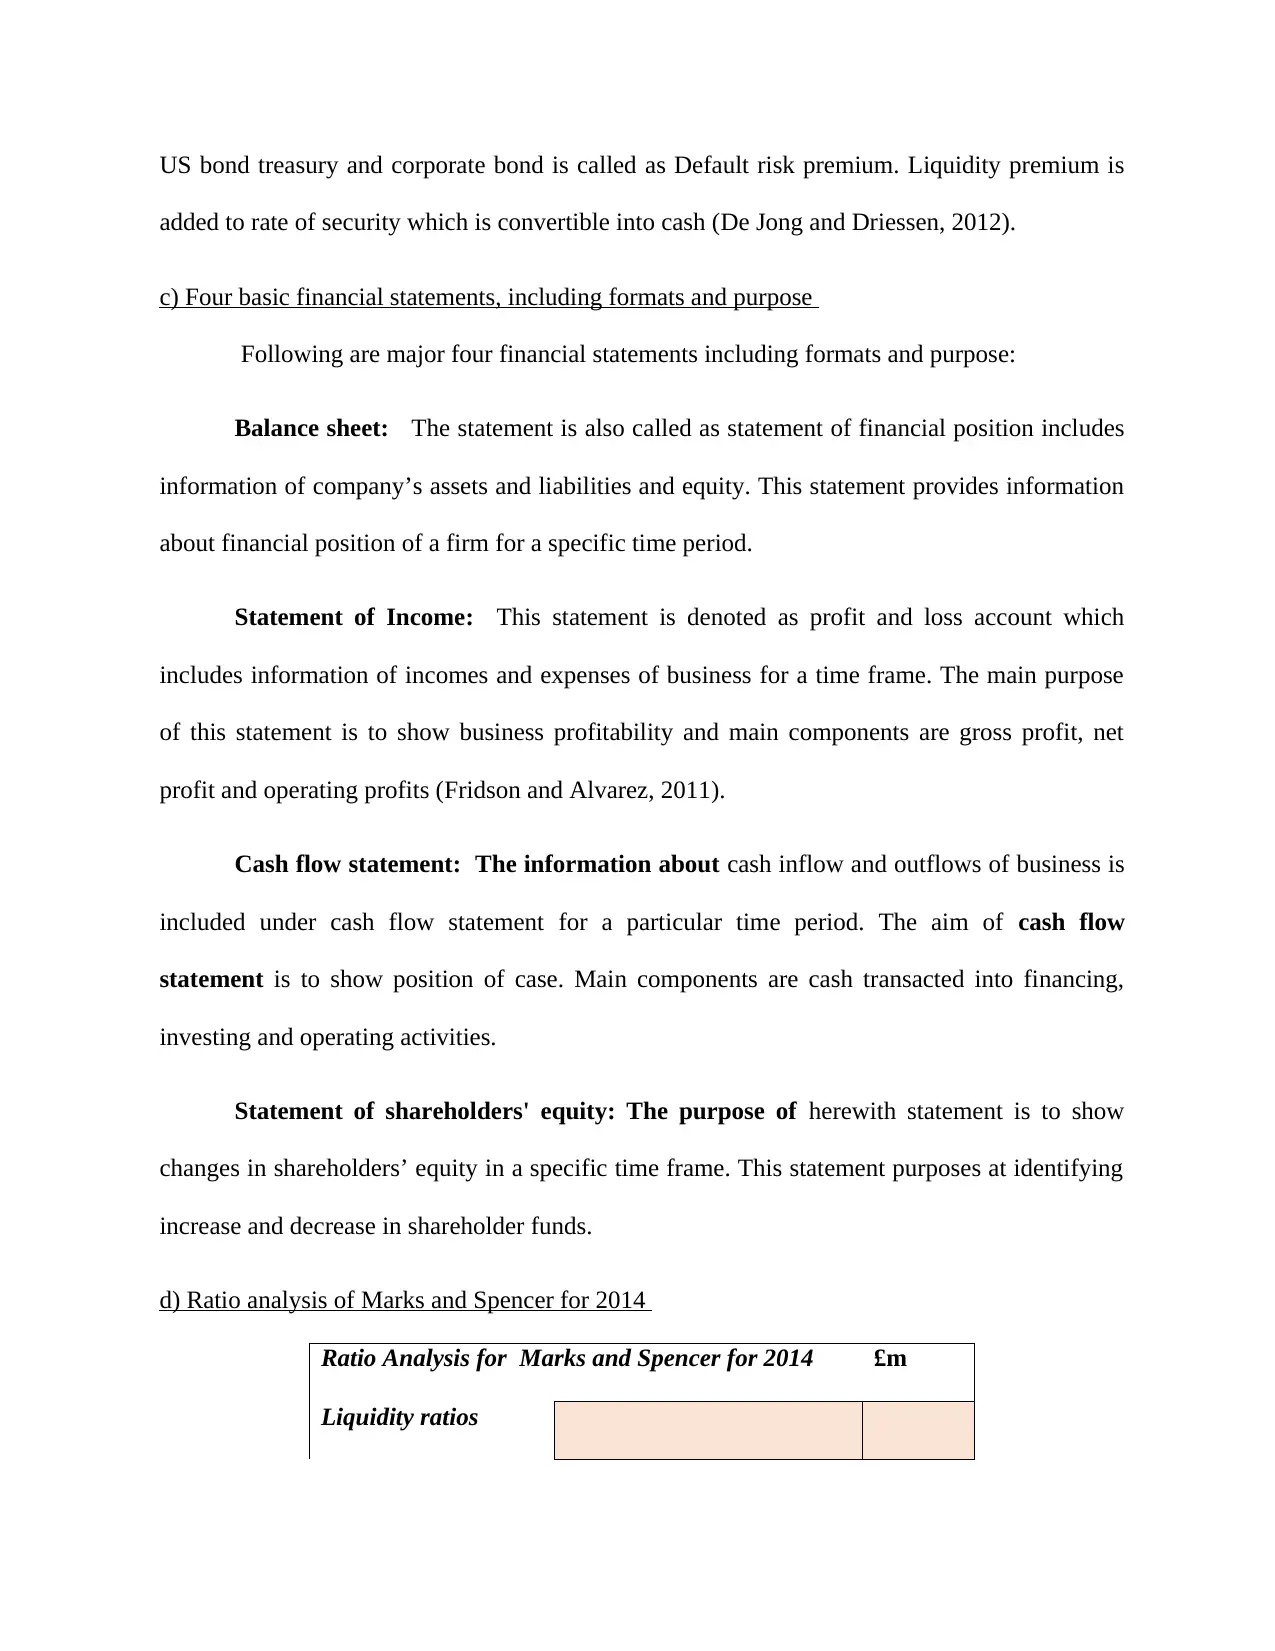
c) Four basic financial statements, including formats and purpose
Following are major four financial statements including formats and purpose:
Balance sheet: The statement is also called as statement of financial position includes
information of company’s assets and liabilities and equity. This statement provides information
about financial position of a firm for a specific time period.
Statement of Income: This statement is denoted as profit and loss account which
includes information of incomes and expenses of business for a time frame. The main purpose
of this statement is to show business profitability and main components are gross profit, net
profit and operating profits (Fridson and Alvarez, 2011).
Cash flow statement: The information about cash inflow and outflows of business is
included under cash flow statement for a particular time period. The aim of cash flow
statement is to show position of case. Main components are cash transacted into financing,
investing and operating activities.
Statement of shareholders' equity: The purpose of herewith statement is to show
changes in shareholders’ equity in a specific time frame. This statement purposes at identifying
increase and decrease in shareholder funds.
d) Ratio analysis of Marks and Spencer for 2014
Ratio Analysis for Marks and Spencer for 2014 £m
Liquidity ratios
added to rate of security which is convertible into cash (De Jong and Driessen, 2012).
c) Four basic financial statements, including formats and purpose
Following are major four financial statements including formats and purpose:
Balance sheet: The statement is also called as statement of financial position includes
information of company’s assets and liabilities and equity. This statement provides information
about financial position of a firm for a specific time period.
Statement of Income: This statement is denoted as profit and loss account which
includes information of incomes and expenses of business for a time frame. The main purpose
of this statement is to show business profitability and main components are gross profit, net
profit and operating profits (Fridson and Alvarez, 2011).
Cash flow statement: The information about cash inflow and outflows of business is
included under cash flow statement for a particular time period. The aim of cash flow
statement is to show position of case. Main components are cash transacted into financing,
investing and operating activities.
Statement of shareholders' equity: The purpose of herewith statement is to show
changes in shareholders’ equity in a specific time frame. This statement purposes at identifying
increase and decrease in shareholder funds.
d) Ratio analysis of Marks and Spencer for 2014
Ratio Analysis for Marks and Spencer for 2014 £m
Liquidity ratios
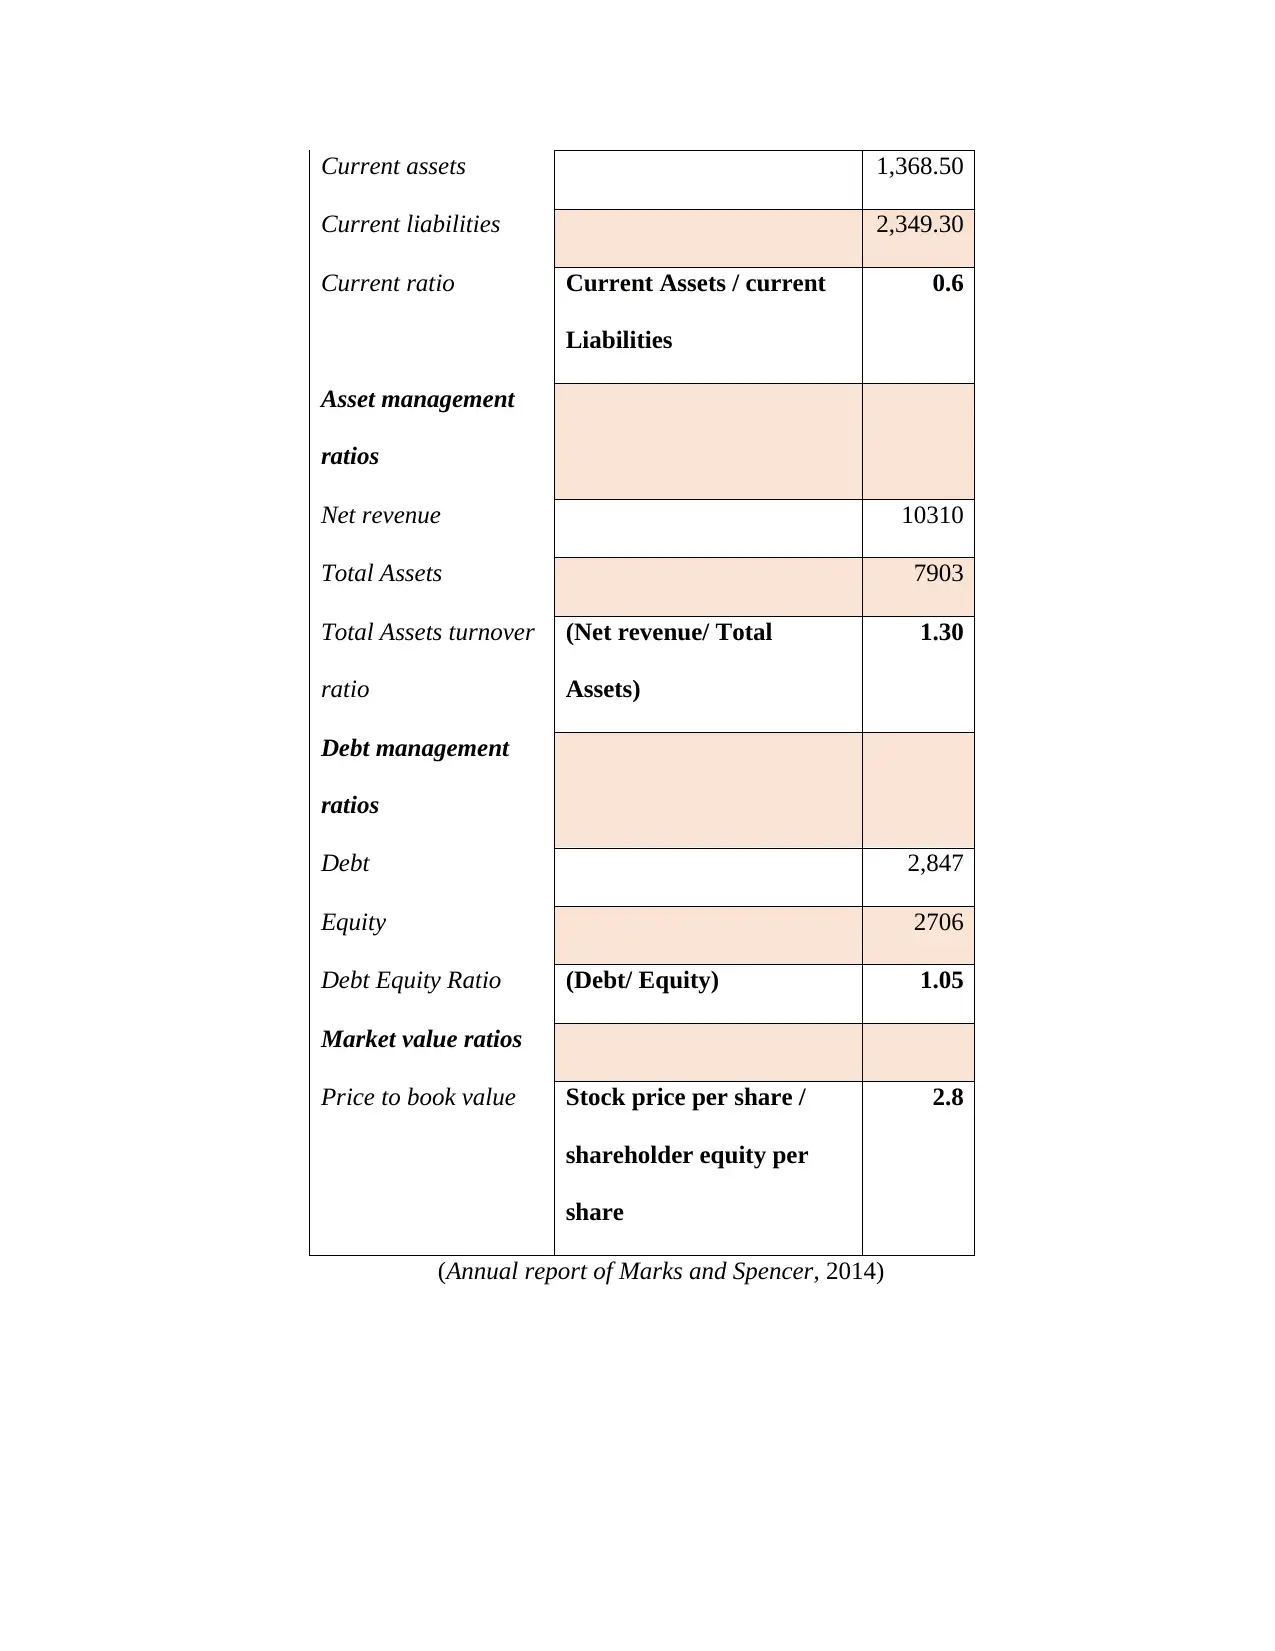
Current assets 1,368.50
Current liabilities 2,349.30
Current ratio Current Assets / current
Liabilities
0.6
Asset management
ratios
Net revenue 10310
Total Assets 7903
Total Assets turnover
ratio
(Net revenue/ Total
Assets)
1.30
Debt management
ratios
Debt 2,847
Equity 2706
Debt Equity Ratio (Debt/ Equity) 1.05
Market value ratios
Price to book value Stock price per share /
shareholder equity per
share
2.8
(Annual report of Marks and Spencer, 2014)
⊘ This is a preview!⊘
Do you want full access?
Subscribe today to unlock all pages.
Trusted by 1+ million students worldwide
1 out of 16
Related Documents


Your All-in-One AI-Powered Toolkit for Academic Success.
+13062052269
info@desklib.com
Available 24*7 on WhatsApp / Email
![[object Object]](/_next/static/media/star-bottom.7253800d.svg)
Unlock your academic potential
Copyright © 2020–2026 A2Z Services. All Rights Reserved. Developed and managed by ZUCOL.