Impact of Financial Awareness on Anxiety for Financial Decision Making - Desklib
VerifiedAdded on 2023/06/07
|46
|4032
|476
AI Summary
This study aims to identify the impact of financial awareness on anxiety for financial decision making. The study design chosen is quantitative research, and the inclusion criteria for participants is a simple random technique. The variables collected include financial awareness, anxiety, stable income, prevailing working environment, and ability to pay debts. The measurement scale applied is pulse rate, and the suitable descriptive statistic and graph are presented in Table 1. The correlation between social media time and IQ level is negative. The correlation between work status and pet ownership is low. The data for Statistics Anxiety is not normally distributed.
Contribute Materials
Your contribution can guide someone’s learning journey. Share your
documents today.
Data Analysis & Research
Design Evaluation
Design Evaluation
Secure Best Marks with AI Grader
Need help grading? Try our AI Grader for instant feedback on your assignments.
TABLE OF CONTENTS
QUESTION 1..................................................................................................................................2
QUESTION 2..................................................................................................................................4
a)..................................................................................................................................................4
c)..................................................................................................................................................7
d).................................................................................................................................................9
e)..................................................................................................................................................9
QUESTION 3................................................................................................................................10
QUESTION 4................................................................................................................................12
QUESTION 5................................................................................................................................13
REFERENCES..............................................................................................................................15
Output............................................................................................................................................16
1
QUESTION 1
Topic: Impact of financial awareness in creating anxiety for financial decision making
What is your Research
Question?
(1 mark)
What is the impact of financial awareness in creating anxiety for
financial decision making?
What is the aim of your
proposed study? What
benefit/s it will have?
(2 marks)
The main of the current study is to pay attention on identifying
impact of financial awareness in creating anxiety for financial
decision making. This will benefit in identifying the importance of
significant level of processing by gaining awareness about the
highlighted subject matter. This will be permit in increasing the
awareness.Which study design do you
choose for your study and
why?
(2 marks)
Quantitative research design will be taken into the consideration
for the purpose of having effective accomplishing of the aim.
What will be the inclusion
criteria for your study
participants?
Which sampling method
you will choose? and why?
How will you recruit
Simple random technique will be taken into the consideration for
the purpose of analysing the topic in turn significant information to
get the accurate results by getting the corrective group of
population who have rational thinking.
The recruiting procedure will be done on the basis of choosing the
people from the social media platform.What are your independent
and dependent variables?
What are three other
factors/variables you will
collect information about
and why? (3.5 marks)
Note: Must be a mix of both
data types.
Stress is the dependent variable is anxiety and independent is
financial awareness. The other factor for which the data will be
collected is having the significant insights about the financial
decision making.
The other variable which are require to be taken into the
consideration is having the availability of stable income,
prevailing working environment and effective ability to pay debts
2
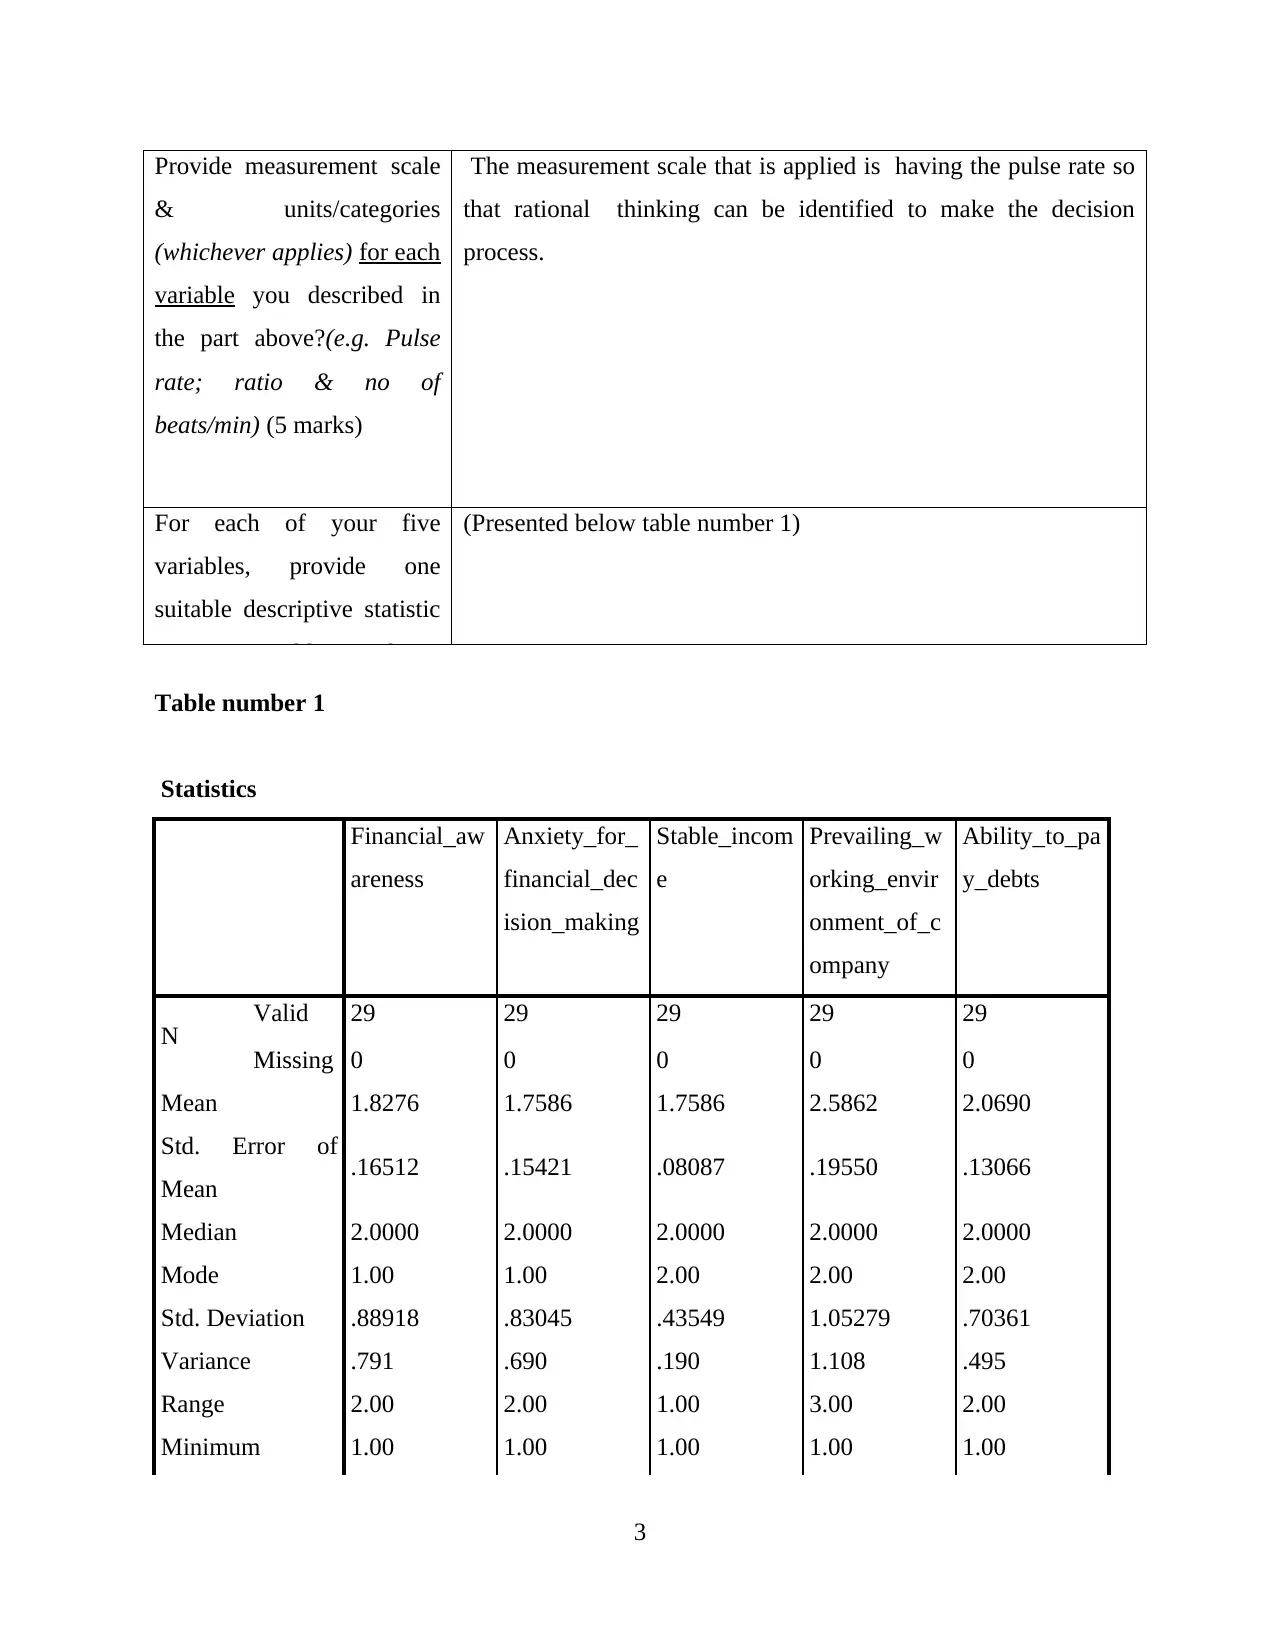
Provide measurement scale
& units/categories
(whichever applies) for each
variable you described in
the part above?(e.g. Pulse
rate; ratio & no of
beats/min) (5 marks)
The measurement scale that is applied is having the pulse rate so
that rational thinking can be identified to make the decision
process.
For each of your five
variables, provide one
suitable descriptive statistic
& one suitable graph (5
(Presented below table number 1)
Table number 1
Statistics
Financial_aw
areness
Anxiety_for_
financial_dec
ision_making
Stable_incom
e
Prevailing_w
orking_envir
onment_of_c
ompany
Ability_to_pa
y_debts
N Valid 29 29 29 29 29
Missing 0 0 0 0 0
Mean 1.8276 1.7586 1.7586 2.5862 2.0690
Std. Error of
Mean .16512 .15421 .08087 .19550 .13066
Median 2.0000 2.0000 2.0000 2.0000 2.0000
Mode 1.00 1.00 2.00 2.00 2.00
Std. Deviation .88918 .83045 .43549 1.05279 .70361
Variance .791 .690 .190 1.108 .495
Range 2.00 2.00 1.00 3.00 2.00
Minimum 1.00 1.00 1.00 1.00 1.00
3
Secure Best Marks with AI Grader
Need help grading? Try our AI Grader for instant feedback on your assignments.
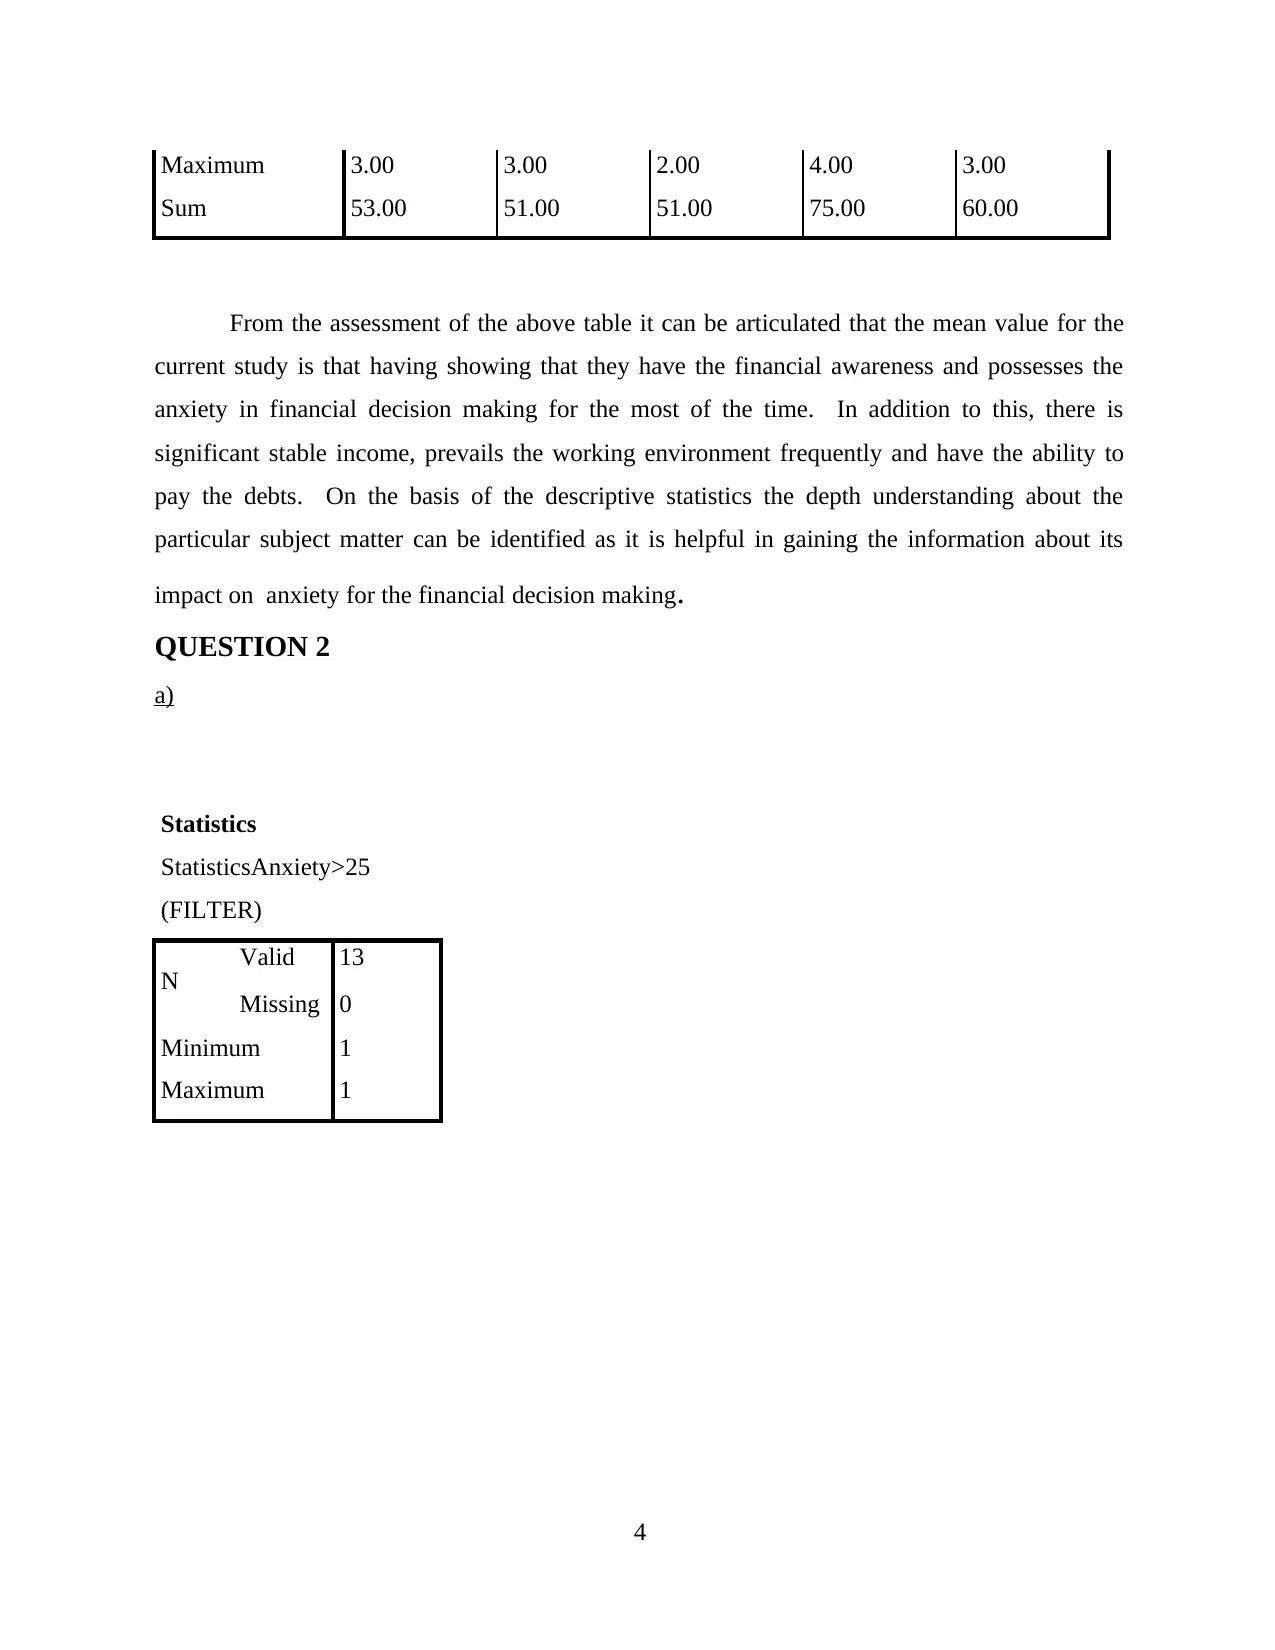
Maximum 3.00 3.00 2.00 4.00 3.00
Sum 53.00 51.00 51.00 75.00 60.00
From the assessment of the above table it can be articulated that the mean value for the
current study is that having showing that they have the financial awareness and possesses the
anxiety in financial decision making for the most of the time. In addition to this, there is
significant stable income, prevails the working environment frequently and have the ability to
pay the debts. On the basis of the descriptive statistics the depth understanding about the
particular subject matter can be identified as it is helpful in gaining the information about its
impact on anxiety for the financial decision making.
QUESTION 2
a)
Statistics
StatisticsAnxiety>25
(FILTER)
N Valid 13
Missing 0
Minimum 1
Maximum 1
4
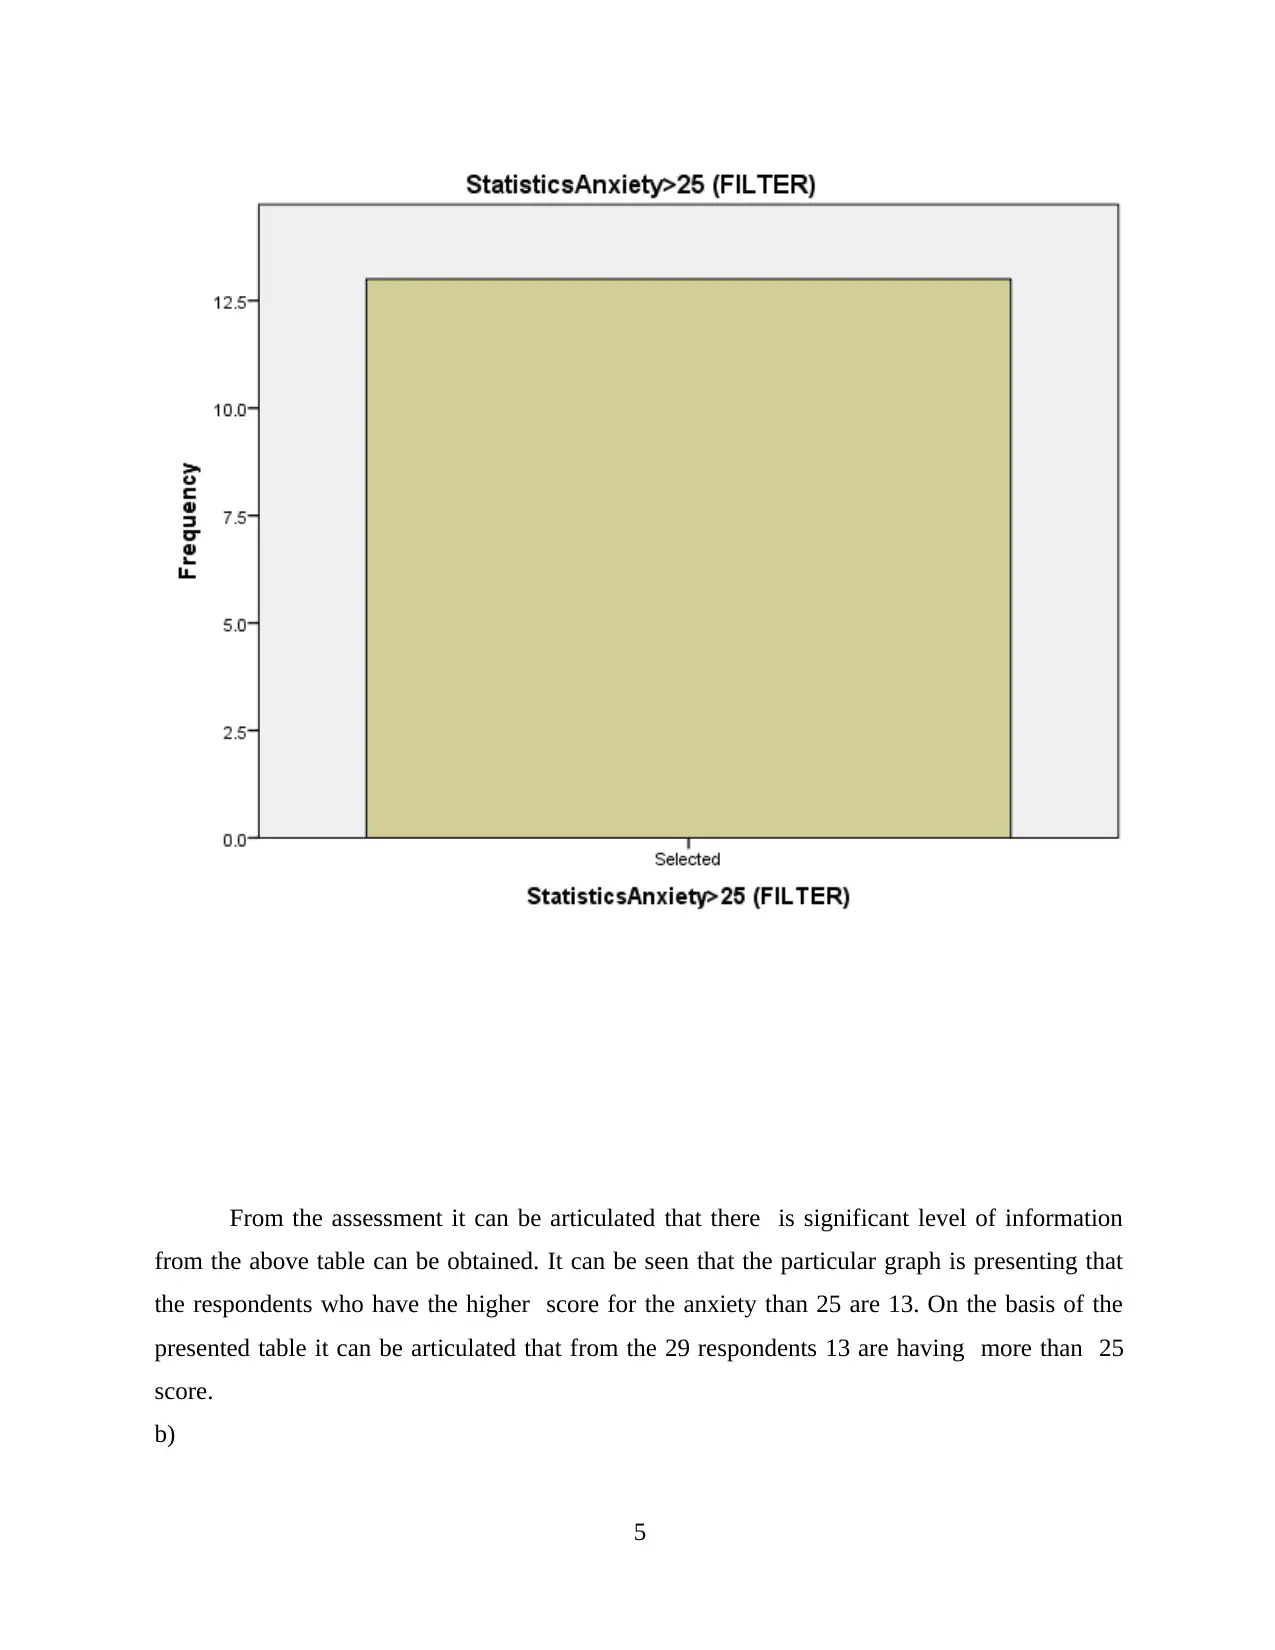
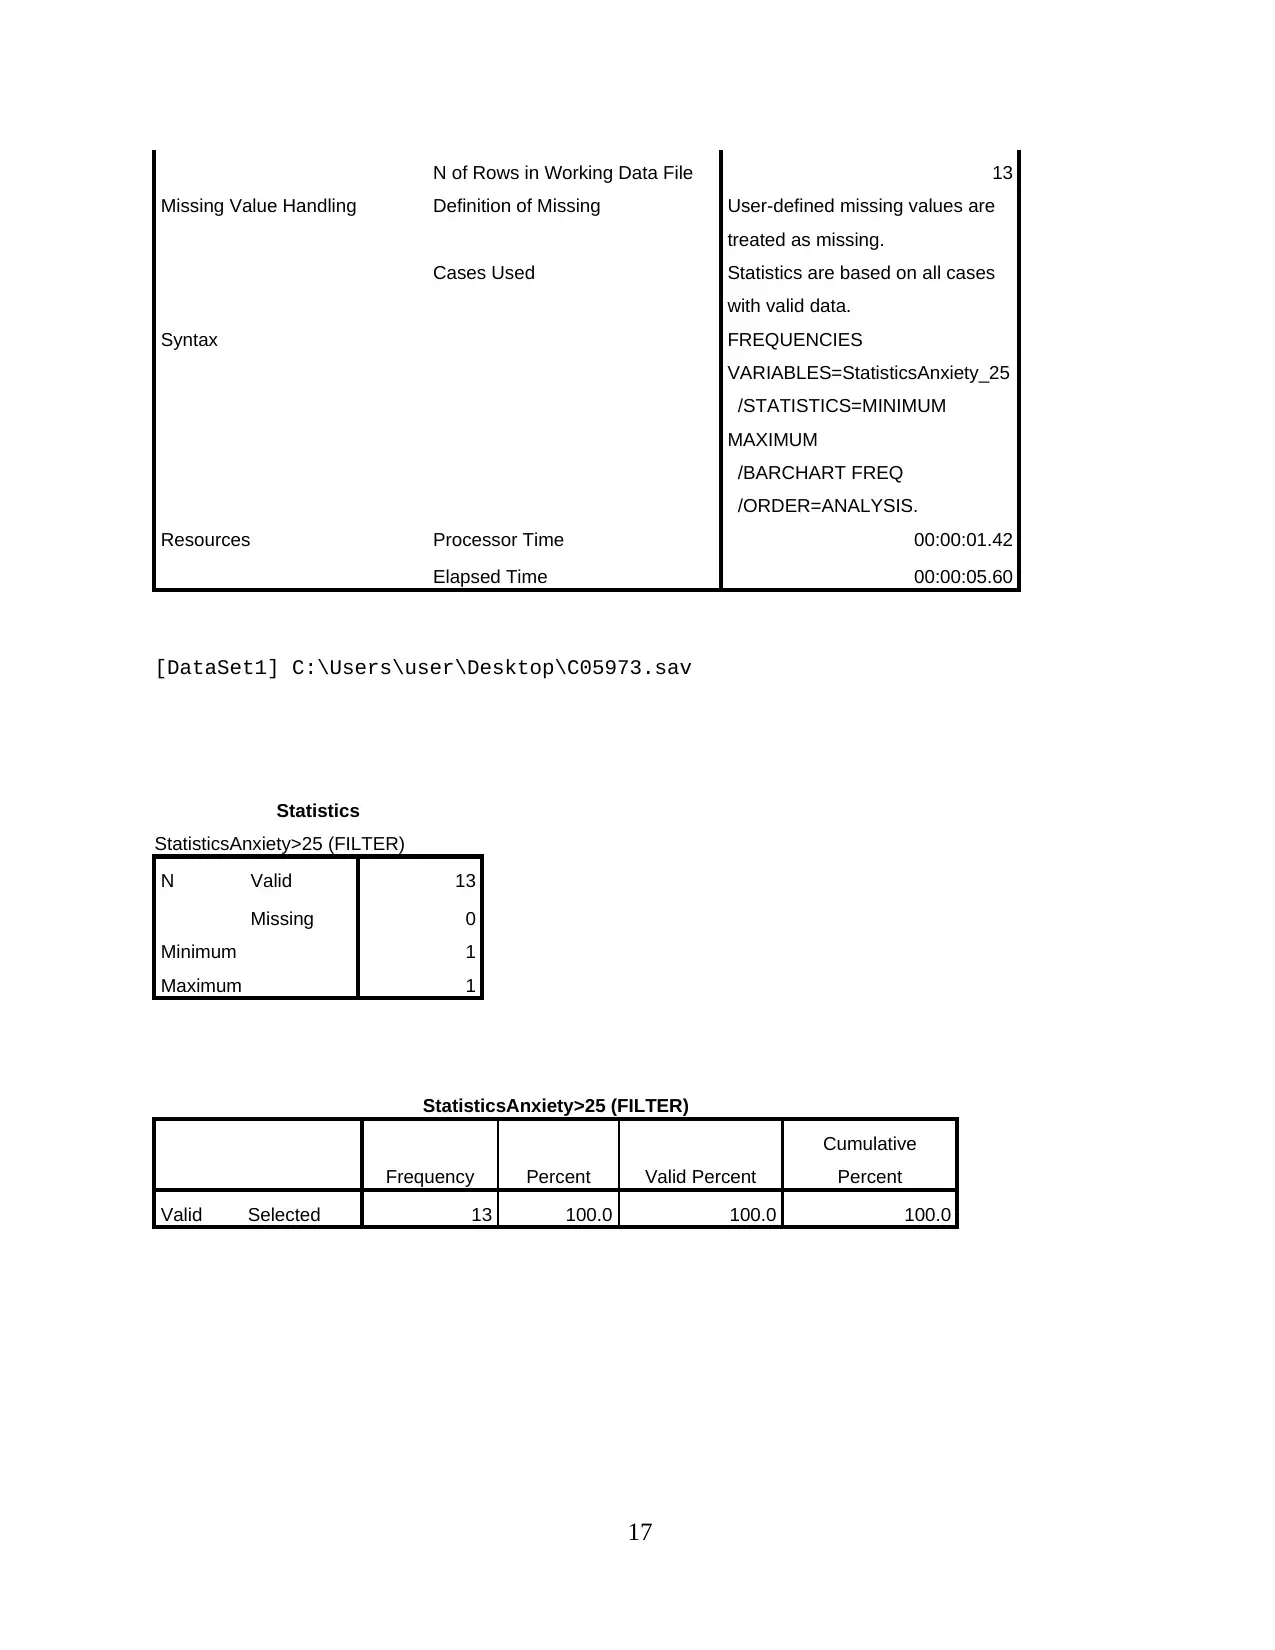
From the assessment it can be articulated that there is significant level of information
from the above table can be obtained. It can be seen that the particular graph is presenting that
the respondents who have the higher score for the anxiety than 25 are 13. On the basis of the
presented table it can be articulated that from the 29 respondents 13 are having more than 25
score.
b)
5
from the above table can be obtained. It can be seen that the particular graph is presenting that
the respondents who have the higher score for the anxiety than 25 are 13. On the basis of the
presented table it can be articulated that from the 29 respondents 13 are having more than 25
score.
b)
5
Correlations
IQ socialmediati
me
IQ
Pearson
Correlation 1 -.134
Sig. (2-tailed) .664
N 13 13
socialmediatim
e
Pearson
Correlation -.134 1
Sig. (2-tailed) .664
N 13 13
6
IQ socialmediati
me
IQ
Pearson
Correlation 1 -.134
Sig. (2-tailed) .664
N 13 13
socialmediatim
e
Pearson
Correlation -.134 1
Sig. (2-tailed) .664
N 13 13
6
Paraphrase This Document
Need a fresh take? Get an instant paraphrase of this document with our AI Paraphraser
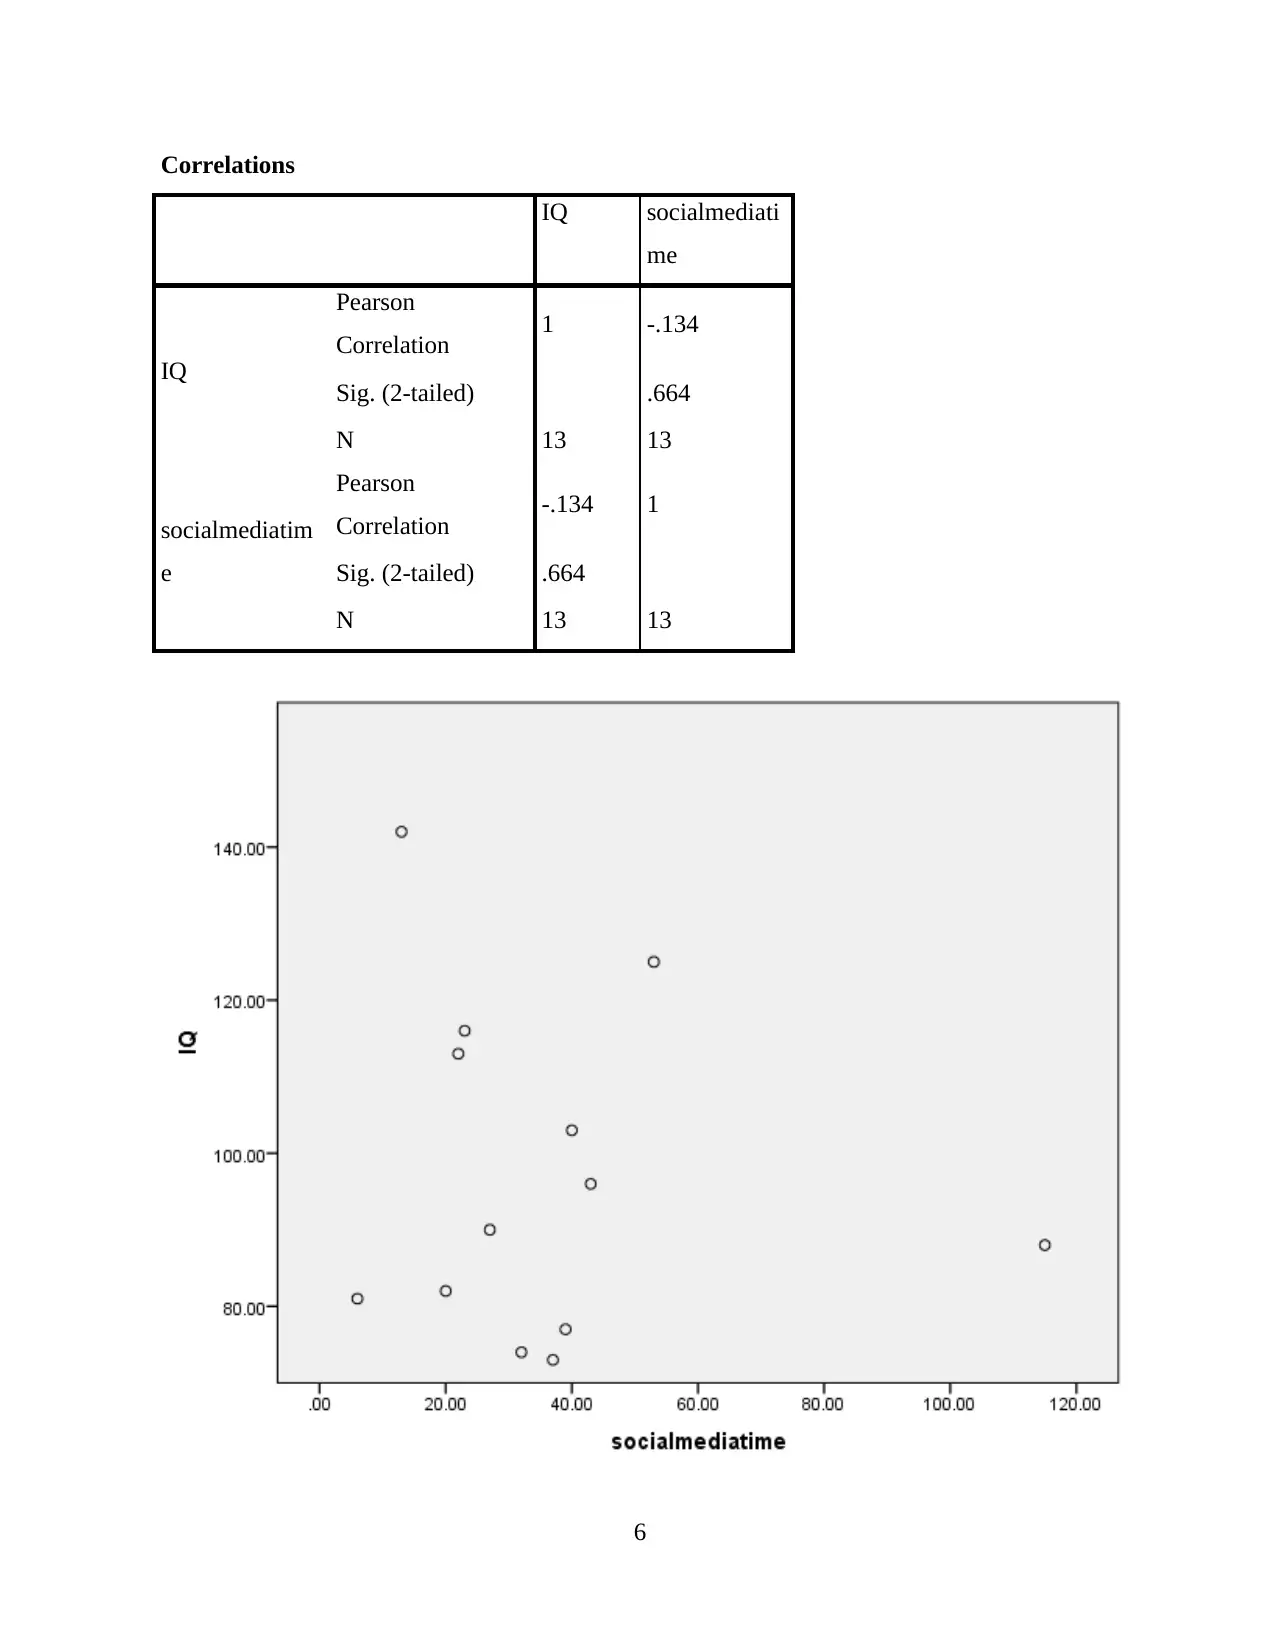
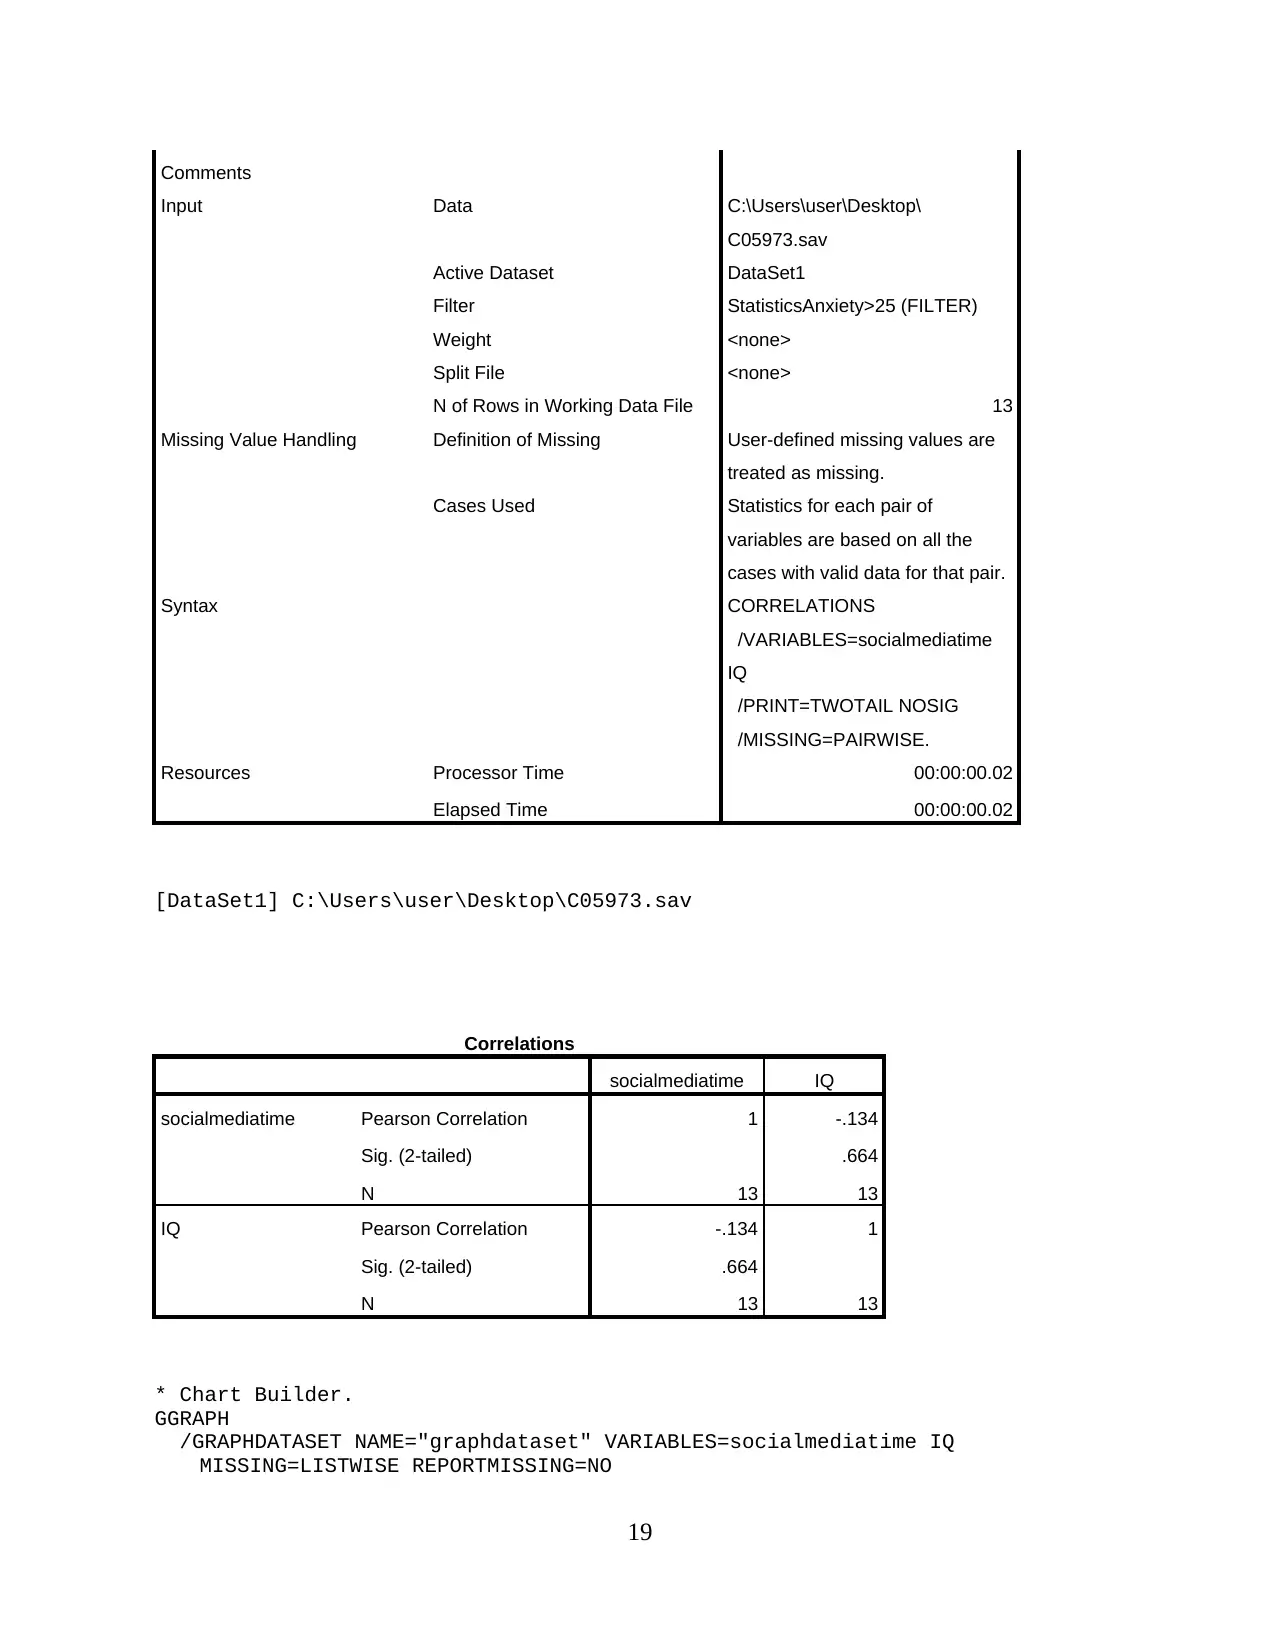
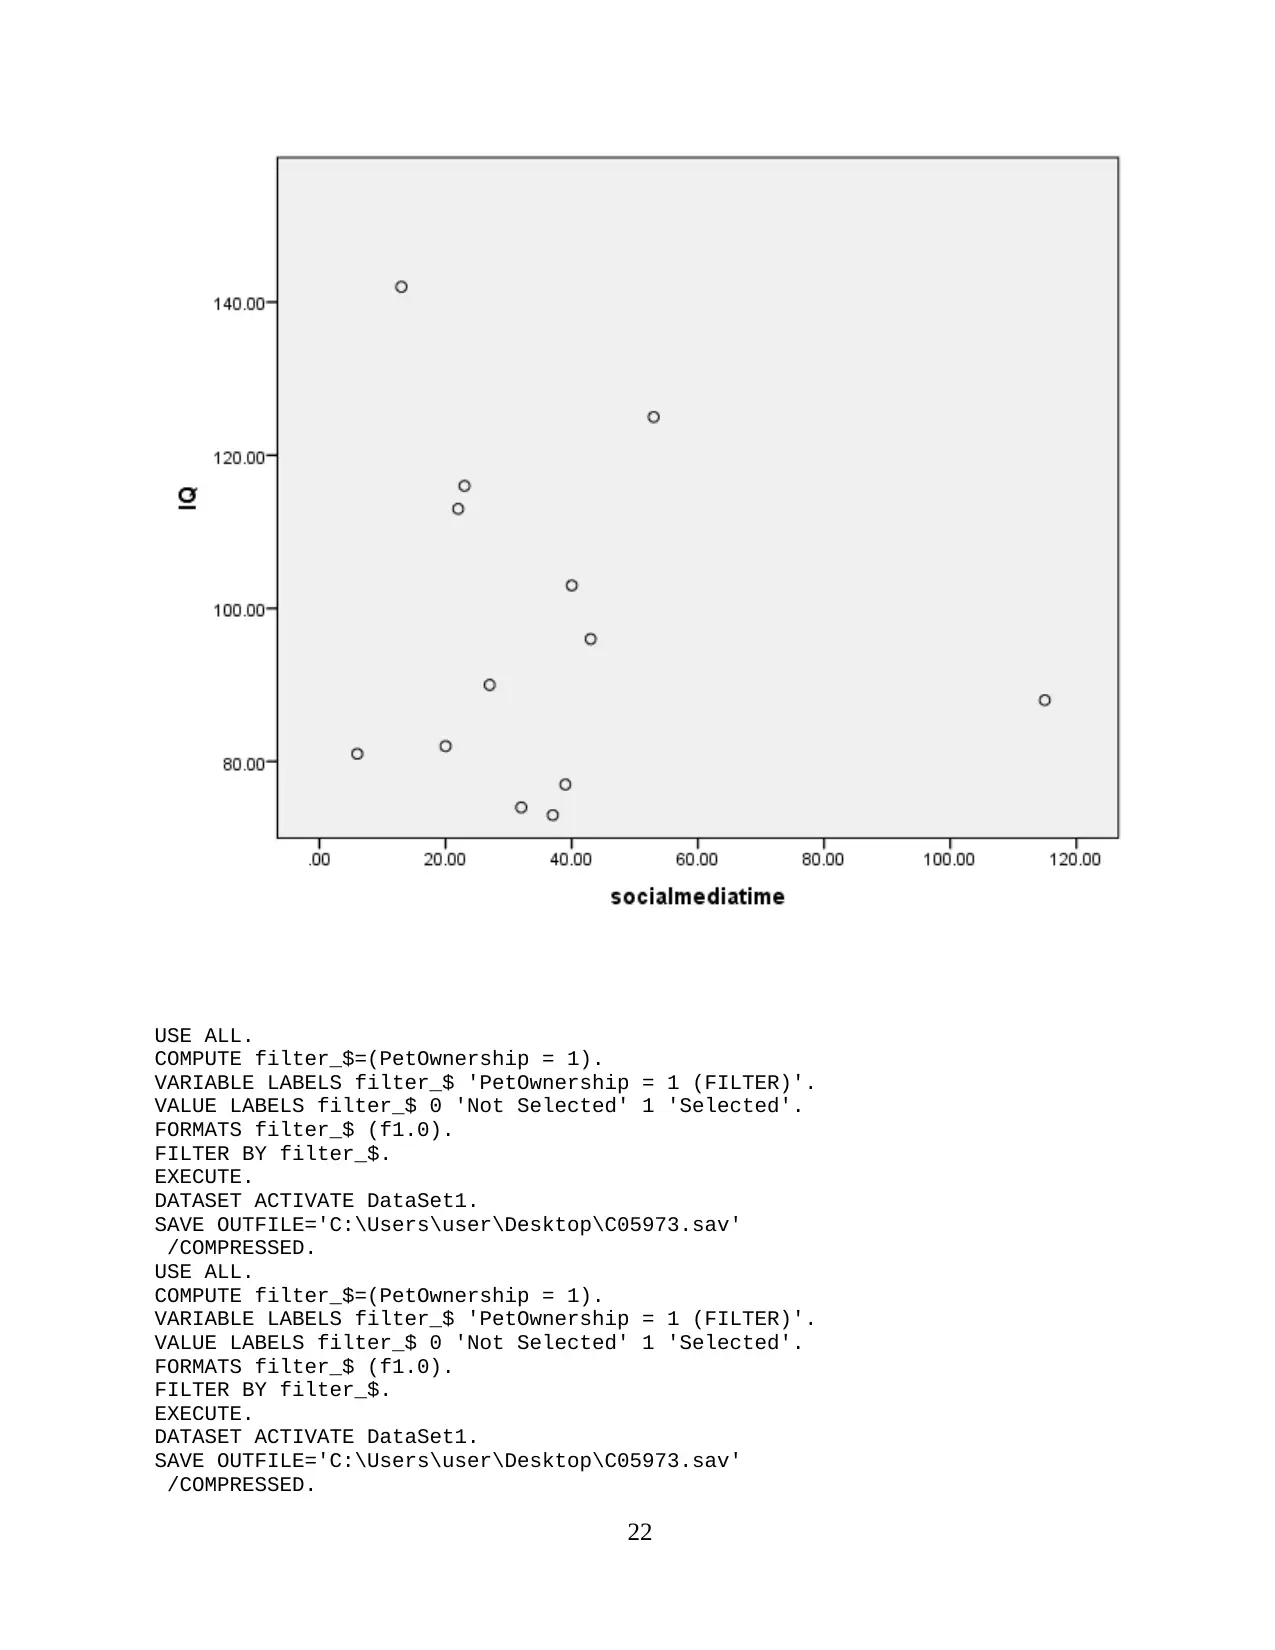
From the analysis it can be said that there is negative correlation is found between the
specified two variables which are IQ and social media time. It can be specified that there is
negative relationship is found between the specified variables like social media time spend and
IQ level. On the basis of this it can be articulated that there is time spend on social media does
not decide level of the IQ a person is having.
c)
Statistics
PetOwnership = 1
(FILTER)
N Valid 14
Missing 0
Mean 1.00
Median 1.00
Mode 1
Variance .000
Minimum 1
Maximum 1
Sum 14
PetOwnership = 1 (FILTER)
Frequency Percent Valid
Percent
Cumulative
Percent
Valid Not
Selected
15 51.7 51.7 51.7
7
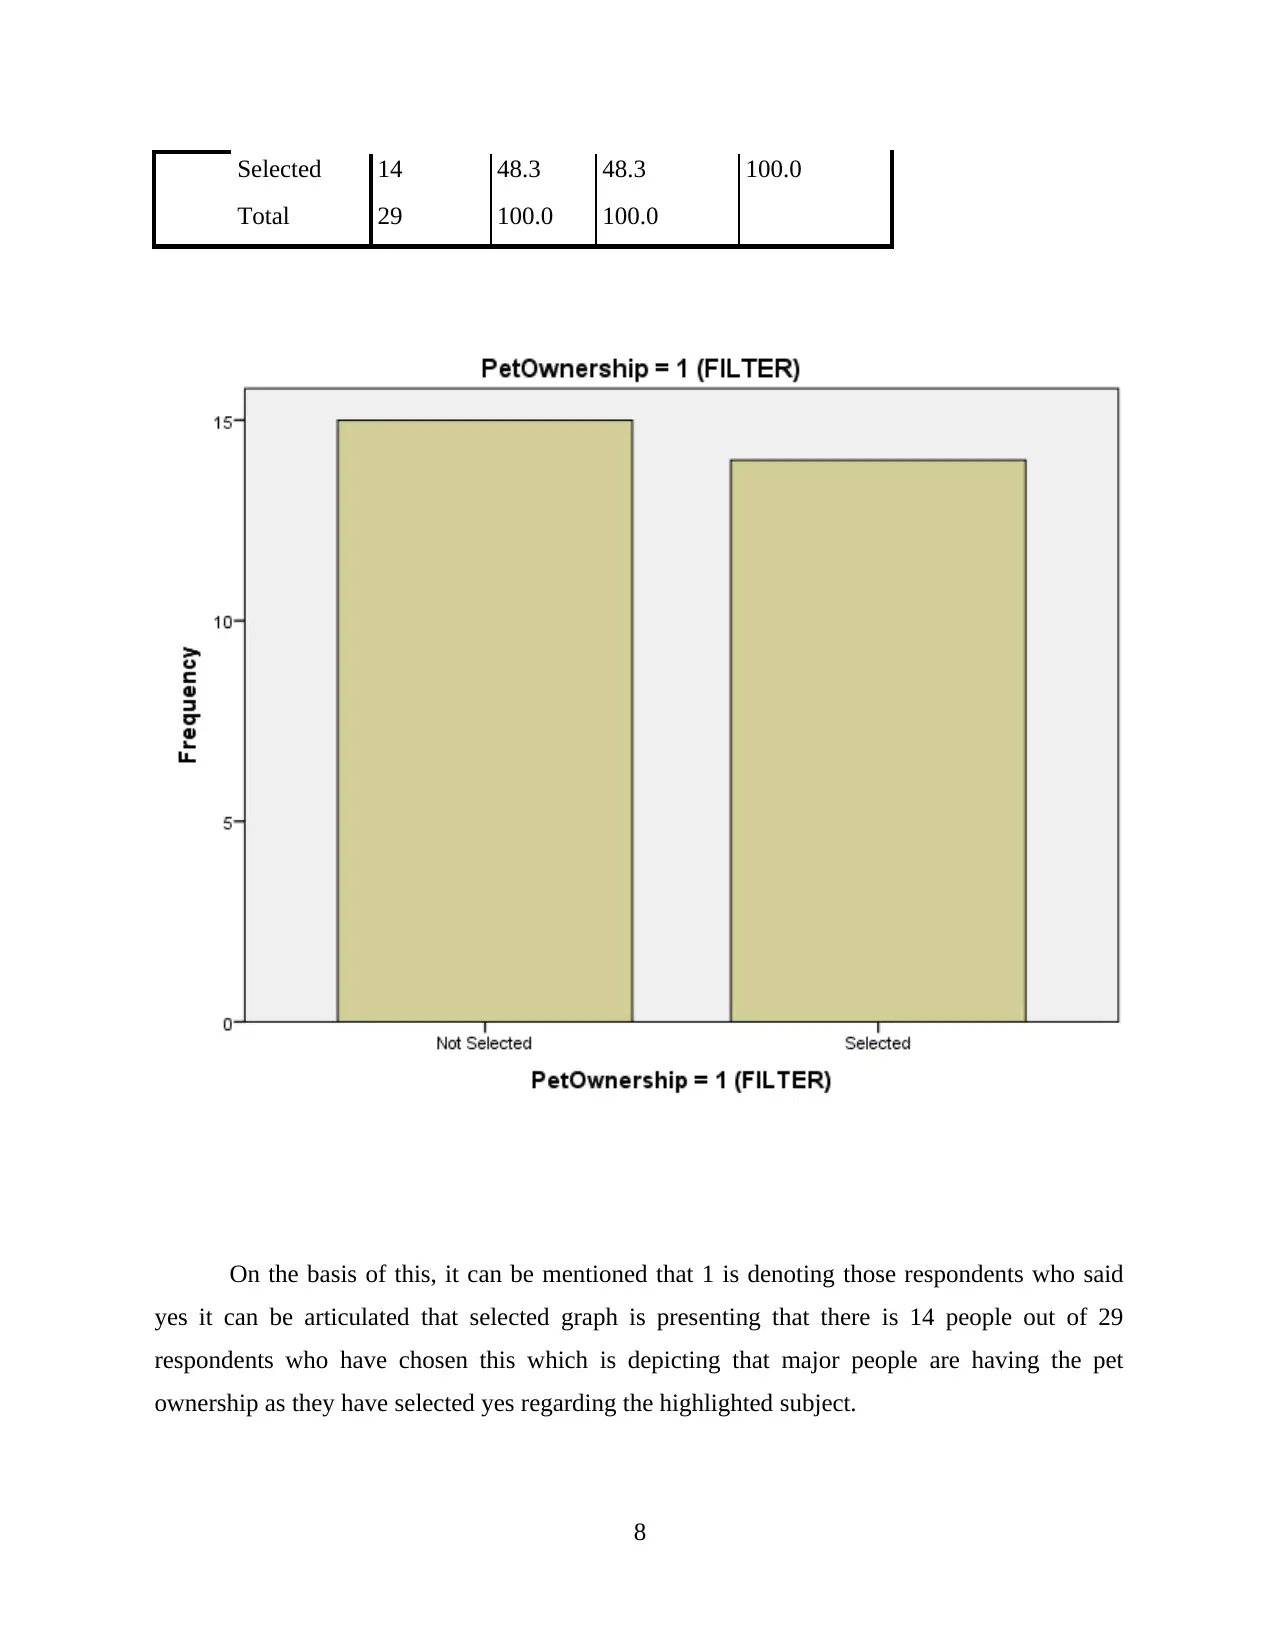
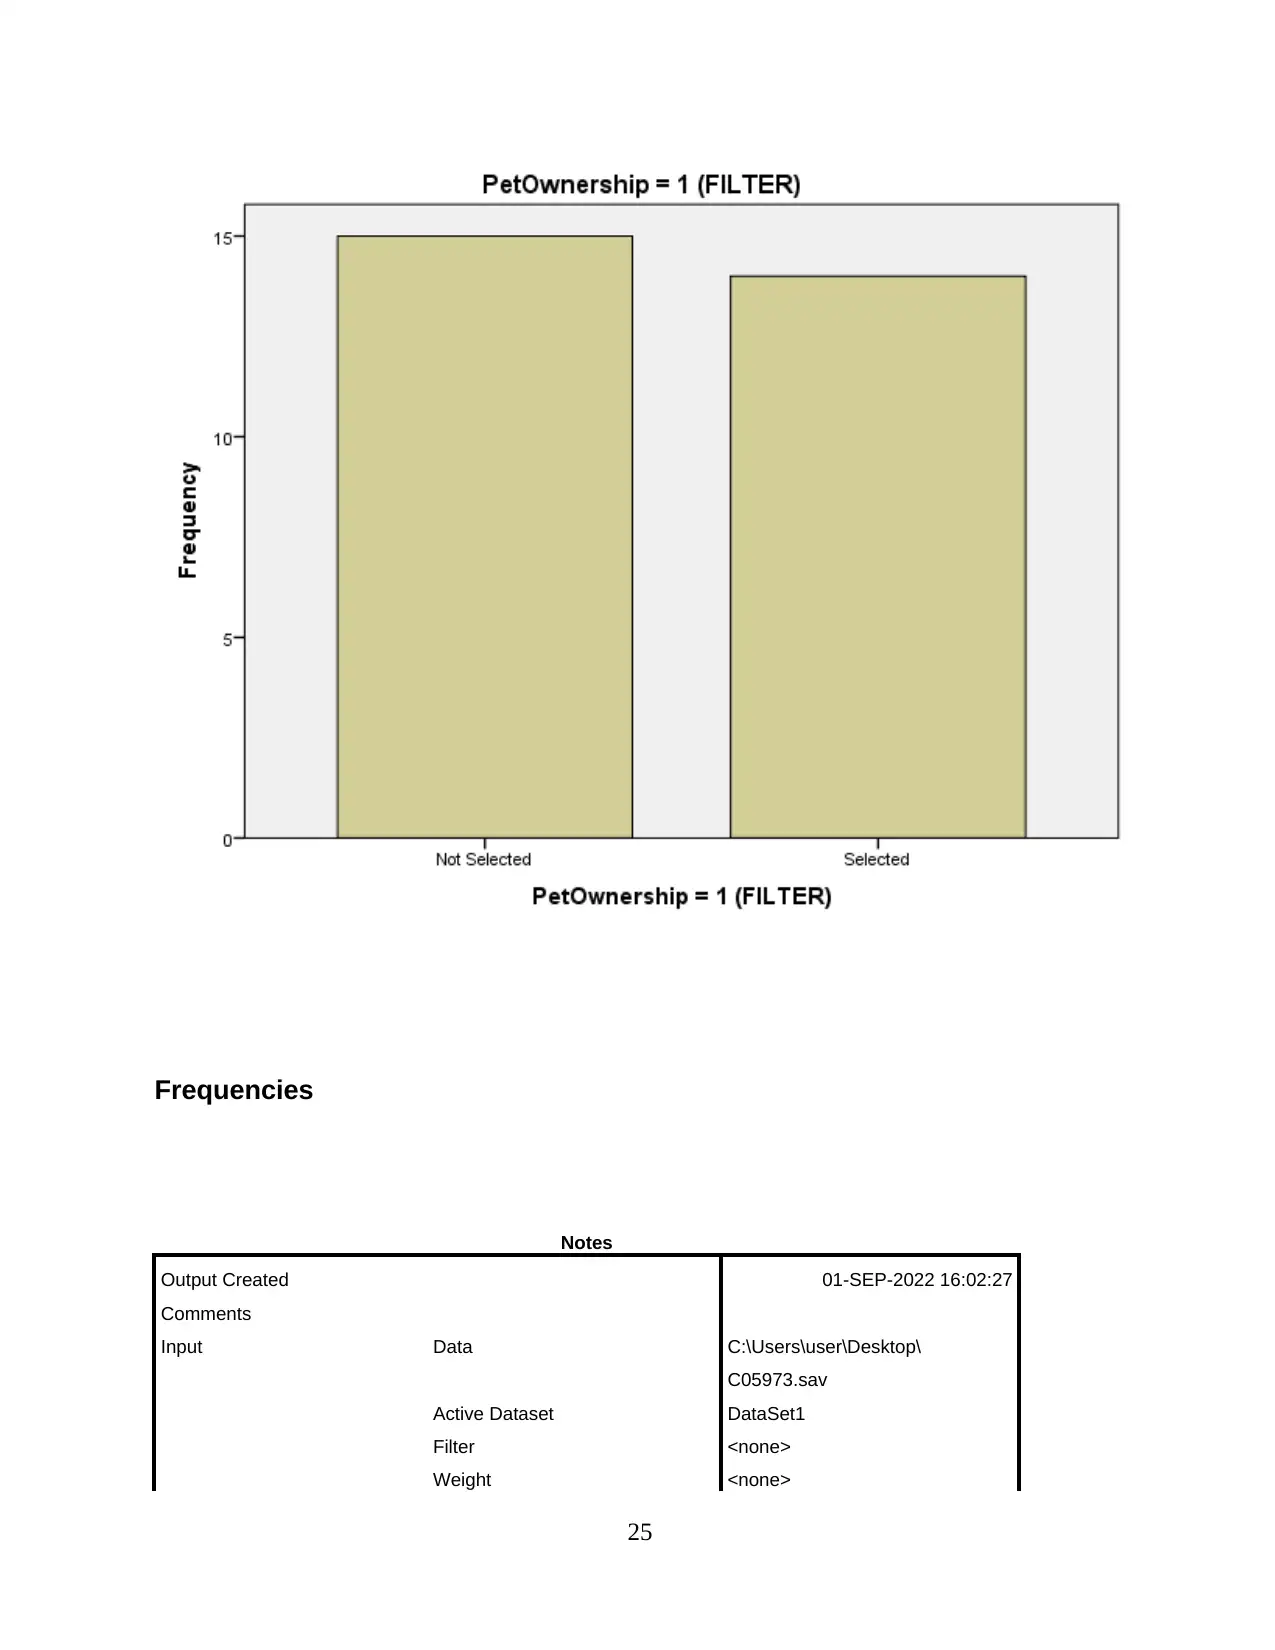
Selected 14 48.3 48.3 100.0
Total 29 100.0 100.0
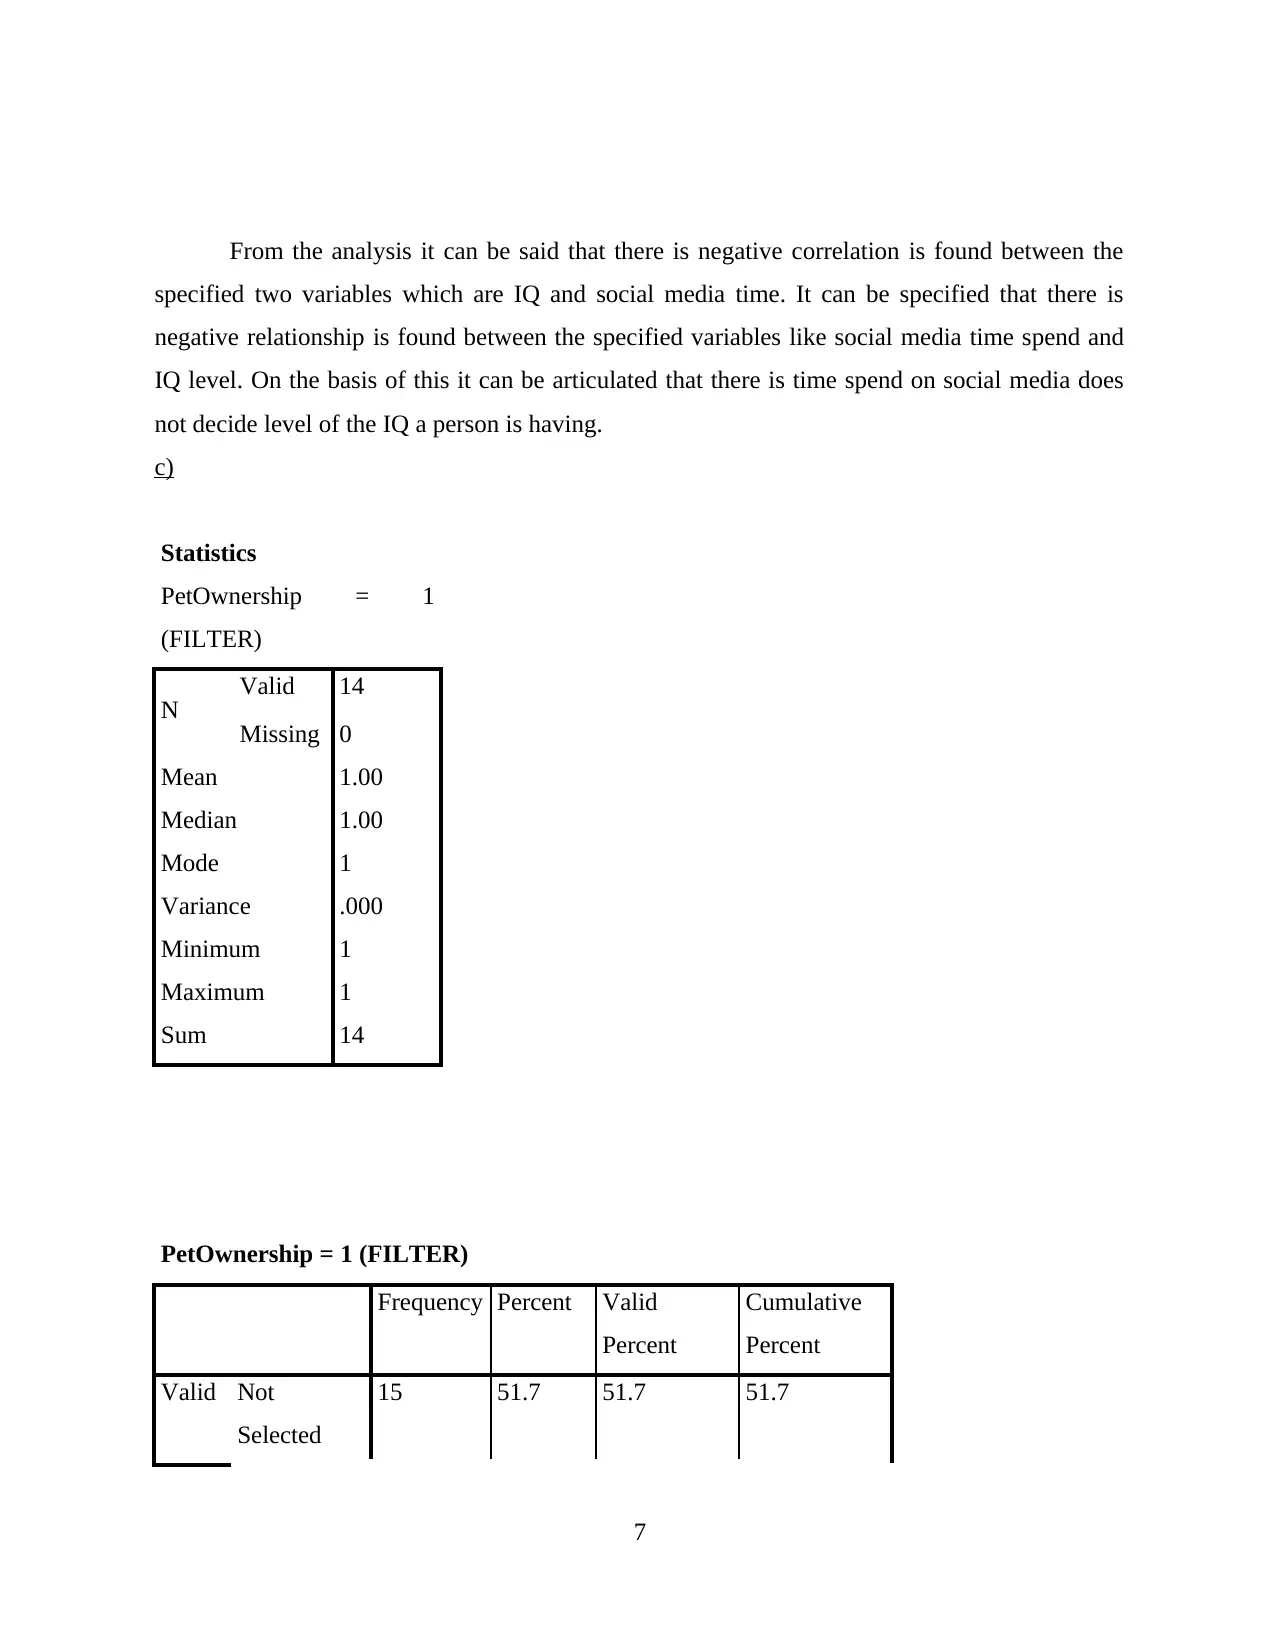
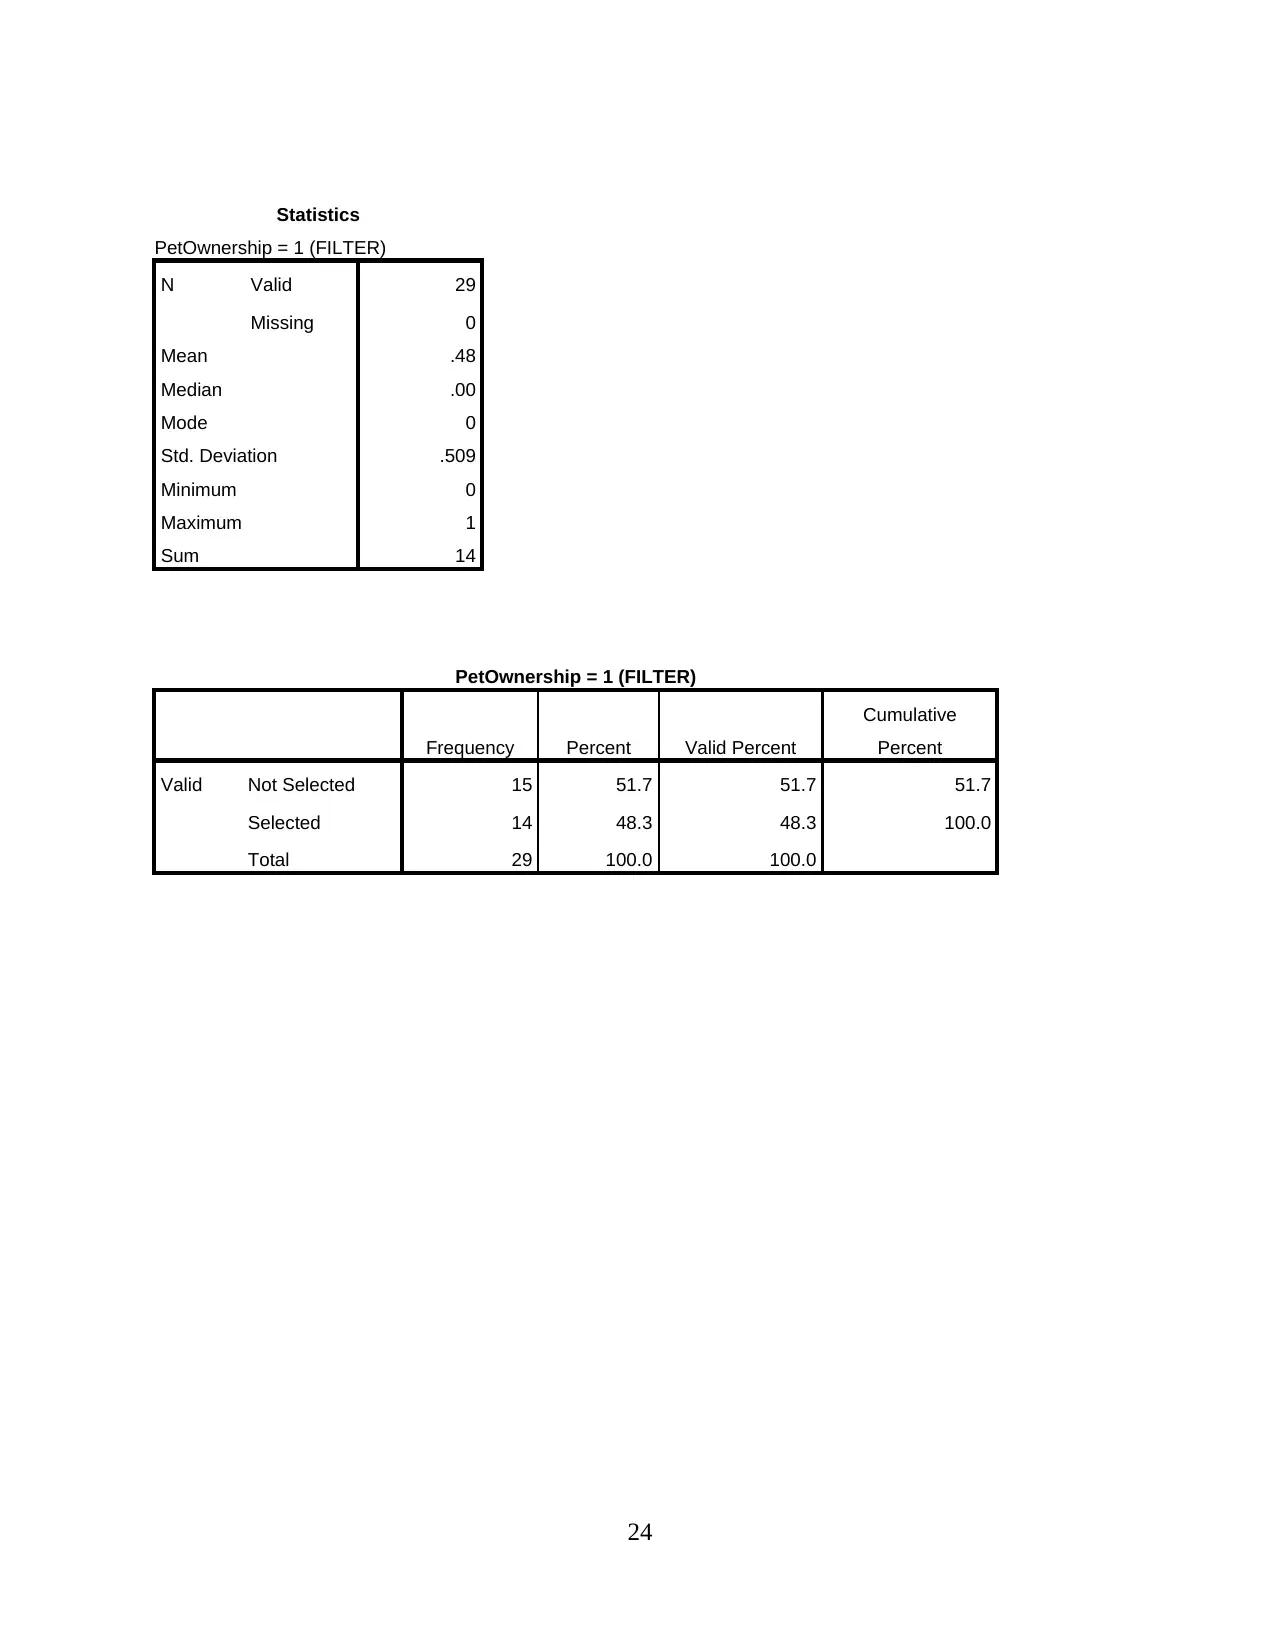
On the basis of this, it can be mentioned that 1 is denoting those respondents who said
yes it can be articulated that selected graph is presenting that there is 14 people out of 29
respondents who have chosen this which is depicting that major people are having the pet
ownership as they have selected yes regarding the highlighted subject.
8
Total 29 100.0 100.0
On the basis of this, it can be mentioned that 1 is denoting those respondents who said
yes it can be articulated that selected graph is presenting that there is 14 people out of 29
respondents who have chosen this which is depicting that major people are having the pet
ownership as they have selected yes regarding the highlighted subject.
8
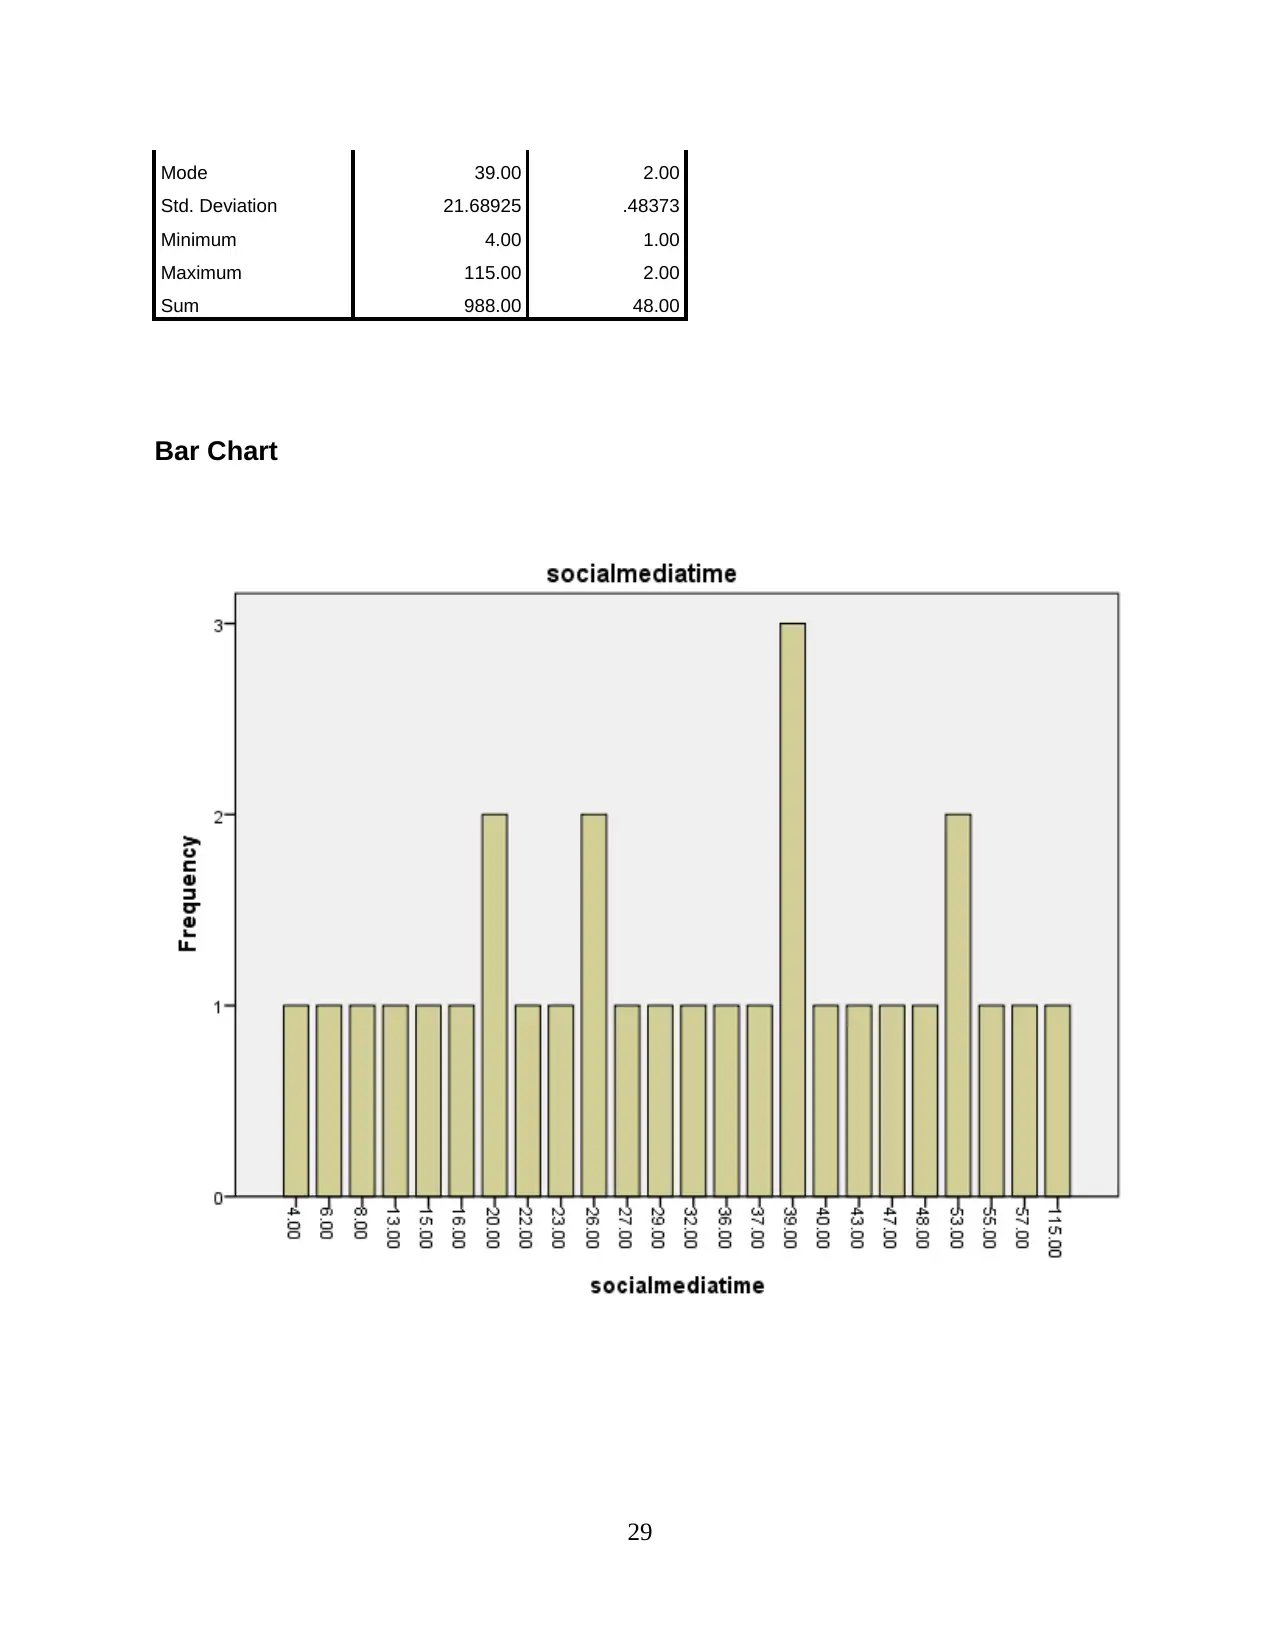
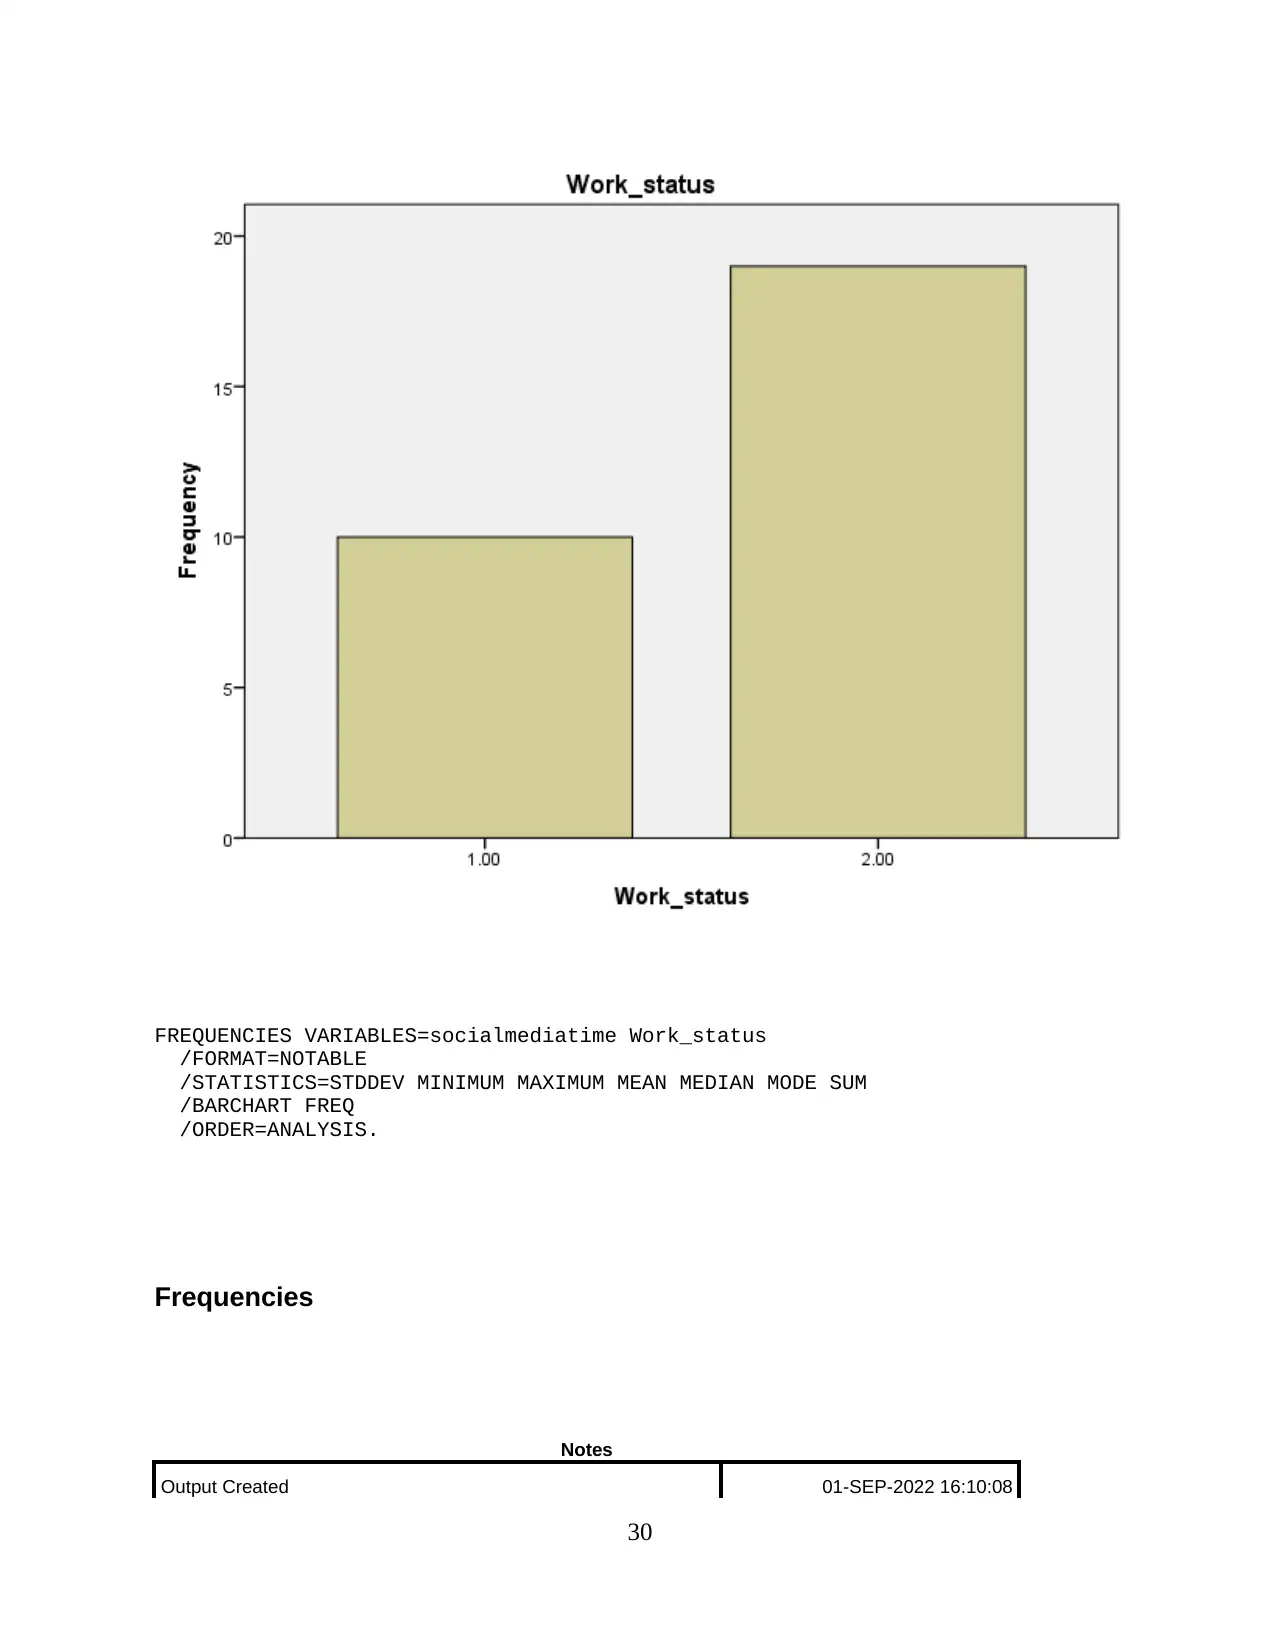
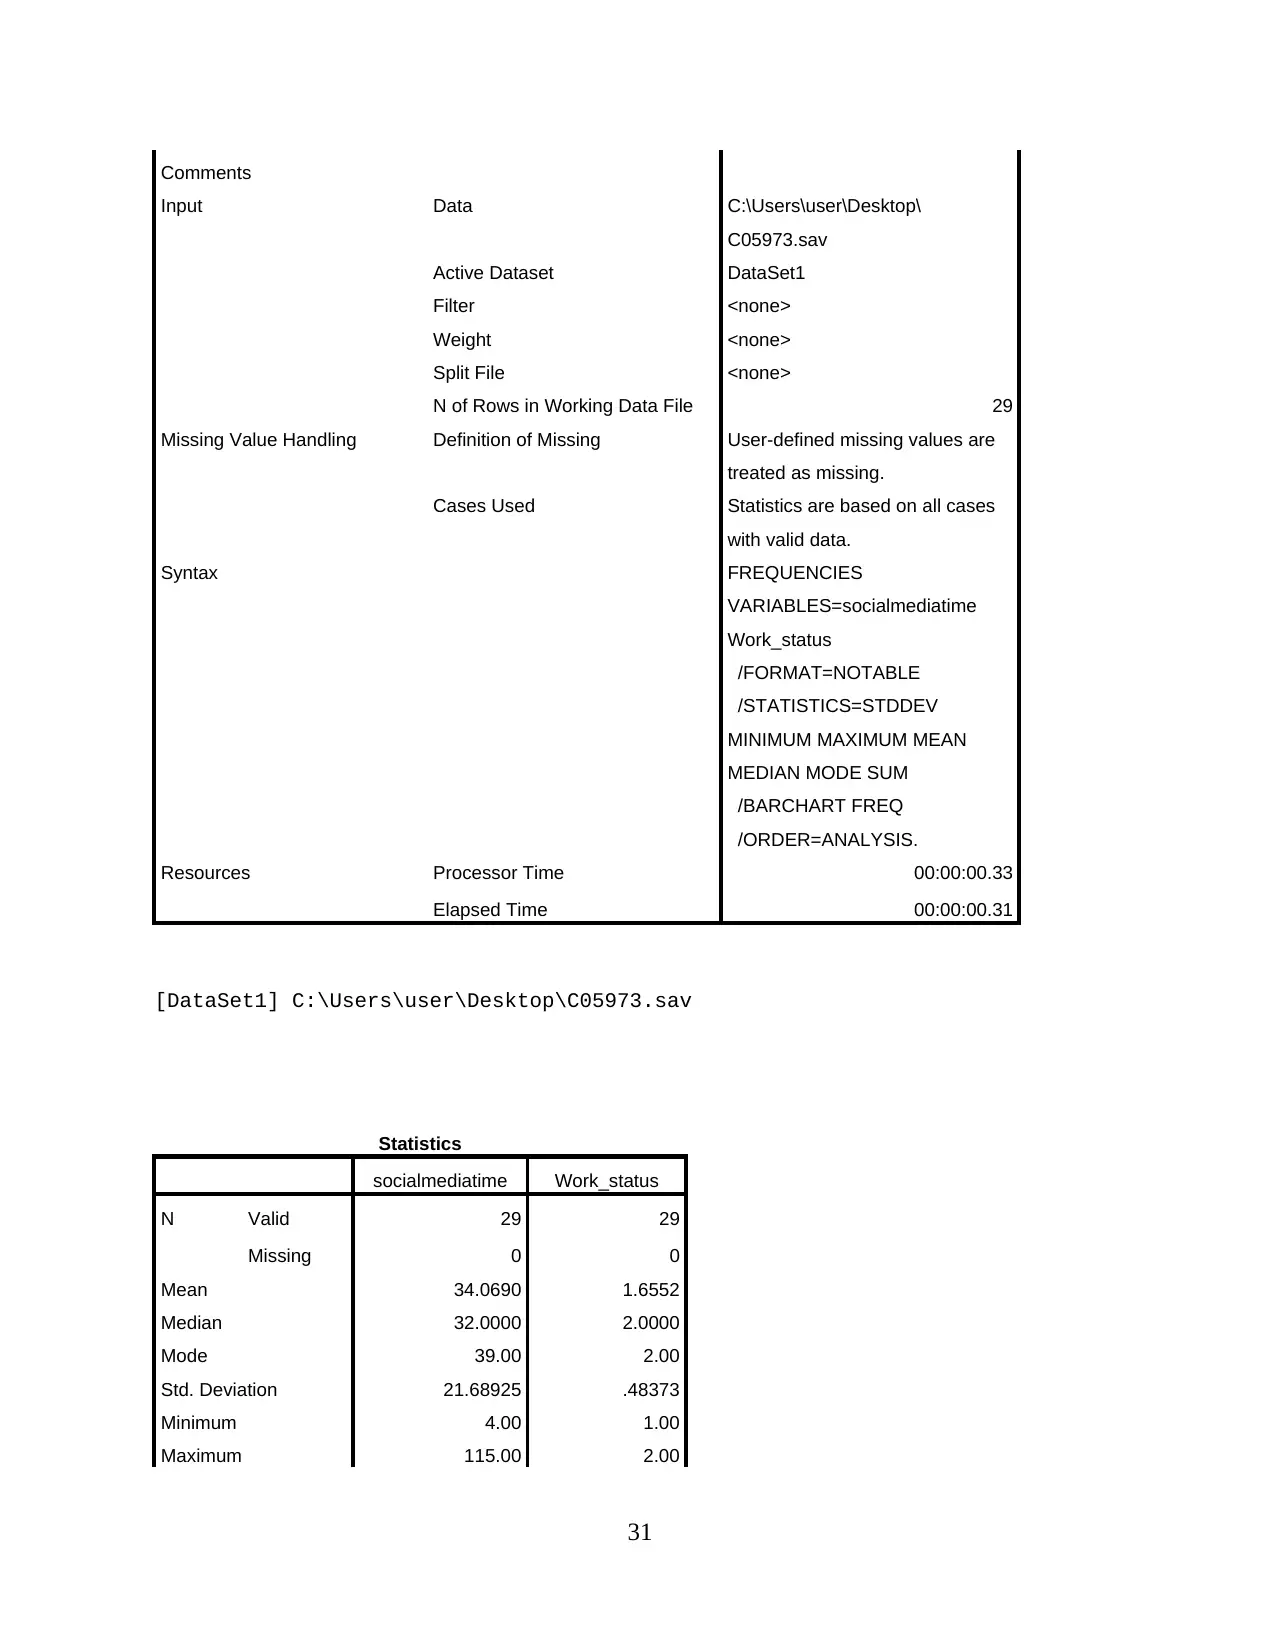
d)
Statistics
socialmediati
me
Work_statu
s
N Valid 29 29
Missing 0 0
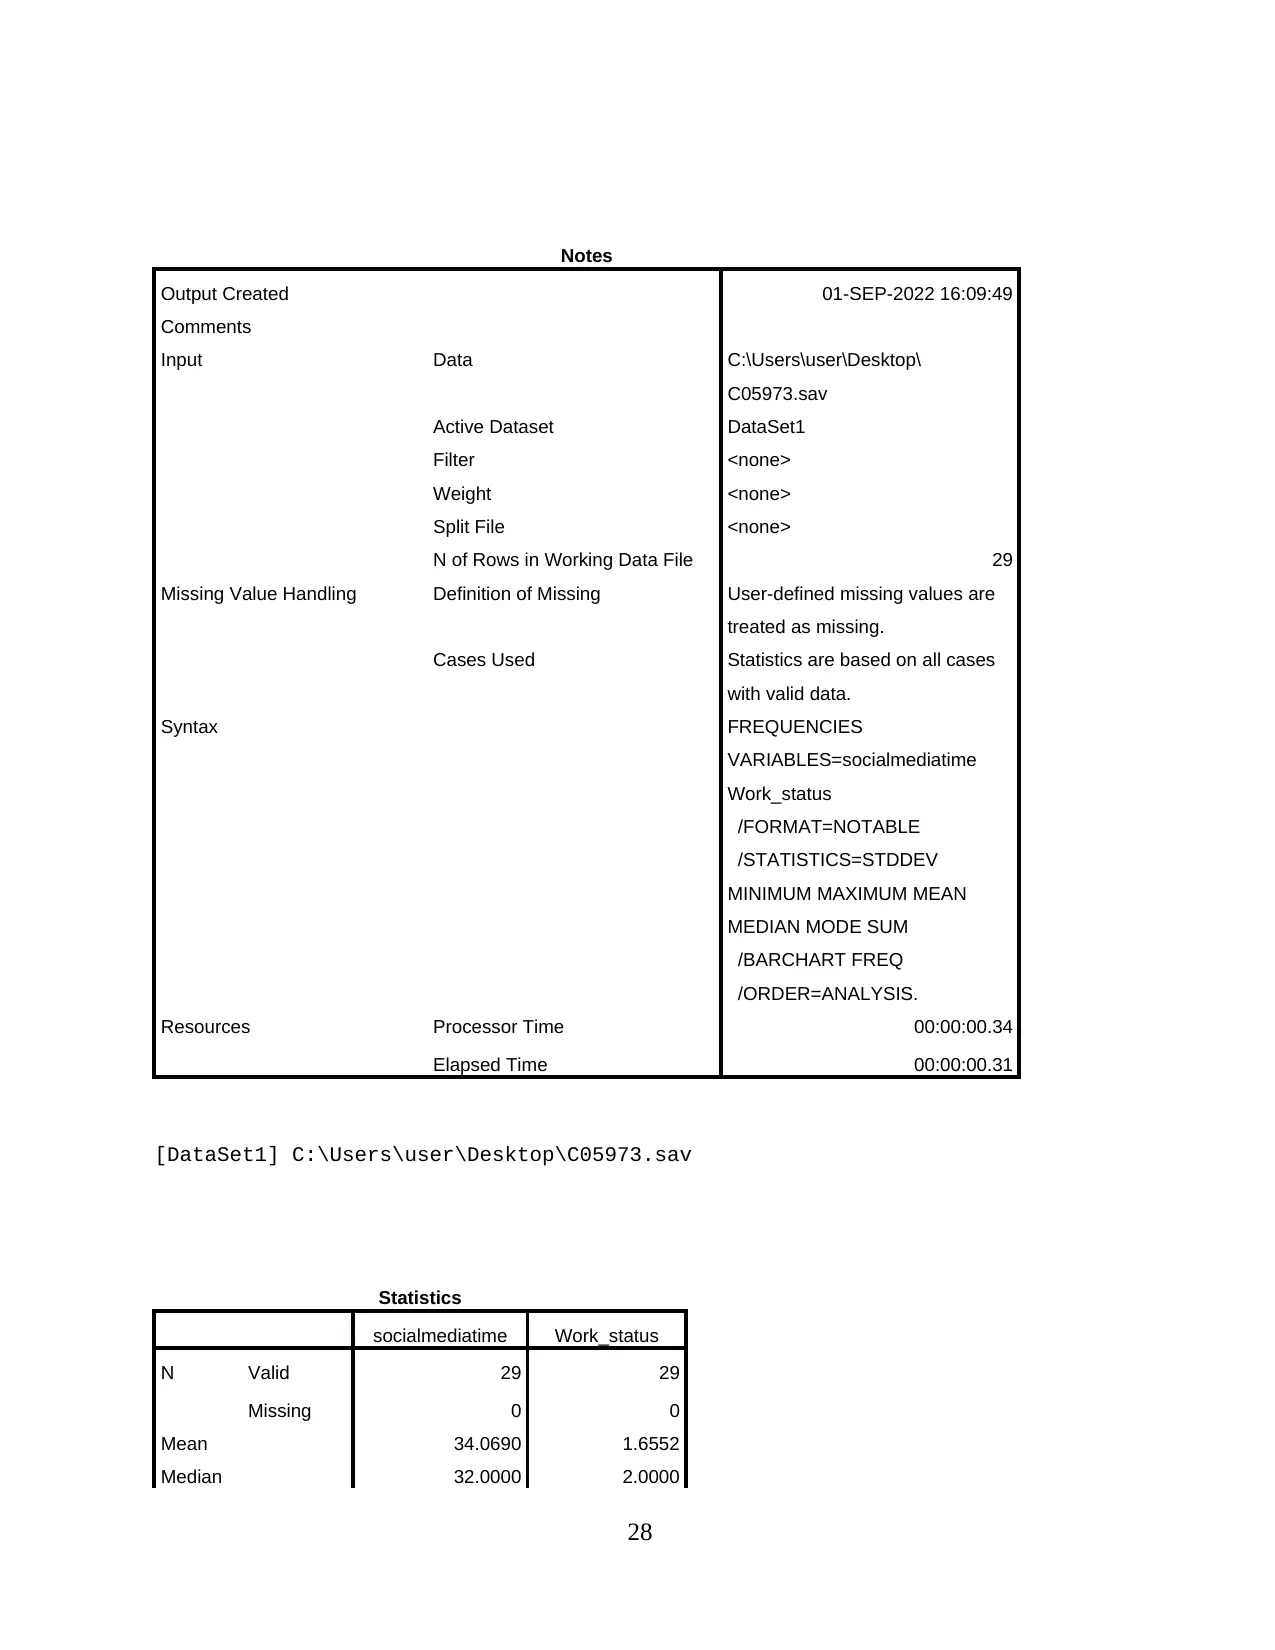
Mean 34.0690 1.6552
Median 32.0000 2.0000
Mode 39.00 2.00
Std. Deviation 21.68925 .48373
Minimum 4.00 1.00
Maximum 115.00 2.00
Sum 988.00 48.00
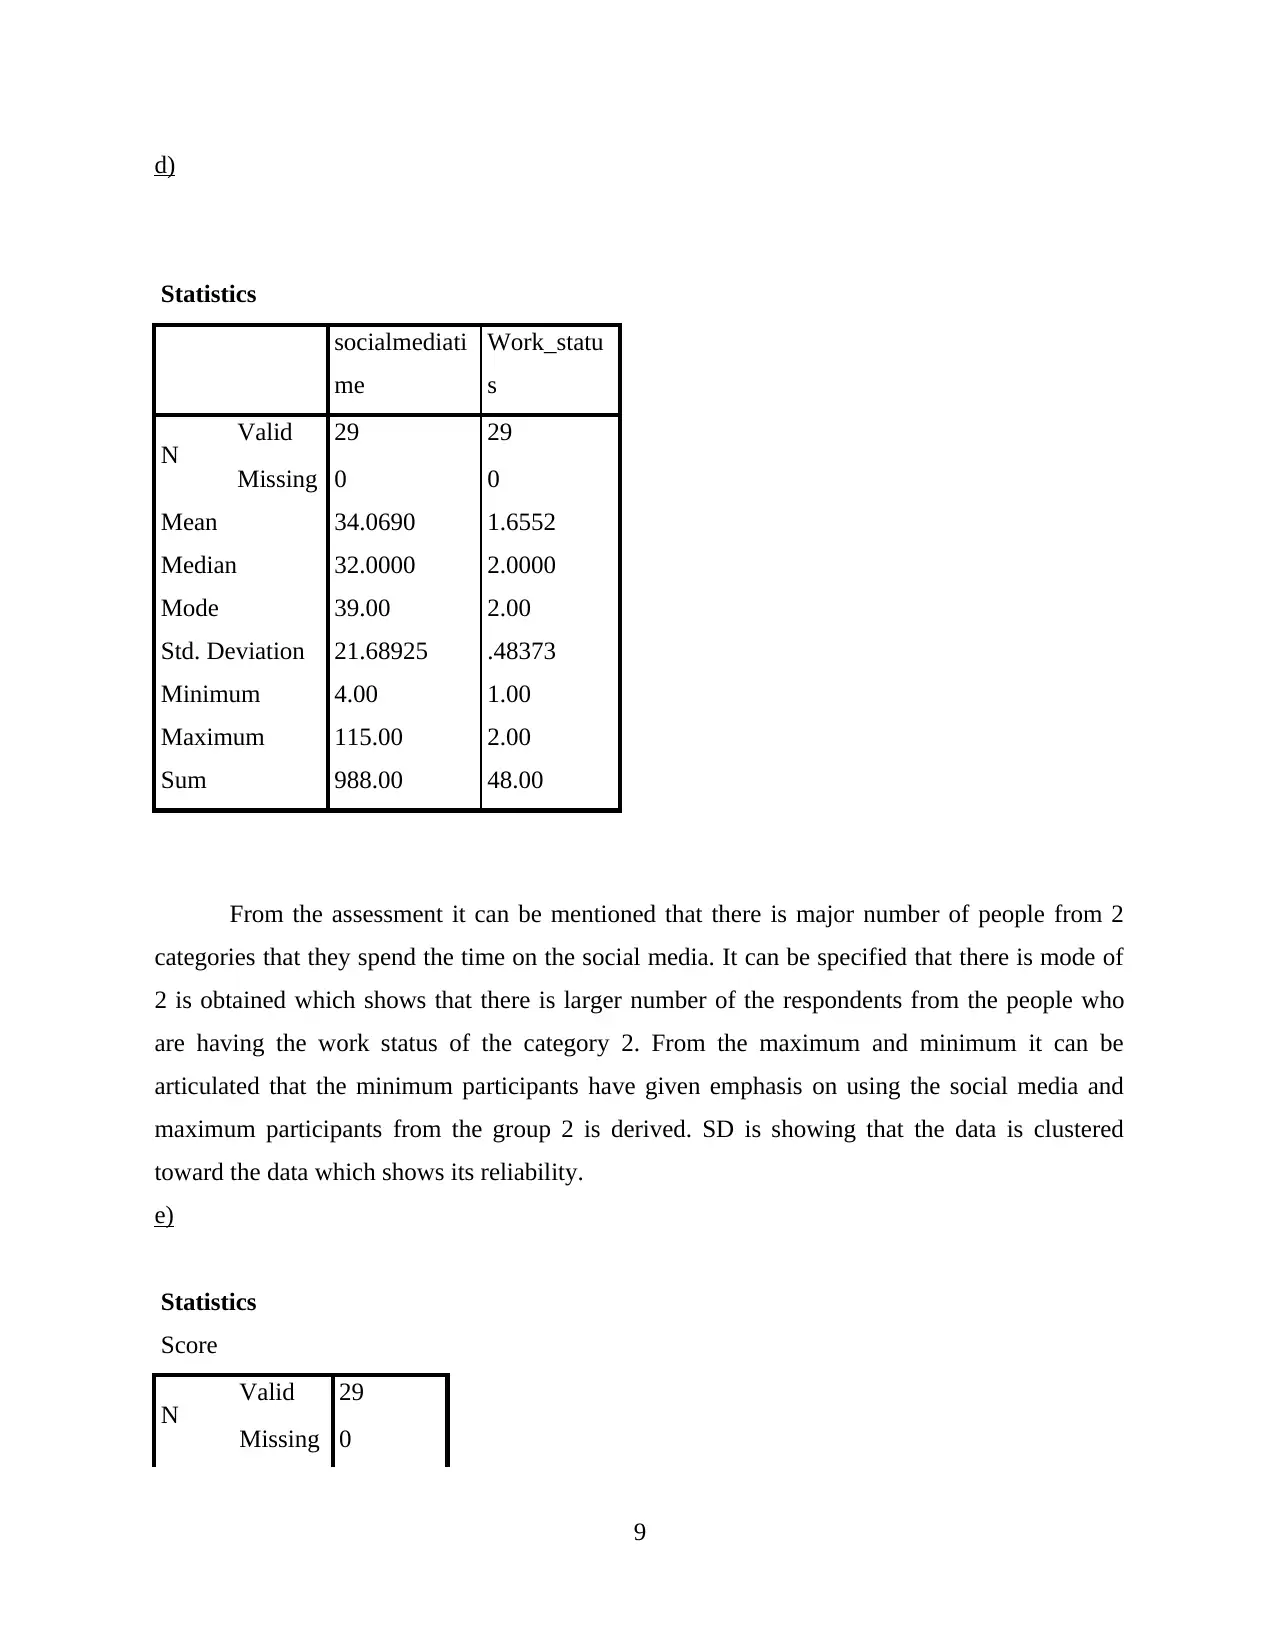
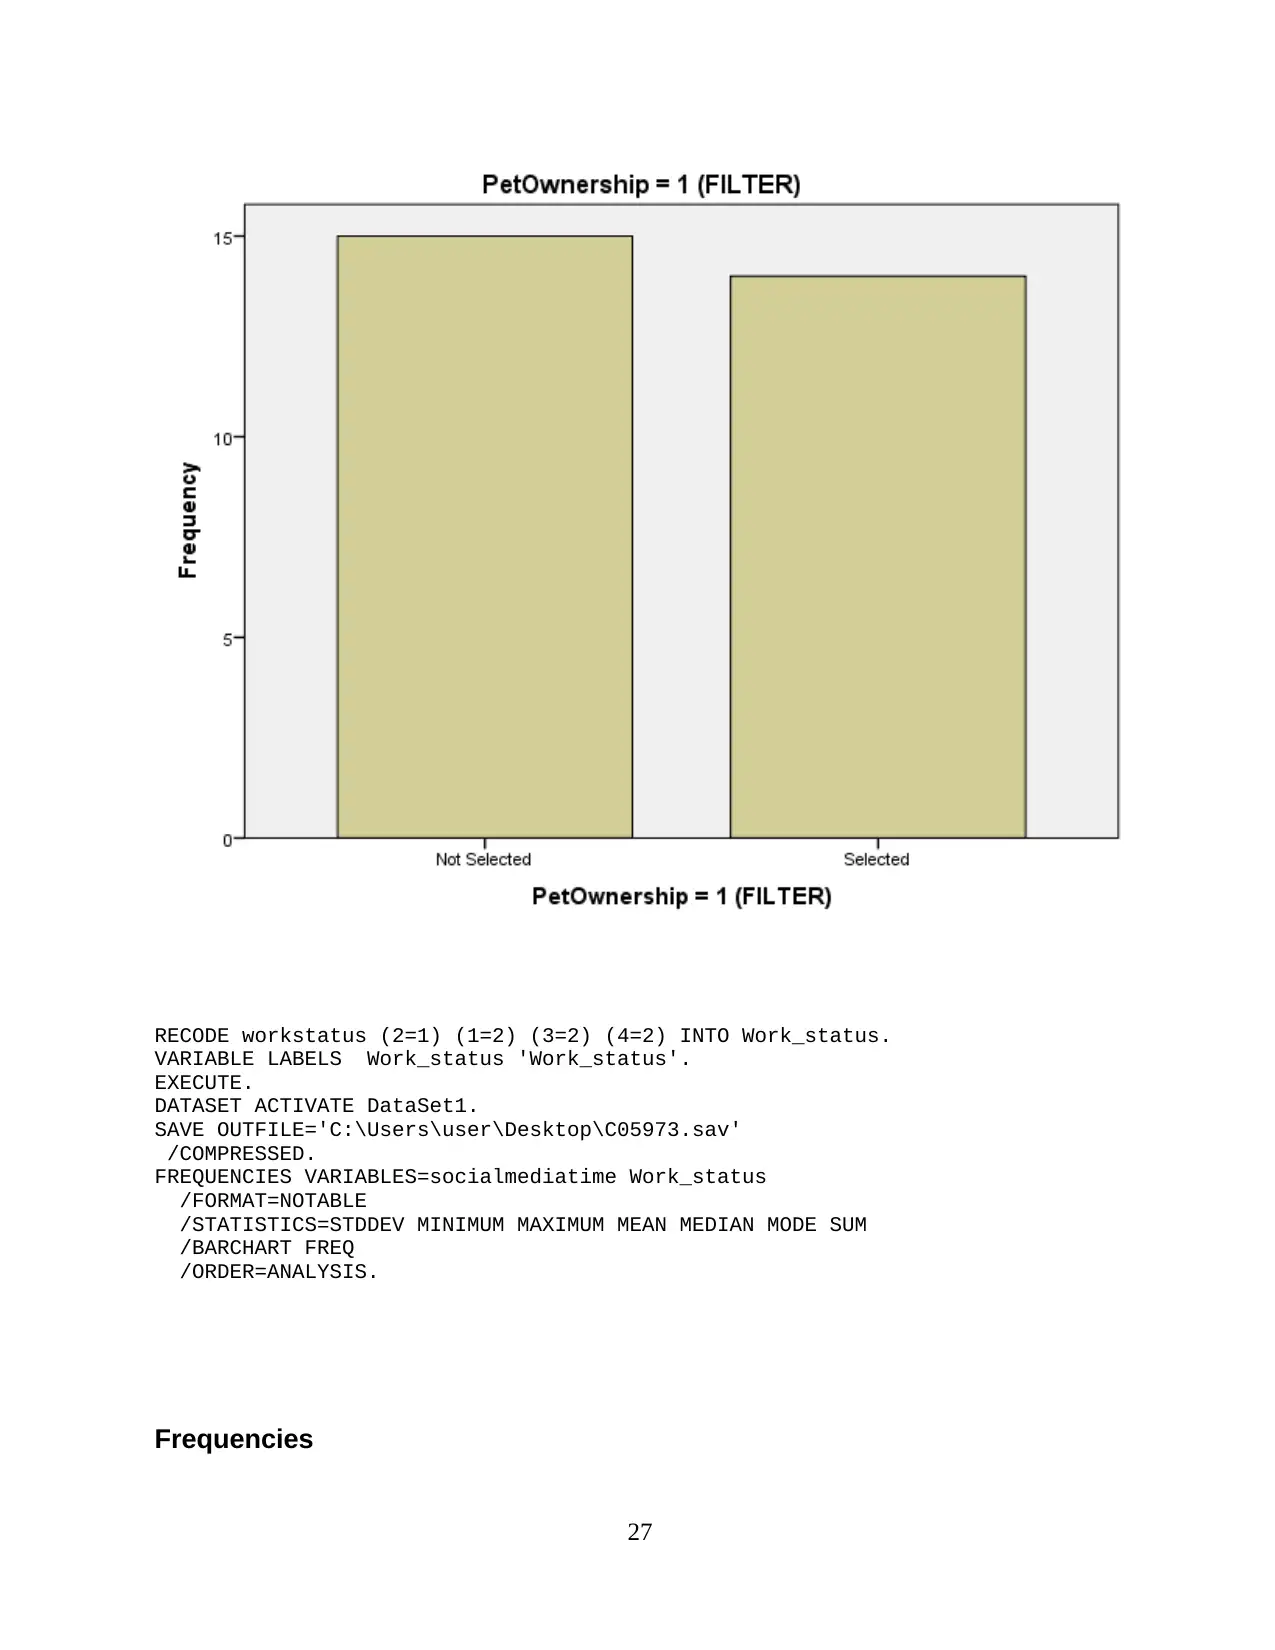
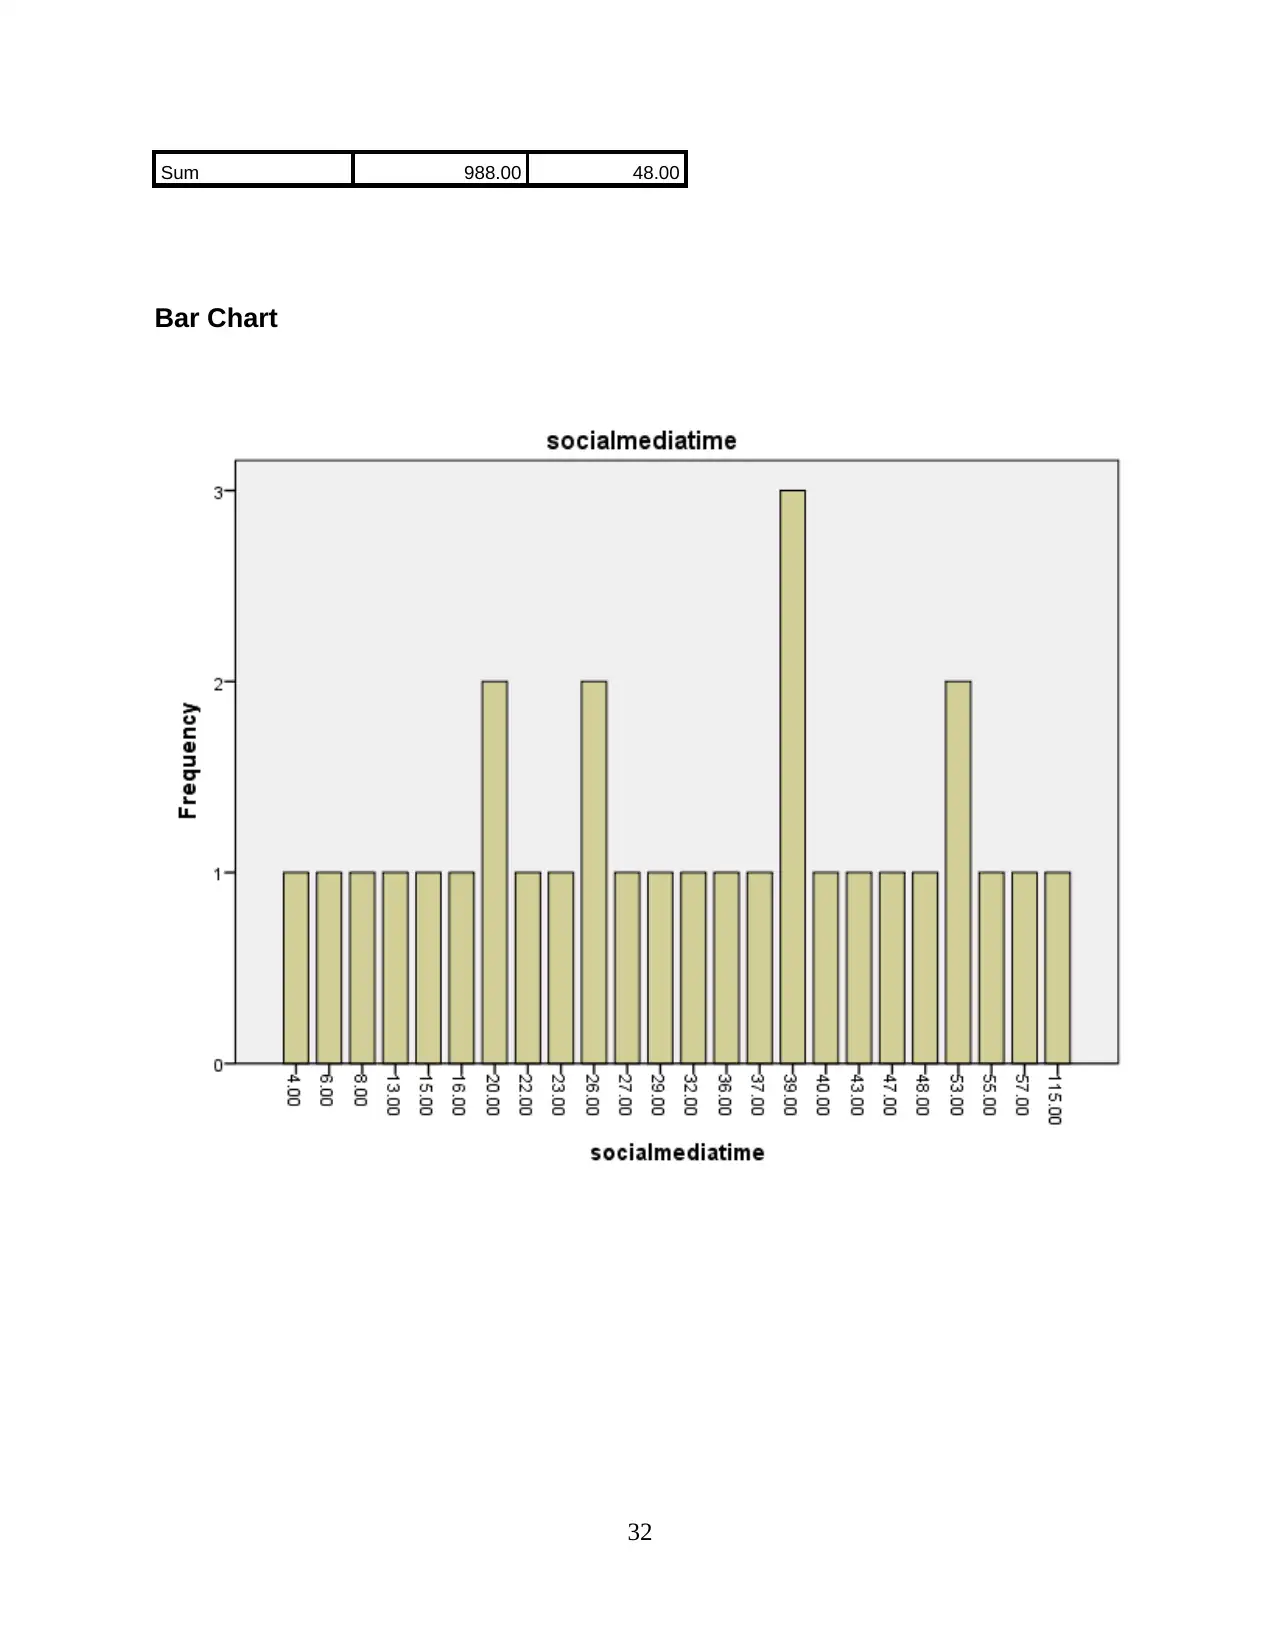
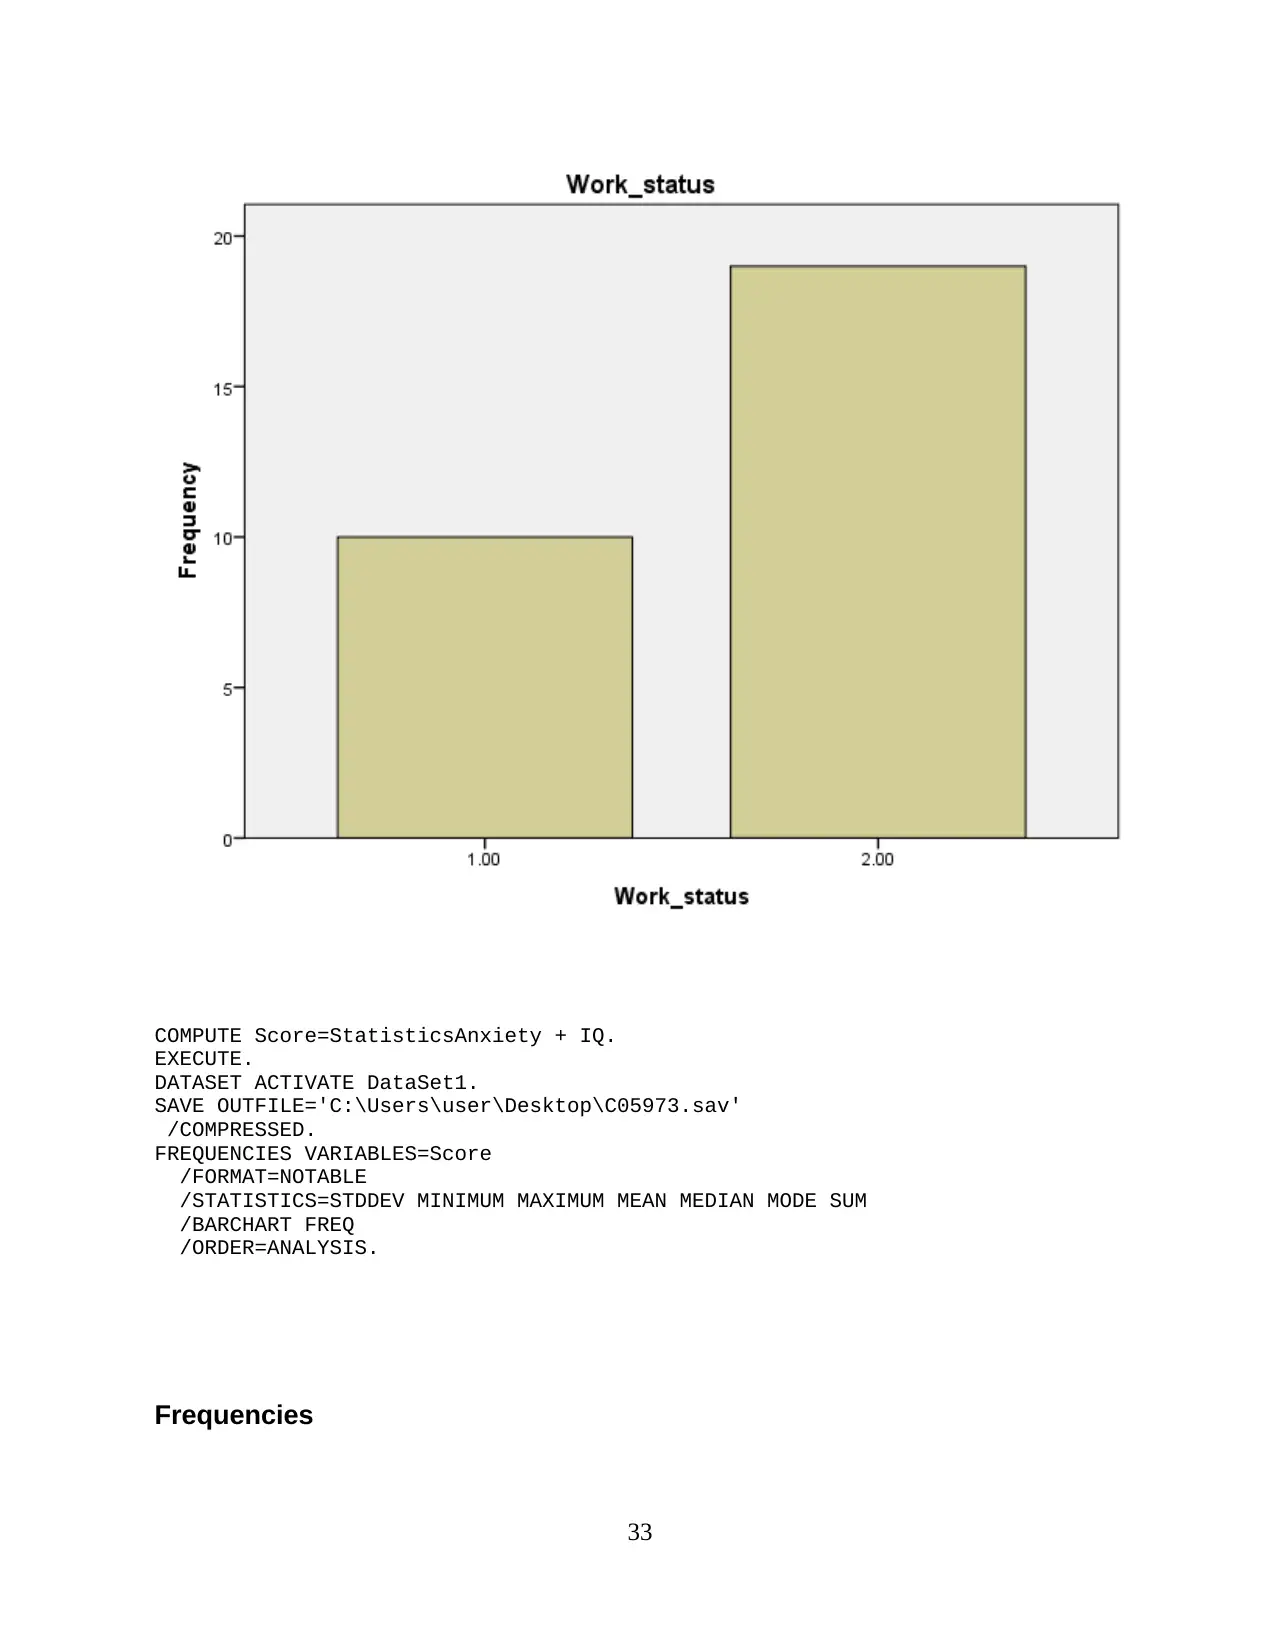
From the assessment it can be mentioned that there is major number of people from 2
categories that they spend the time on the social media. It can be specified that there is mode of
2 is obtained which shows that there is larger number of the respondents from the people who
are having the work status of the category 2. From the maximum and minimum it can be
articulated that the minimum participants have given emphasis on using the social media and
maximum participants from the group 2 is derived. SD is showing that the data is clustered
toward the data which shows its reliability.
e)
Statistics
Score
N Valid 29
Missing 0
9
Statistics
socialmediati
me
Work_statu
s
N Valid 29 29
Missing 0 0
Mean 34.0690 1.6552
Median 32.0000 2.0000
Mode 39.00 2.00
Std. Deviation 21.68925 .48373
Minimum 4.00 1.00
Maximum 115.00 2.00
Sum 988.00 48.00
From the assessment it can be mentioned that there is major number of people from 2
categories that they spend the time on the social media. It can be specified that there is mode of
2 is obtained which shows that there is larger number of the respondents from the people who
are having the work status of the category 2. From the maximum and minimum it can be
articulated that the minimum participants have given emphasis on using the social media and
maximum participants from the group 2 is derived. SD is showing that the data is clustered
toward the data which shows its reliability.
e)
Statistics
Score
N Valid 29
Missing 0
9
Secure Best Marks with AI Grader
Need help grading? Try our AI Grader for instant feedback on your assignments.
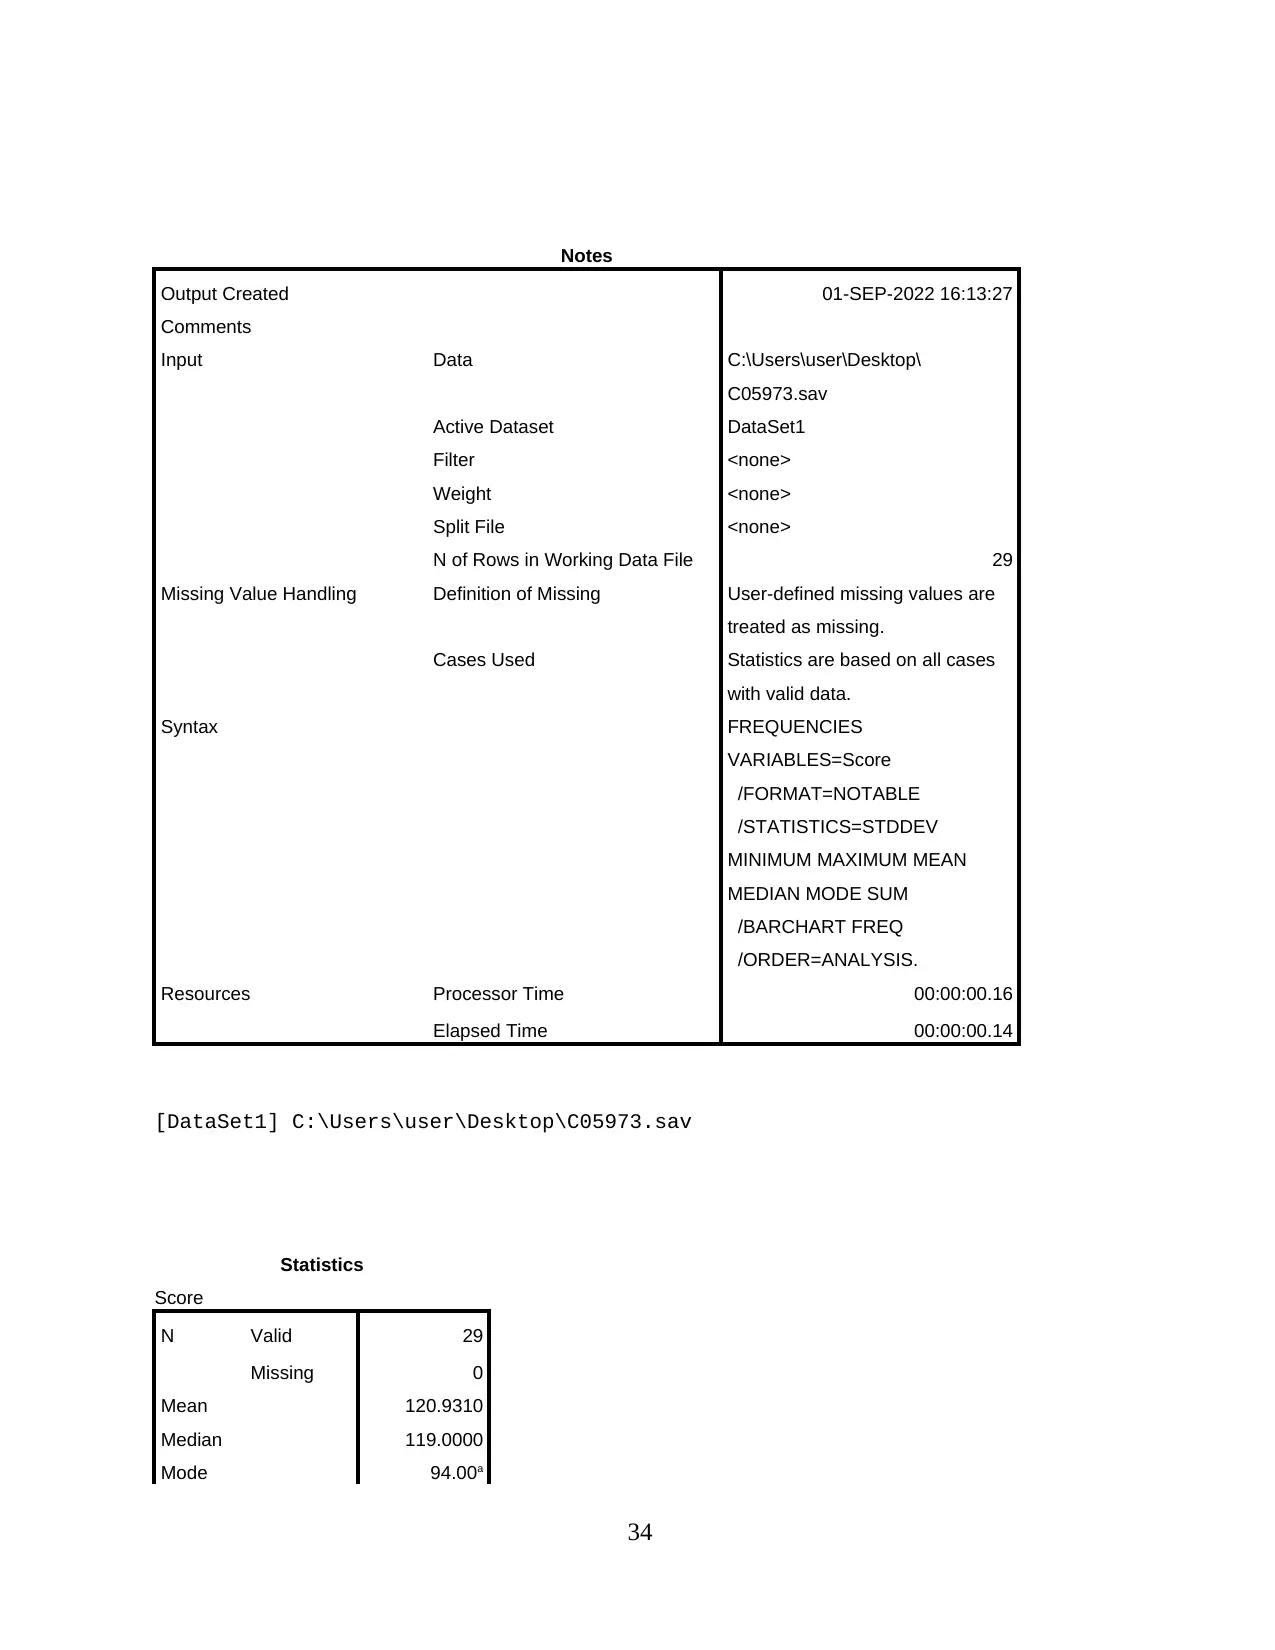
Mean 120.9310
Median 119.0000
Mode 94.00a
Std. Deviation 24.94126
Minimum 83.00
Maximum 180.00
Sum 3507.00
a. Multiple modes exist.
The smallest value is
shown
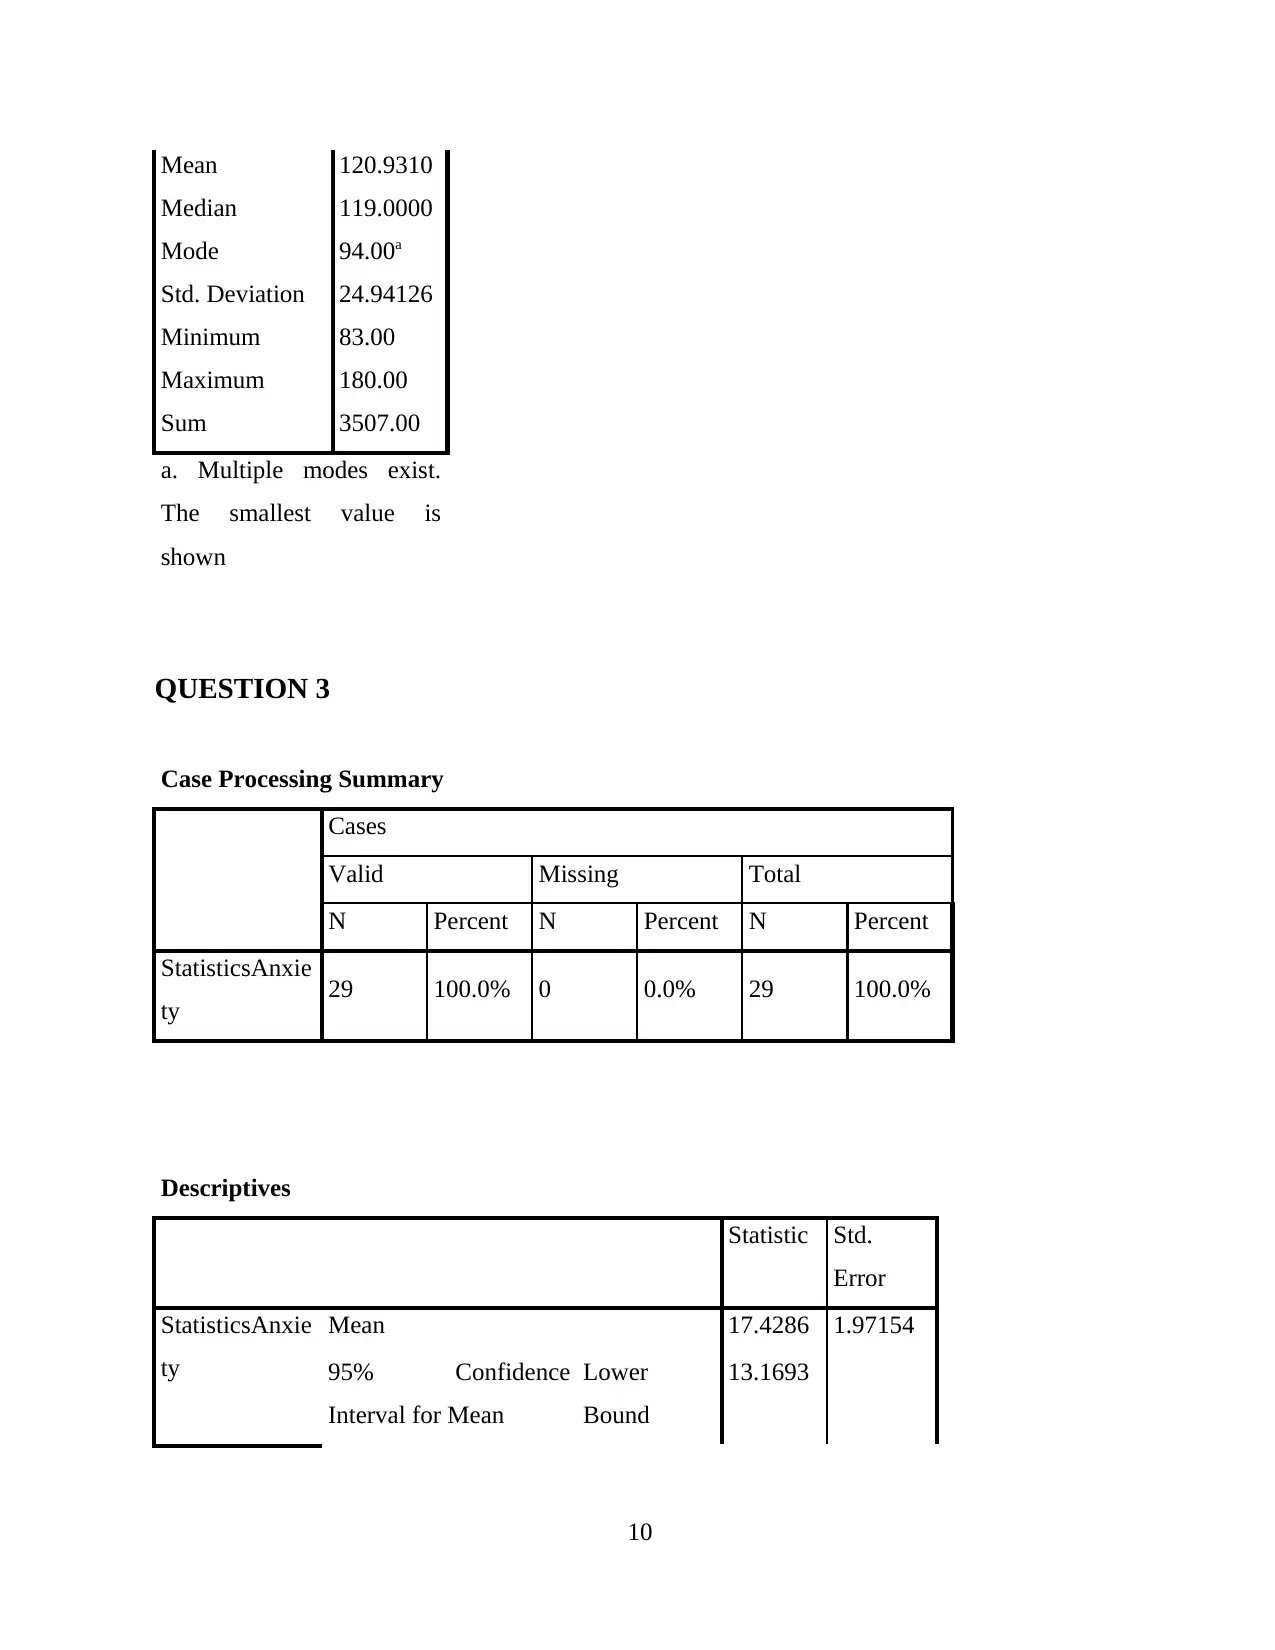
QUESTION 3
Case Processing Summary
Cases
Valid Missing Total
N Percent N Percent N Percent
StatisticsAnxie
ty 29 100.0% 0 0.0% 29 100.0%
Descriptives
Statistic Std.
Error
StatisticsAnxie
ty
Mean 17.4286 1.97154
95% Confidence
Interval for Mean
Lower
Bound
13.1693
10
Median 119.0000
Mode 94.00a
Std. Deviation 24.94126
Minimum 83.00
Maximum 180.00
Sum 3507.00
a. Multiple modes exist.
The smallest value is
shown
QUESTION 3
Case Processing Summary
Cases
Valid Missing Total
N Percent N Percent N Percent
StatisticsAnxie
ty 29 100.0% 0 0.0% 29 100.0%
Descriptives
Statistic Std.
Error
StatisticsAnxie
ty
Mean 17.4286 1.97154
95% Confidence
Interval for Mean
Lower
Bound
13.1693
10
Upper
Bound 21.6878
5% Trimmed Mean 17.4206
Median 19.0000
Variance 54.418
Std. Deviation 7.37683
Minimum 6.00
Maximum 29.00
Range 23.00
Interquartile Range 13.75
Skewness -.272 .597
Kurtosis -.925 1.154
Tests of Normality
Kolmogorov-Smirnova Shapiro-Wilk
Statistic df Sig. Statistic df Sig.
StatisticsAnxie
ty .191 14 .177 .925 14 .259
a. Lilliefors Significance Correction
11
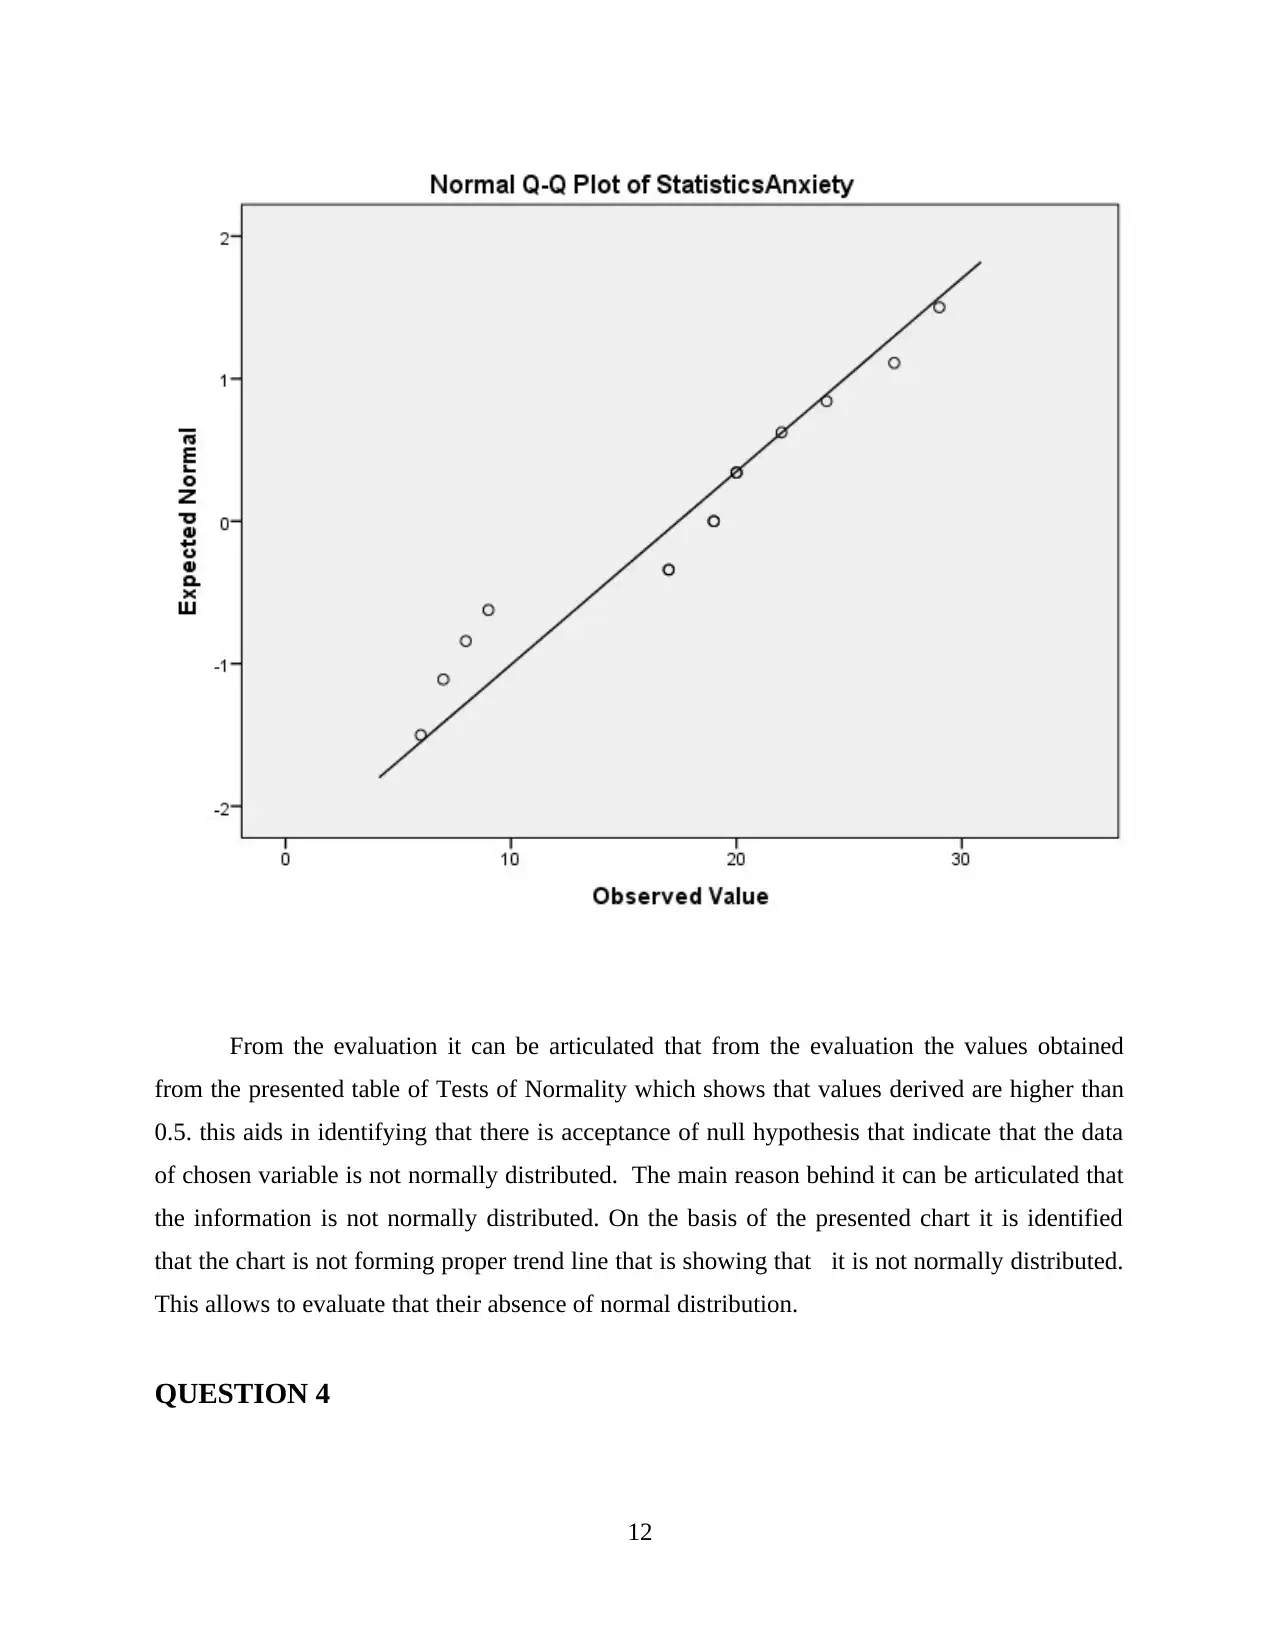
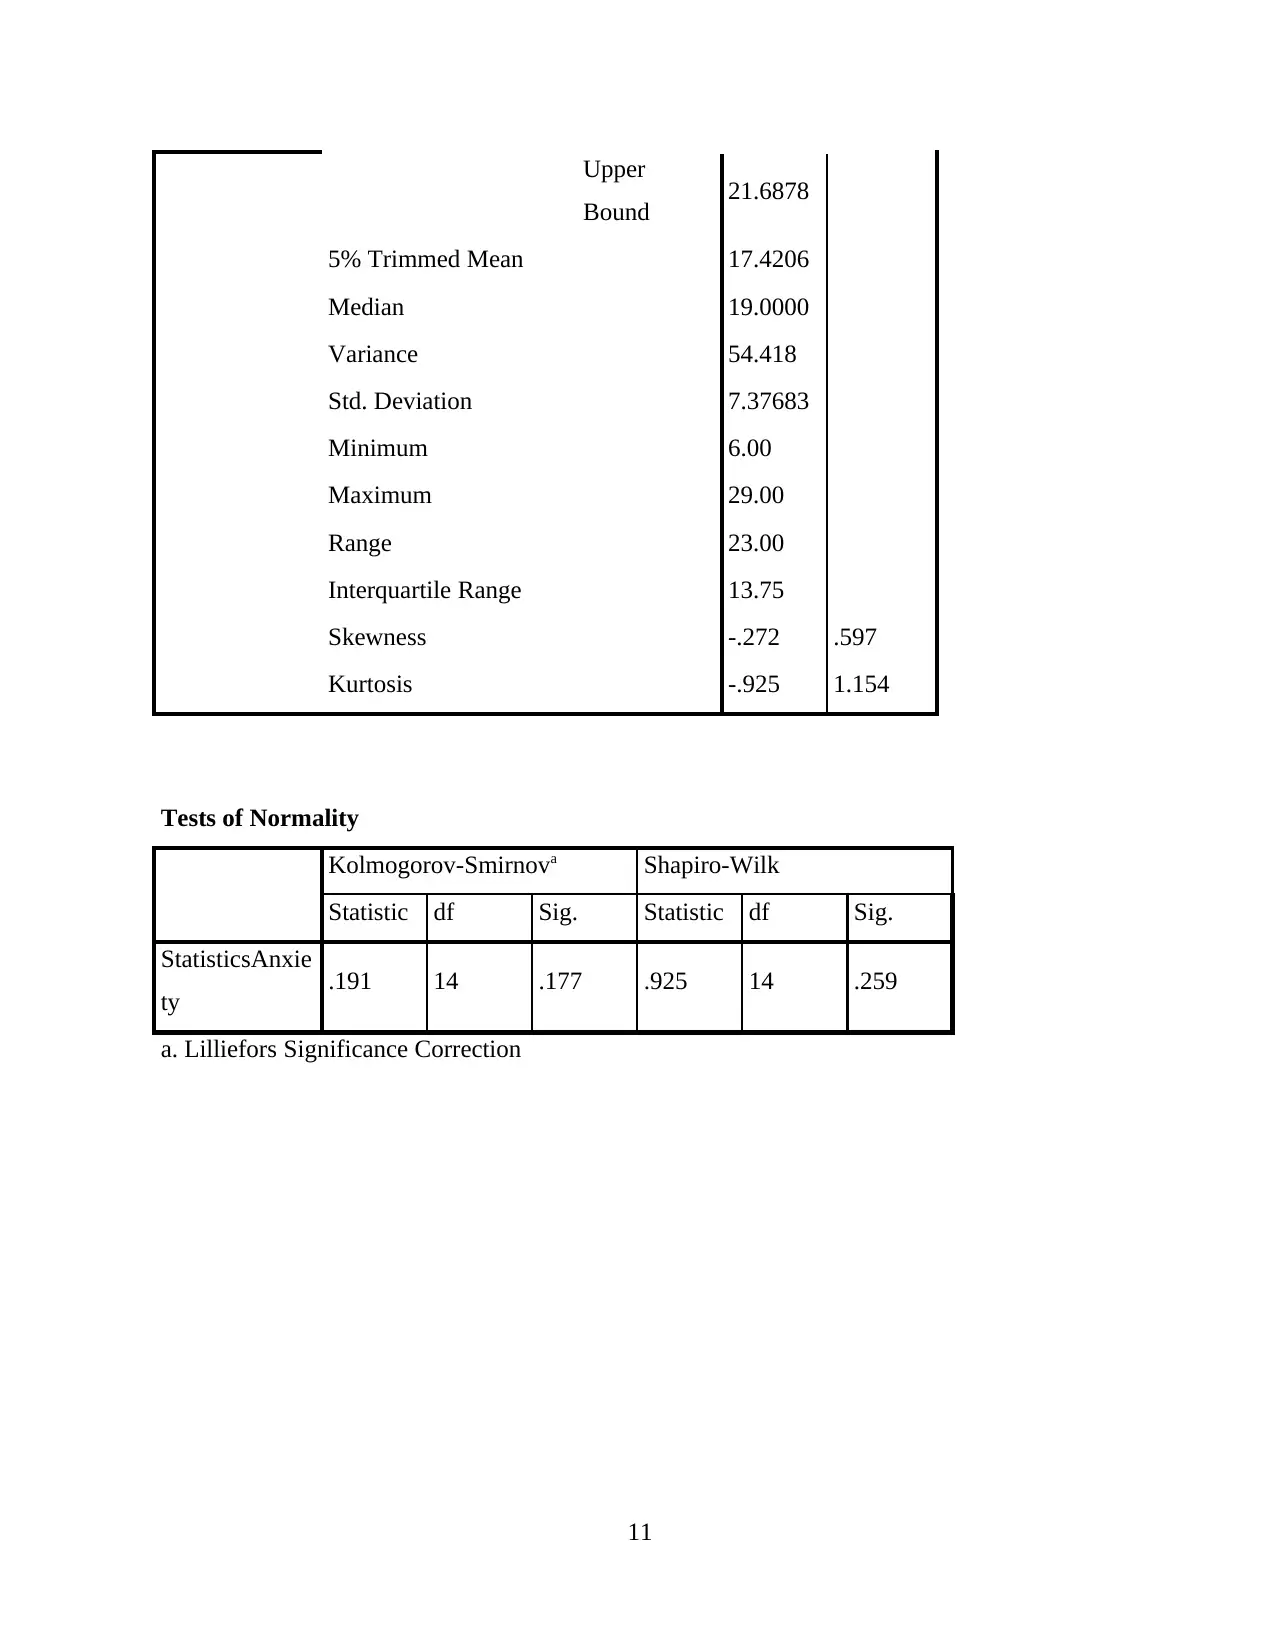
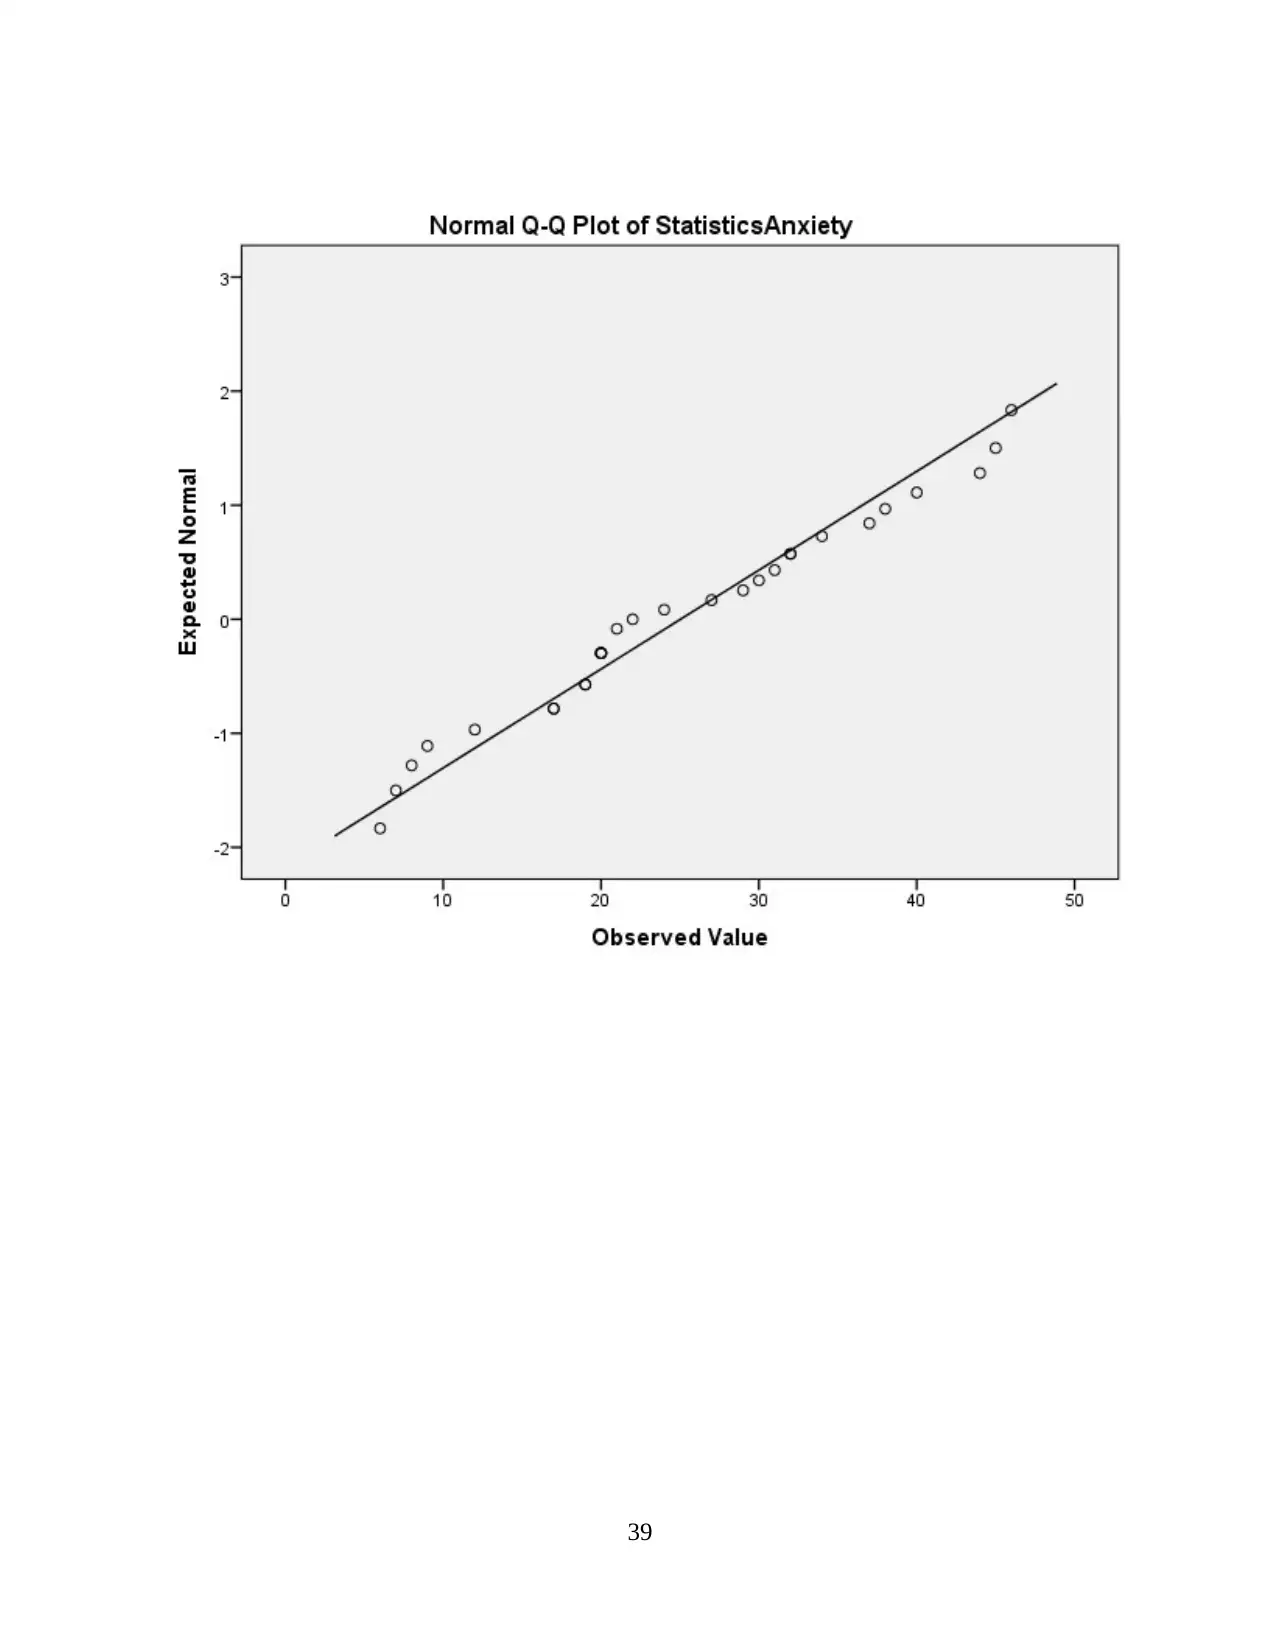
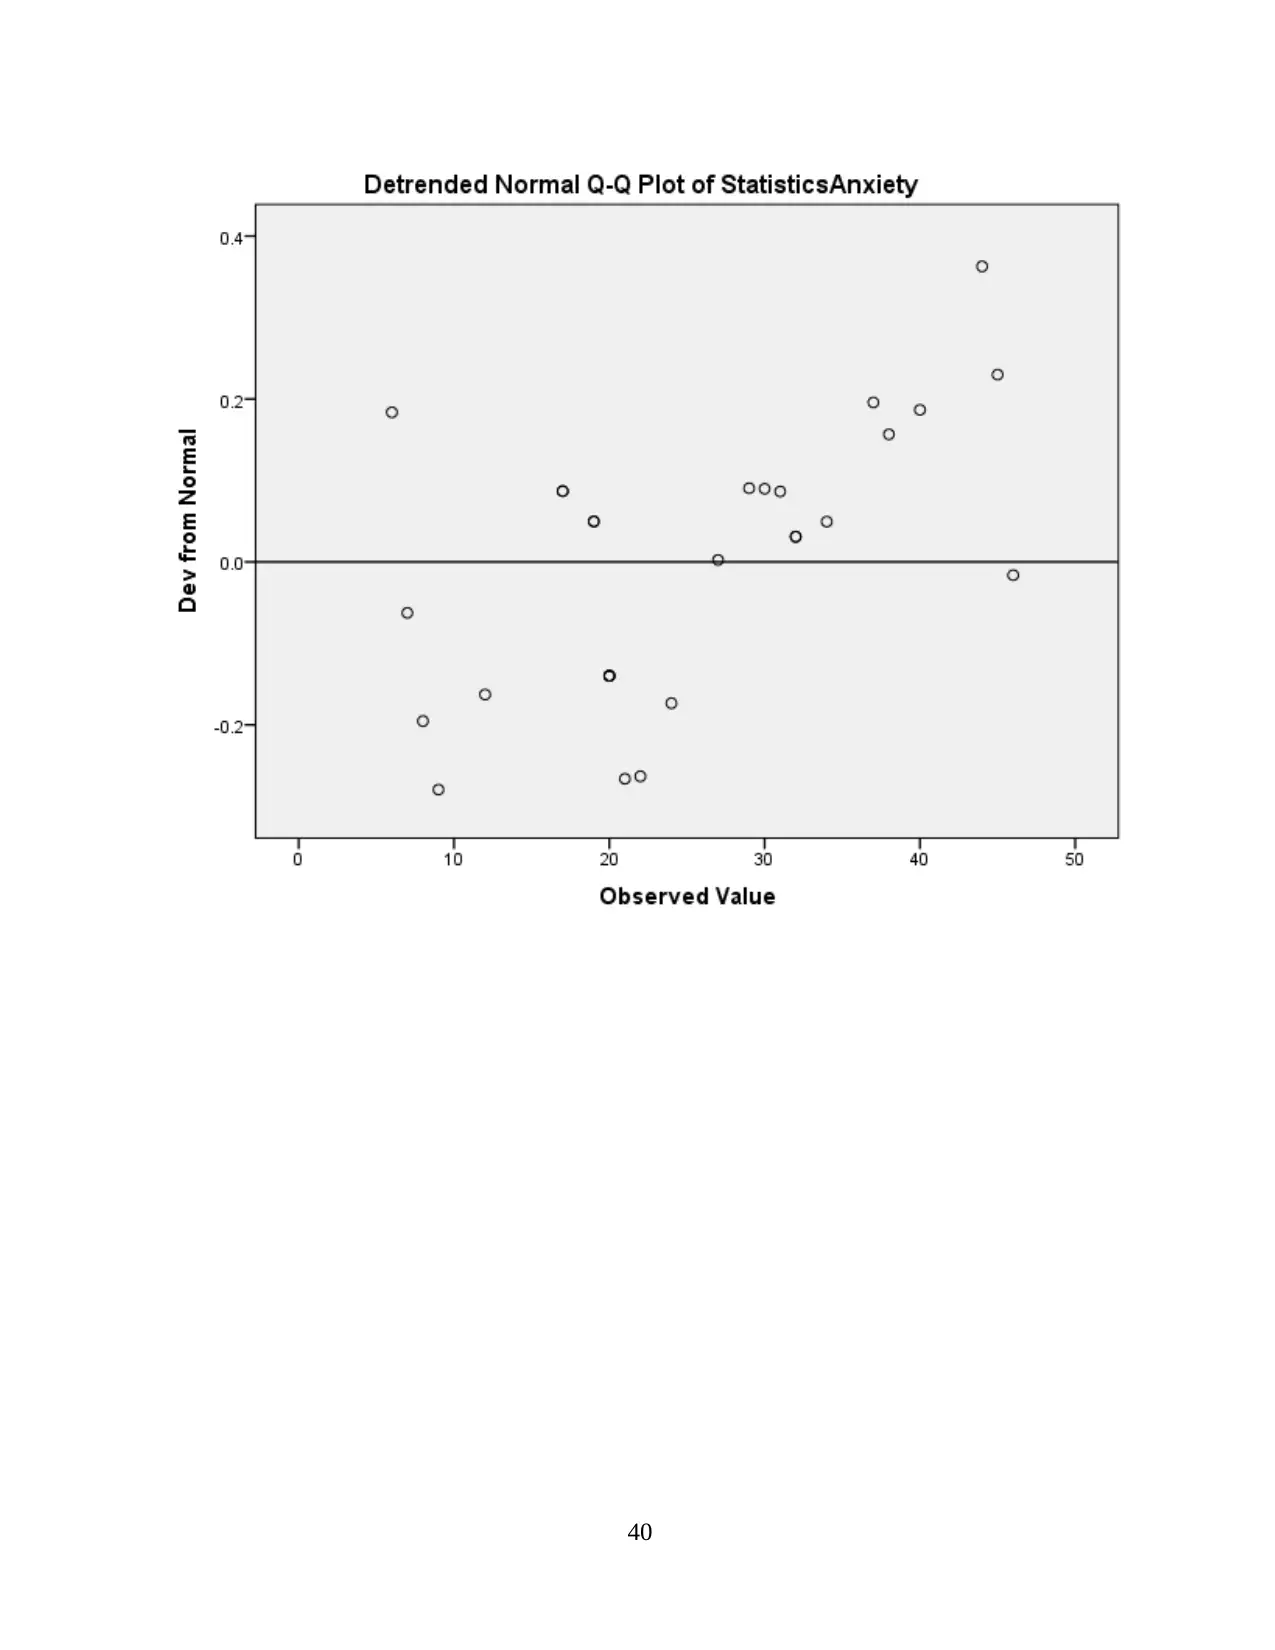
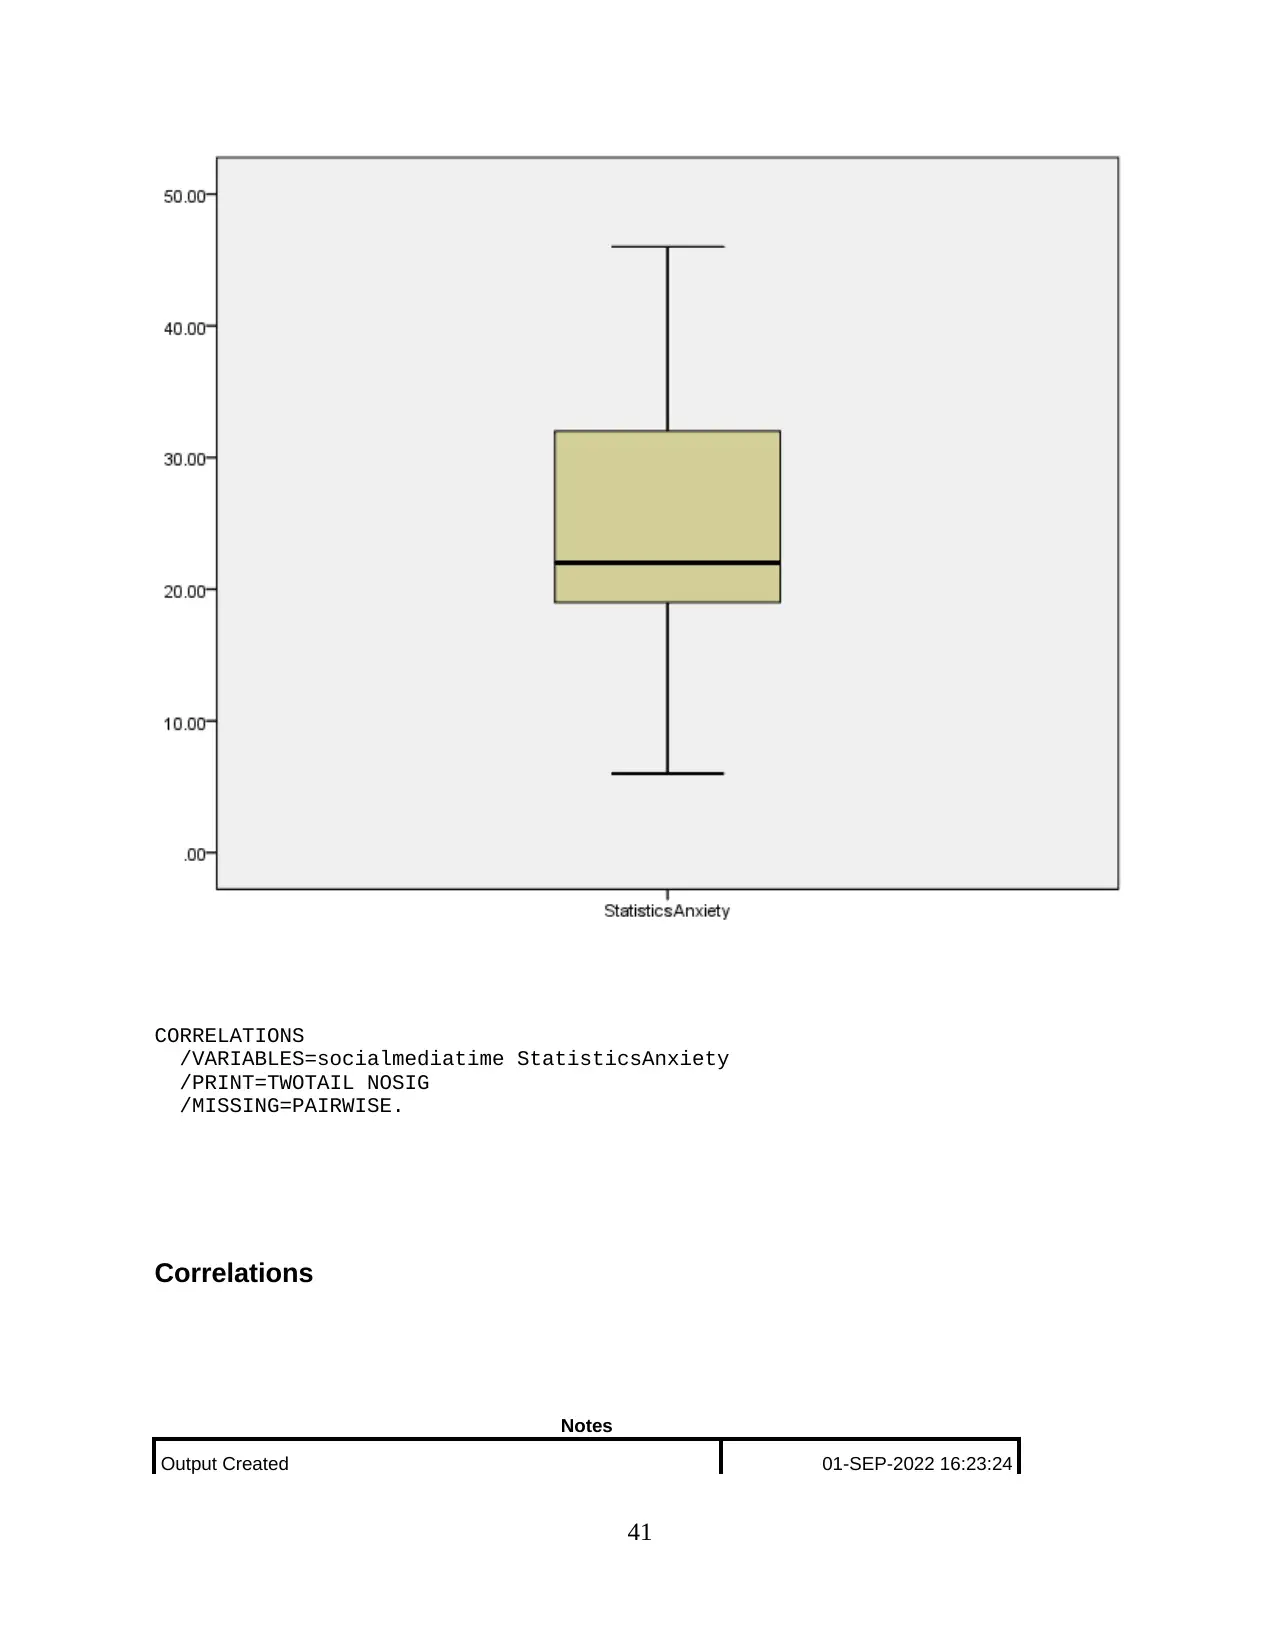
From the evaluation it can be articulated that from the evaluation the values obtained
from the presented table of Tests of Normality which shows that values derived are higher than
0.5. this aids in identifying that there is acceptance of null hypothesis that indicate that the data
of chosen variable is not normally distributed. The main reason behind it can be articulated that
the information is not normally distributed. On the basis of the presented chart it is identified
that the chart is not forming proper trend line that is showing that it is not normally distributed.
This allows to evaluate that their absence of normal distribution.
QUESTION 4
12
Paraphrase This Document
Need a fresh take? Get an instant paraphrase of this document with our AI Paraphraser
Correlations
Social media
time
Statistics
Anxiety
Social media
time
Pearson
Correlation 1 .091
Sig. (2-tailed) .640
N 29 29
Statistics
Anxiety
Pearson
Correlation .091 1
Sig. (2-tailed) .640
N 29 29
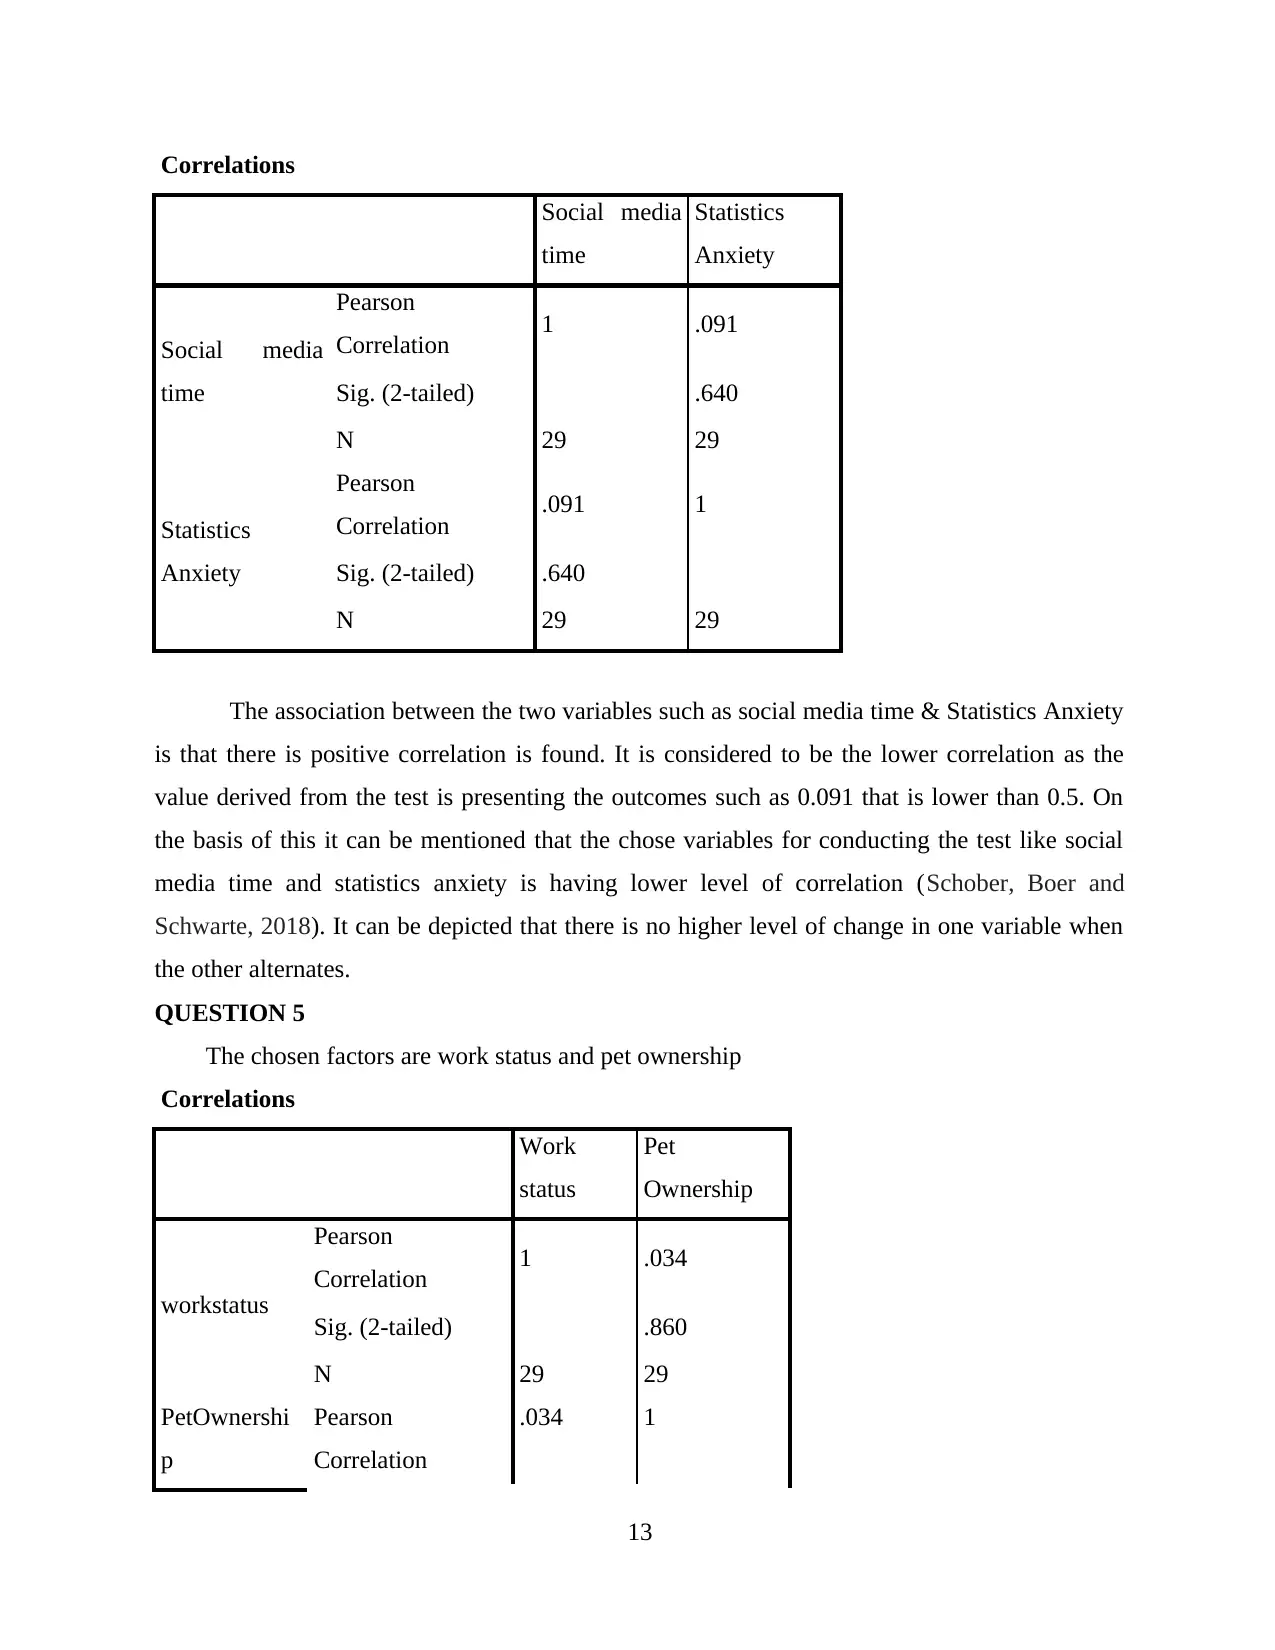
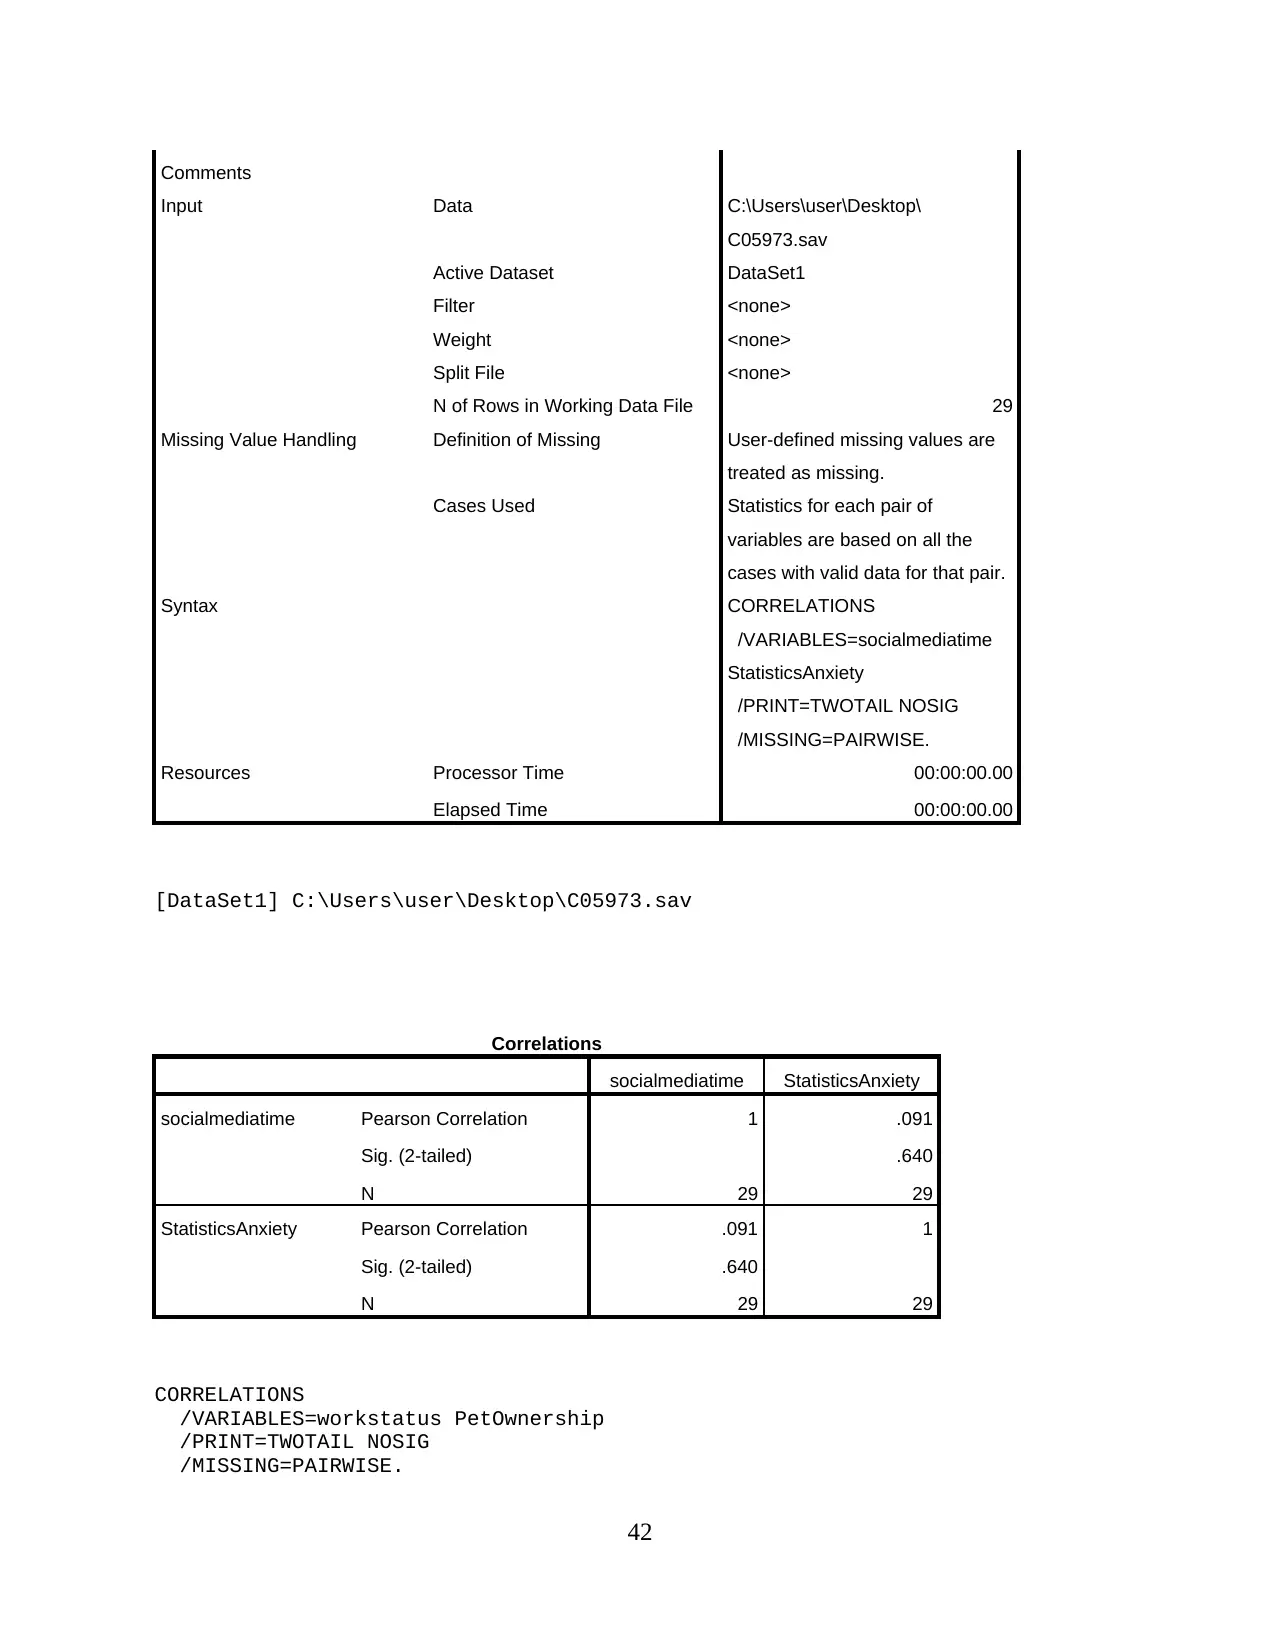
The association between the two variables such as social media time & Statistics Anxiety
is that there is positive correlation is found. It is considered to be the lower correlation as the
value derived from the test is presenting the outcomes such as 0.091 that is lower than 0.5. On
the basis of this it can be mentioned that the chose variables for conducting the test like social
media time and statistics anxiety is having lower level of correlation (Schober, Boer and
Schwarte, 2018). It can be depicted that there is no higher level of change in one variable when
the other alternates.
QUESTION 5
The chosen factors are work status and pet ownership
Correlations
Work
status
Pet
Ownership
workstatus
Pearson
Correlation 1 .034
Sig. (2-tailed) .860
N 29 29
PetOwnershi
p
Pearson
Correlation
.034 1
13
Social media
time
Statistics
Anxiety
Social media
time
Pearson
Correlation 1 .091
Sig. (2-tailed) .640
N 29 29
Statistics
Anxiety
Pearson
Correlation .091 1
Sig. (2-tailed) .640
N 29 29
The association between the two variables such as social media time & Statistics Anxiety
is that there is positive correlation is found. It is considered to be the lower correlation as the
value derived from the test is presenting the outcomes such as 0.091 that is lower than 0.5. On
the basis of this it can be mentioned that the chose variables for conducting the test like social
media time and statistics anxiety is having lower level of correlation (Schober, Boer and
Schwarte, 2018). It can be depicted that there is no higher level of change in one variable when
the other alternates.
QUESTION 5
The chosen factors are work status and pet ownership
Correlations
Work
status
Pet
Ownership
workstatus
Pearson
Correlation 1 .034
Sig. (2-tailed) .860
N 29 29
PetOwnershi
p
Pearson
Correlation
.034 1
13
Sig. (2-tailed) .860
N 29 29
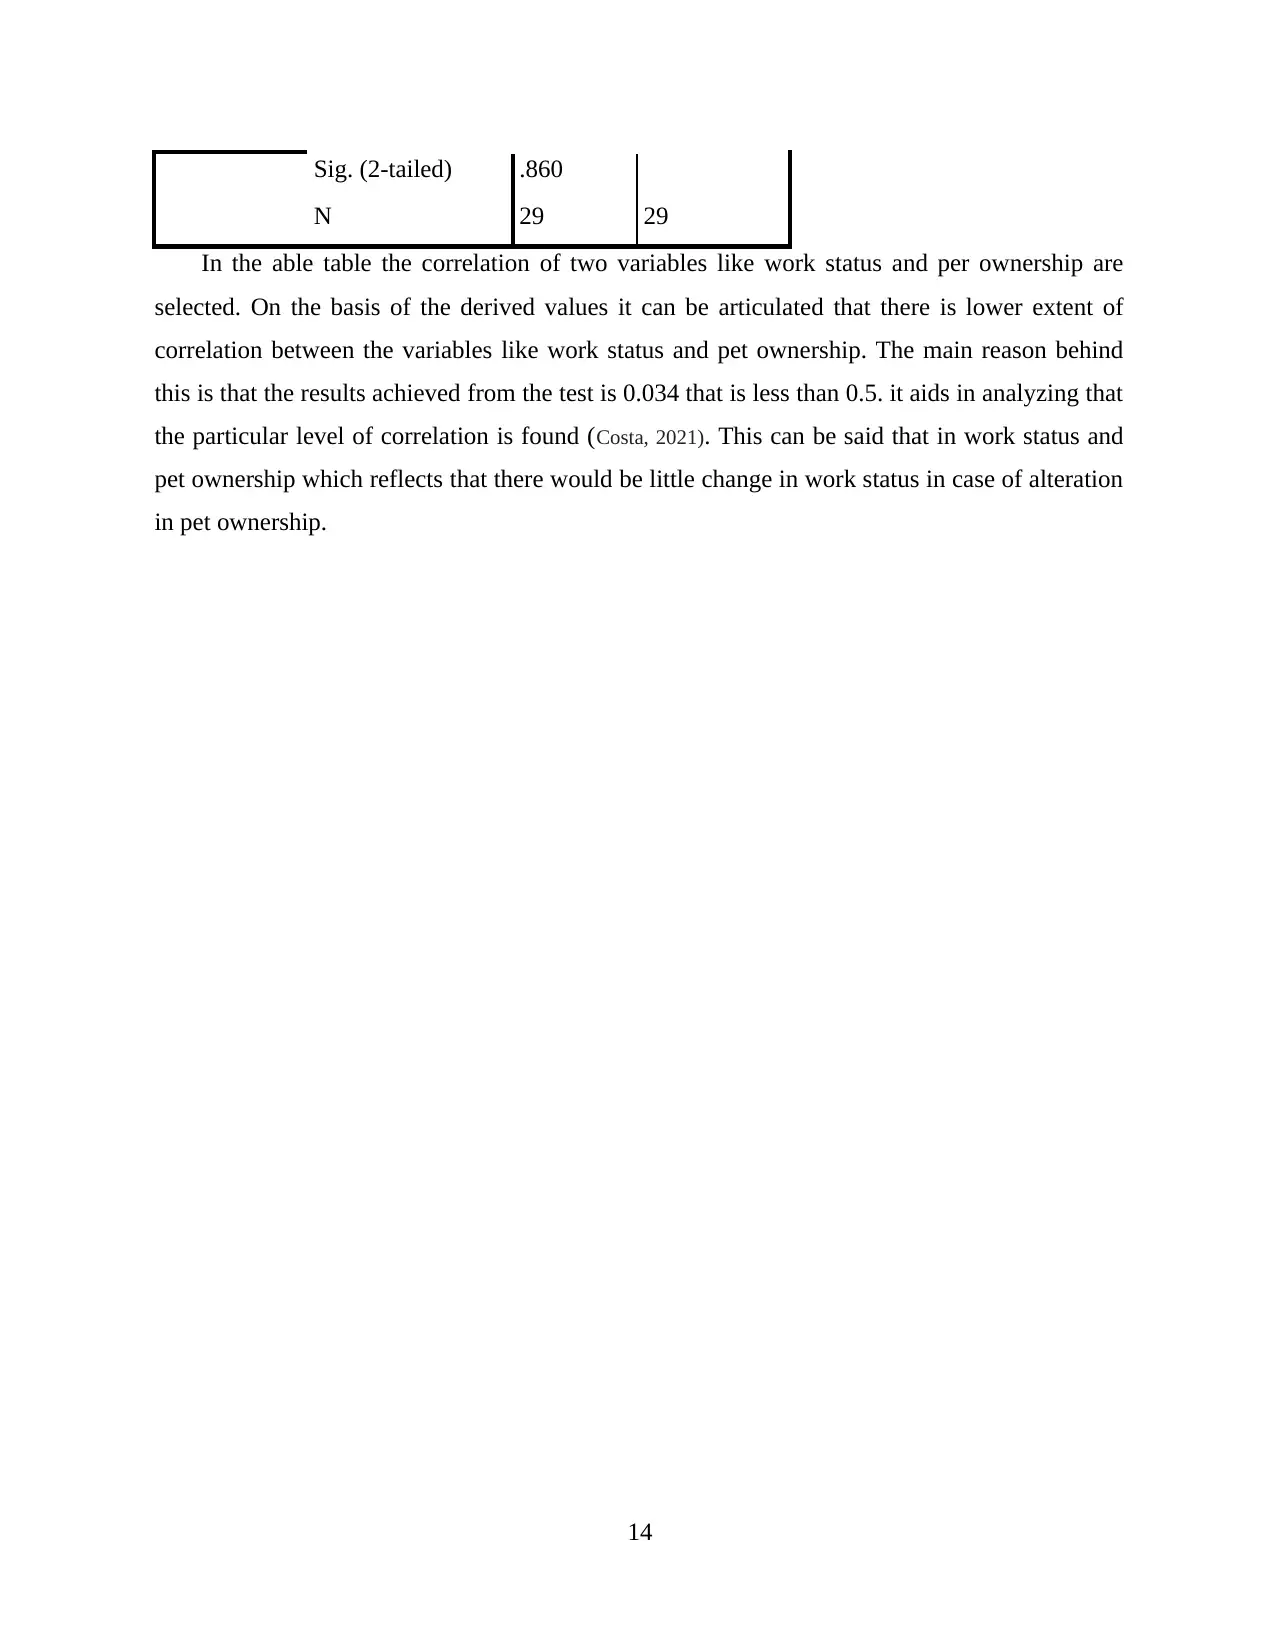
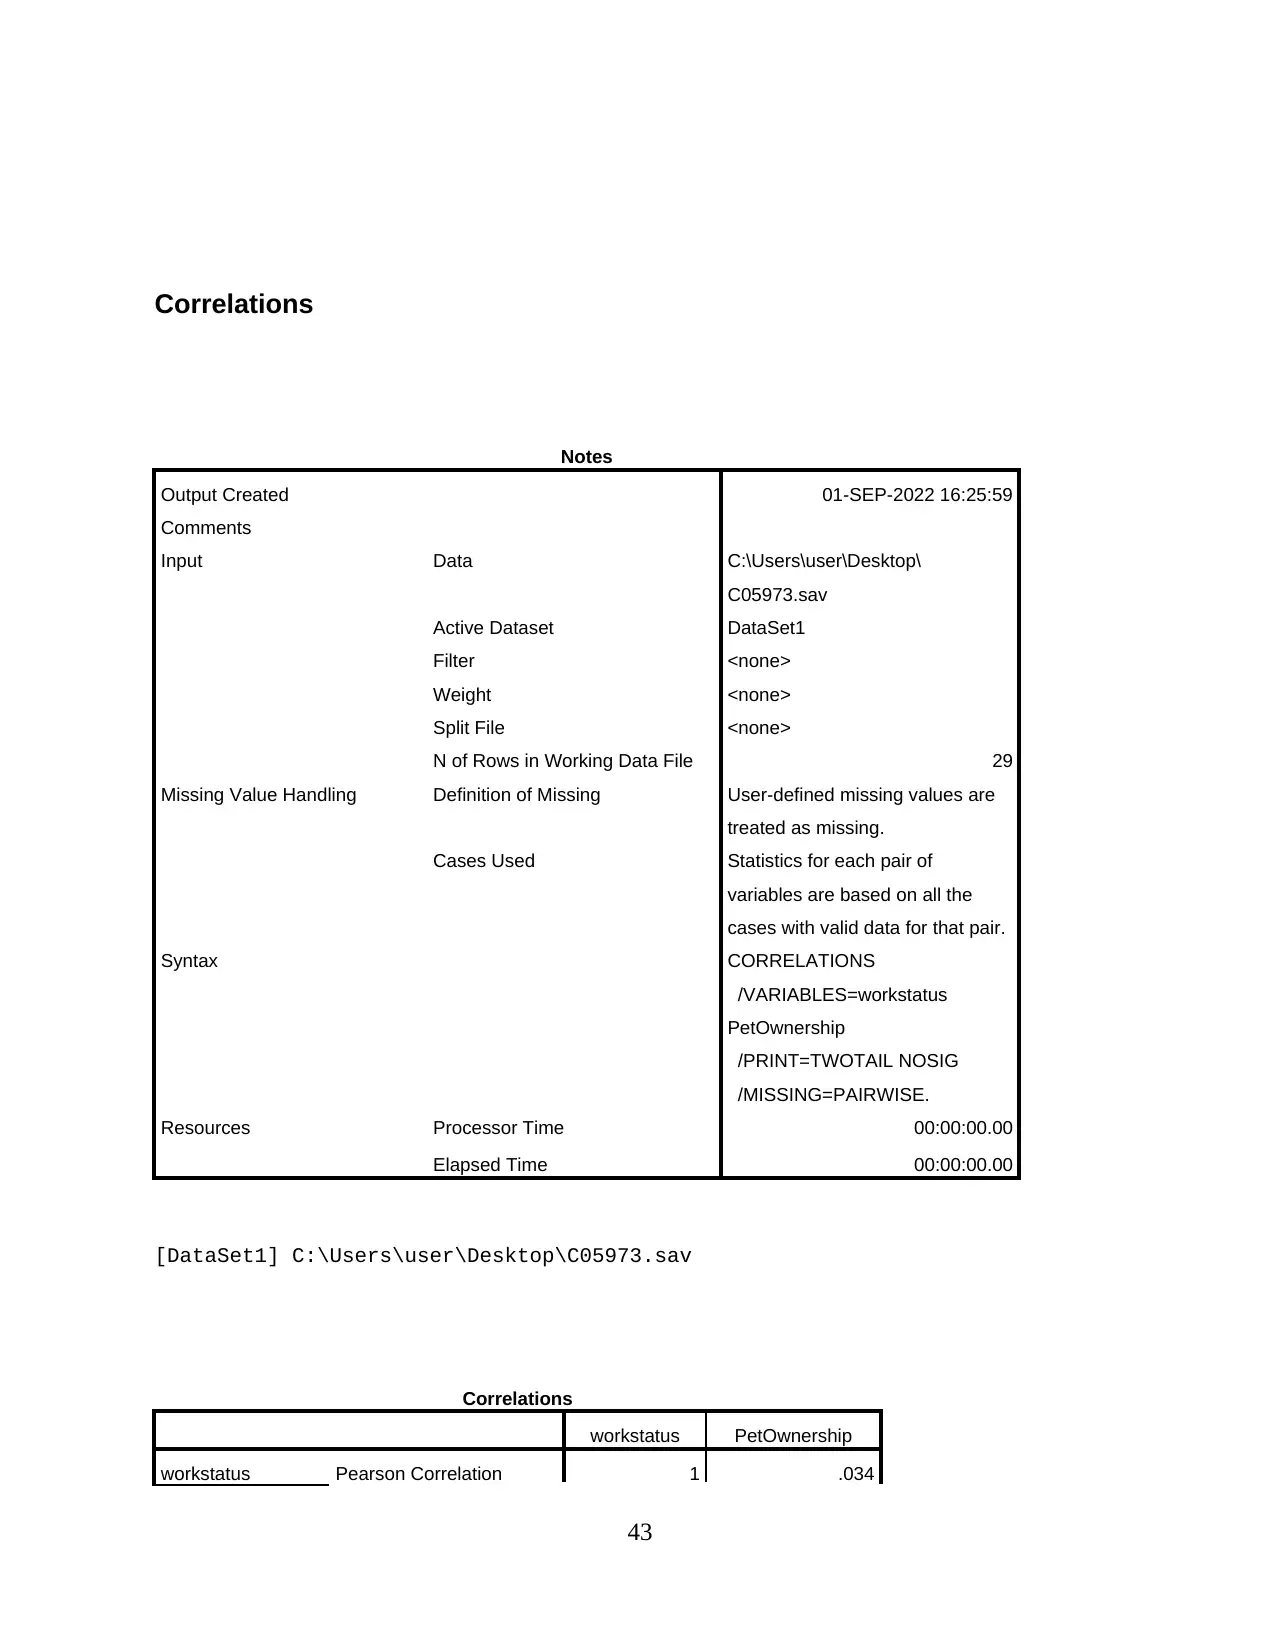
In the able table the correlation of two variables like work status and per ownership are
selected. On the basis of the derived values it can be articulated that there is lower extent of
correlation between the variables like work status and pet ownership. The main reason behind
this is that the results achieved from the test is 0.034 that is less than 0.5. it aids in analyzing that
the particular level of correlation is found (Costa, 2021). This can be said that in work status and
pet ownership which reflects that there would be little change in work status in case of alteration
in pet ownership.
14
N 29 29
In the able table the correlation of two variables like work status and per ownership are
selected. On the basis of the derived values it can be articulated that there is lower extent of
correlation between the variables like work status and pet ownership. The main reason behind
this is that the results achieved from the test is 0.034 that is less than 0.5. it aids in analyzing that
the particular level of correlation is found (Costa, 2021). This can be said that in work status and
pet ownership which reflects that there would be little change in work status in case of alteration
in pet ownership.
14

REFERENCES
Books and Journals
Costa, L.D.F., 2021. Comparing cross correlation-based similarities. arXiv preprint
arXiv:2111.08513.
Schober, P., Boer, C. and Schwarte, L.A., 2018. Correlation coefficients: appropriate use and
interpretation. Anesthesia & Analgesia. 126(5). pp.1763-1768.
15
Books and Journals
Costa, L.D.F., 2021. Comparing cross correlation-based similarities. arXiv preprint
arXiv:2111.08513.
Schober, P., Boer, C. and Schwarte, L.A., 2018. Correlation coefficients: appropriate use and
interpretation. Anesthesia & Analgesia. 126(5). pp.1763-1768.
15
Secure Best Marks with AI Grader
Need help grading? Try our AI Grader for instant feedback on your assignments.
Output
GET
FILE='C:\Users\user\Desktop\C05973.sav'.
DATASET NAME DataSet1 WINDOW=FRONT.
DATASET ACTIVATE DataSet1.
SAVE OUTFILE='C:\Users\user\Desktop\C05973.sav'
/COMPRESSED.
DATASET ACTIVATE DataSet1.
SAVE OUTFILE='C:\Users\user\Desktop\C05973.sav'
/COMPRESSED.
DATASET ACTIVATE DataSet1.
SAVE OUTFILE='C:\Users\user\Desktop\C05973.sav'
/COMPRESSED.
USE ALL.
COMPUTE filter_$=(StatisticsAnxiety>25).
VARIABLE LABELS filter_$ 'StatisticsAnxiety>25 (FILTER)'.
VALUE LABELS filter_$ 0 'Not Selected' 1 'Selected'.
FORMATS filter_$ (f1.0).
FILTER BY filter_$.
EXECUTE.
DATASET ACTIVATE DataSet1.
SAVE OUTFILE='C:\Users\user\Desktop\C05973.sav'
/COMPRESSED.
FREQUENCIES VARIABLES=StatisticsAnxiety_25
/STATISTICS=MINIMUM MAXIMUM
/BARCHART FREQ
/ORDER=ANALYSIS.
Frequencies
Notes
Output Created 01-SEP-2022 15:55:22
Comments
Input Data C:\Users\user\Desktop\
C05973.sav
Active Dataset DataSet1
Filter StatisticsAnxiety>25 (FILTER)
Weight <none>
Split File <none>
16
N of Rows in Working Data File 13
Missing Value Handling Definition of Missing User-defined missing values are
treated as missing.
Cases Used Statistics are based on all cases
with valid data.
Syntax FREQUENCIES
VARIABLES=StatisticsAnxiety_25
/STATISTICS=MINIMUM
MAXIMUM
/BARCHART FREQ
/ORDER=ANALYSIS.
Resources Processor Time 00:00:01.42
Elapsed Time 00:00:05.60
[DataSet1] C:\Users\user\Desktop\C05973.sav
Statistics
StatisticsAnxiety>25 (FILTER)
N Valid 13
Missing 0
Minimum 1
Maximum 1
StatisticsAnxiety>25 (FILTER)
Frequency Percent Valid Percent
Cumulative
Percent
Valid Selected 13 100.0 100.0 100.0
17
CORRELATIONS
/VARIABLES=socialmediatime IQ
/PRINT=TWOTAIL NOSIG
/MISSING=PAIRWISE.
Correlations
Notes
Output Created 01-SEP-2022 15:56:15
18
/VARIABLES=socialmediatime IQ
/PRINT=TWOTAIL NOSIG
/MISSING=PAIRWISE.
Correlations
Notes
Output Created 01-SEP-2022 15:56:15
18
Paraphrase This Document
Need a fresh take? Get an instant paraphrase of this document with our AI Paraphraser
Comments
Input Data C:\Users\user\Desktop\
C05973.sav
Active Dataset DataSet1
Filter StatisticsAnxiety>25 (FILTER)
Weight <none>
Split File <none>
N of Rows in Working Data File 13
Missing Value Handling Definition of Missing User-defined missing values are
treated as missing.
Cases Used Statistics for each pair of
variables are based on all the
cases with valid data for that pair.
Syntax CORRELATIONS
/VARIABLES=socialmediatime
IQ
/PRINT=TWOTAIL NOSIG
/MISSING=PAIRWISE.
Resources Processor Time 00:00:00.02
Elapsed Time 00:00:00.02
[DataSet1] C:\Users\user\Desktop\C05973.sav
Correlations
socialmediatime IQ
socialmediatime Pearson Correlation 1 -.134
Sig. (2-tailed) .664
N 13 13
IQ Pearson Correlation -.134 1
Sig. (2-tailed) .664
N 13 13
* Chart Builder.
GGRAPH
/GRAPHDATASET NAME="graphdataset" VARIABLES=socialmediatime IQ
MISSING=LISTWISE REPORTMISSING=NO
19
/GRAPHSPEC SOURCE=INLINE.
BEGIN GPL
SOURCE: s=userSource(id("graphdataset"))
DATA: socialmediatime=col(source(s), name("socialmediatime"))
DATA: IQ=col(source(s), name("IQ"))
GUIDE: axis(dim(1), label("socialmediatime"))
GUIDE: axis(dim(2), label("IQ"))
ELEMENT: point(position(socialmediatime*IQ))
END GPL.
GGraph
Notes
Output Created 01-SEP-2022 15:57:12
Comments
Input Data C:\Users\user\Desktop\
C05973.sav
Active Dataset DataSet1
Filter StatisticsAnxiety>25 (FILTER)
Weight <none>
Split File <none>
N of Rows in Working Data File 13
20
Syntax GGRAPH
/GRAPHDATASET
NAME="graphdataset"
VARIABLES=socialmediatime IQ
MISSING=LISTWISE
REPORTMISSING=NO
/GRAPHSPEC
SOURCE=INLINE.
BEGIN GPL
SOURCE:
s=userSource(id("graphdataset"))
DATA:
socialmediatime=col(source(s),
name("socialmediatime"))
DATA: IQ=col(source(s),
name("IQ"))
GUIDE: axis(dim(1),
label("socialmediatime"))
GUIDE: axis(dim(2), label("IQ"))
ELEMENT:
point(position(socialmediatime*IQ)
)
END GPL.
Resources Processor Time 00:00:00.33
Elapsed Time 00:00:00.31
[DataSet1] C:\Users\user\Desktop\C05973.sav
21
Secure Best Marks with AI Grader
Need help grading? Try our AI Grader for instant feedback on your assignments.
USE ALL.
COMPUTE filter_$=(PetOwnership = 1).
VARIABLE LABELS filter_$ 'PetOwnership = 1 (FILTER)'.
VALUE LABELS filter_$ 0 'Not Selected' 1 'Selected'.
FORMATS filter_$ (f1.0).
FILTER BY filter_$.
EXECUTE.
DATASET ACTIVATE DataSet1.
SAVE OUTFILE='C:\Users\user\Desktop\C05973.sav'
/COMPRESSED.
USE ALL.
COMPUTE filter_$=(PetOwnership = 1).
VARIABLE LABELS filter_$ 'PetOwnership = 1 (FILTER)'.
VALUE LABELS filter_$ 0 'Not Selected' 1 'Selected'.
FORMATS filter_$ (f1.0).
FILTER BY filter_$.
EXECUTE.
DATASET ACTIVATE DataSet1.
SAVE OUTFILE='C:\Users\user\Desktop\C05973.sav'
/COMPRESSED.
22
COMPUTE filter_$=(PetOwnership = 1).
VARIABLE LABELS filter_$ 'PetOwnership = 1 (FILTER)'.
VALUE LABELS filter_$ 0 'Not Selected' 1 'Selected'.
FORMATS filter_$ (f1.0).
FILTER BY filter_$.
EXECUTE.
DATASET ACTIVATE DataSet1.
SAVE OUTFILE='C:\Users\user\Desktop\C05973.sav'
/COMPRESSED.
USE ALL.
COMPUTE filter_$=(PetOwnership = 1).
VARIABLE LABELS filter_$ 'PetOwnership = 1 (FILTER)'.
VALUE LABELS filter_$ 0 'Not Selected' 1 'Selected'.
FORMATS filter_$ (f1.0).
FILTER BY filter_$.
EXECUTE.
DATASET ACTIVATE DataSet1.
SAVE OUTFILE='C:\Users\user\Desktop\C05973.sav'
/COMPRESSED.
22
FREQUENCIES VARIABLES=PetOwnership_1
/STATISTICS=STDDEV MINIMUM MAXIMUM MEAN MEDIAN MODE SUM
/BARCHART FREQ
/ORDER=ANALYSIS.
Frequencies
Notes
Output Created 01-SEP-2022 16:00:48
Comments
Input Data C:\Users\user\Desktop\
C05973.sav
Active Dataset DataSet1
Filter <none>
Weight <none>
Split File <none>
N of Rows in Working Data File 29
Missing Value Handling Definition of Missing User-defined missing values are
treated as missing.
Cases Used Statistics are based on all cases
with valid data.
Syntax FREQUENCIES
VARIABLES=PetOwnership_1
/STATISTICS=STDDEV
MINIMUM MAXIMUM MEAN
MEDIAN MODE SUM
/BARCHART FREQ
/ORDER=ANALYSIS.
Resources Processor Time 00:00:00.17
Elapsed Time 00:00:00.16
[DataSet1] C:\Users\user\Desktop\C05973.sav
23
Statistics
PetOwnership = 1 (FILTER)
N Valid 29
Missing 0
Mean .48
Median .00
Mode 0
Std. Deviation .509
Minimum 0
Maximum 1
Sum 14
PetOwnership = 1 (FILTER)
Frequency Percent Valid Percent
Cumulative
Percent
Valid Not Selected 15 51.7 51.7 51.7
Selected 14 48.3 48.3 100.0
Total 29 100.0 100.0
24
PetOwnership = 1 (FILTER)
N Valid 29
Missing 0
Mean .48
Median .00
Mode 0
Std. Deviation .509
Minimum 0
Maximum 1
Sum 14
PetOwnership = 1 (FILTER)
Frequency Percent Valid Percent
Cumulative
Percent
Valid Not Selected 15 51.7 51.7 51.7
Selected 14 48.3 48.3 100.0
Total 29 100.0 100.0
24
Paraphrase This Document
Need a fresh take? Get an instant paraphrase of this document with our AI Paraphraser
Frequencies
Notes
Output Created 01-SEP-2022 16:02:27
Comments
Input Data C:\Users\user\Desktop\
C05973.sav
Active Dataset DataSet1
Filter <none>
Weight <none>
25
Notes
Output Created 01-SEP-2022 16:02:27
Comments
Input Data C:\Users\user\Desktop\
C05973.sav
Active Dataset DataSet1
Filter <none>
Weight <none>
25
Split File <none>
N of Rows in Working Data File 29
Missing Value Handling Definition of Missing User-defined missing values are
treated as missing.
Cases Used Statistics are based on all cases
with valid data.
Syntax FREQUENCIES
VARIABLES=PetOwnership_1
/FORMAT=NOTABLE
/STATISTICS=STDDEV
MINIMUM MAXIMUM MEAN
MEDIAN MODE SUM
/BARCHART FREQ
/ORDER=ANALYSIS.
Resources Processor Time 00:00:00.20
Elapsed Time 00:00:00.17
[DataSet1] C:\Users\user\Desktop\C05973.sav
Statistics
PetOwnership = 1 (FILTER)
N Valid 29
Missing 0
Mean .48
Median .00
Mode 0
Std. Deviation .509
Minimum 0
Maximum 1
Sum 14
26
RECODE workstatus (2=1) (1=2) (3=2) (4=2) INTO Work_status.
VARIABLE LABELS Work_status 'Work_status'.
EXECUTE.
DATASET ACTIVATE DataSet1.
SAVE OUTFILE='C:\Users\user\Desktop\C05973.sav'
/COMPRESSED.
FREQUENCIES VARIABLES=socialmediatime Work_status
/FORMAT=NOTABLE
/STATISTICS=STDDEV MINIMUM MAXIMUM MEAN MEDIAN MODE SUM
/BARCHART FREQ
/ORDER=ANALYSIS.
Frequencies
27
Secure Best Marks with AI Grader
Need help grading? Try our AI Grader for instant feedback on your assignments.
Notes
Output Created 01-SEP-2022 16:09:49
Comments
Input Data C:\Users\user\Desktop\
C05973.sav
Active Dataset DataSet1
Filter <none>
Weight <none>
Split File <none>
N of Rows in Working Data File 29
Missing Value Handling Definition of Missing User-defined missing values are
treated as missing.
Cases Used Statistics are based on all cases
with valid data.
Syntax FREQUENCIES
VARIABLES=socialmediatime
Work_status
/FORMAT=NOTABLE
/STATISTICS=STDDEV
MINIMUM MAXIMUM MEAN
MEDIAN MODE SUM
/BARCHART FREQ
/ORDER=ANALYSIS.
Resources Processor Time 00:00:00.34
Elapsed Time 00:00:00.31
[DataSet1] C:\Users\user\Desktop\C05973.sav
Statistics
socialmediatime Work_status
N Valid 29 29
Missing 0 0
Mean 34.0690 1.6552
Median 32.0000 2.0000
28
Mode 39.00 2.00
Std. Deviation 21.68925 .48373
Minimum 4.00 1.00
Maximum 115.00 2.00
Sum 988.00 48.00
Bar Chart
29
Std. Deviation 21.68925 .48373
Minimum 4.00 1.00
Maximum 115.00 2.00
Sum 988.00 48.00
Bar Chart
29
FREQUENCIES VARIABLES=socialmediatime Work_status
/FORMAT=NOTABLE
/STATISTICS=STDDEV MINIMUM MAXIMUM MEAN MEDIAN MODE SUM
/BARCHART FREQ
/ORDER=ANALYSIS.
Frequencies
Notes
Output Created 01-SEP-2022 16:10:08
30
/FORMAT=NOTABLE
/STATISTICS=STDDEV MINIMUM MAXIMUM MEAN MEDIAN MODE SUM
/BARCHART FREQ
/ORDER=ANALYSIS.
Frequencies
Notes
Output Created 01-SEP-2022 16:10:08
30
Paraphrase This Document
Need a fresh take? Get an instant paraphrase of this document with our AI Paraphraser
Comments
Input Data C:\Users\user\Desktop\
C05973.sav
Active Dataset DataSet1
Filter <none>
Weight <none>
Split File <none>
N of Rows in Working Data File 29
Missing Value Handling Definition of Missing User-defined missing values are
treated as missing.
Cases Used Statistics are based on all cases
with valid data.
Syntax FREQUENCIES
VARIABLES=socialmediatime
Work_status
/FORMAT=NOTABLE
/STATISTICS=STDDEV
MINIMUM MAXIMUM MEAN
MEDIAN MODE SUM
/BARCHART FREQ
/ORDER=ANALYSIS.
Resources Processor Time 00:00:00.33
Elapsed Time 00:00:00.31
[DataSet1] C:\Users\user\Desktop\C05973.sav
Statistics
socialmediatime Work_status
N Valid 29 29
Missing 0 0
Mean 34.0690 1.6552
Median 32.0000 2.0000
Mode 39.00 2.00
Std. Deviation 21.68925 .48373
Minimum 4.00 1.00
Maximum 115.00 2.00
31
Sum 988.00 48.00
Bar Chart
32
Bar Chart
32
COMPUTE Score=StatisticsAnxiety + IQ.
EXECUTE.
DATASET ACTIVATE DataSet1.
SAVE OUTFILE='C:\Users\user\Desktop\C05973.sav'
/COMPRESSED.
FREQUENCIES VARIABLES=Score
/FORMAT=NOTABLE
/STATISTICS=STDDEV MINIMUM MAXIMUM MEAN MEDIAN MODE SUM
/BARCHART FREQ
/ORDER=ANALYSIS.
Frequencies
33
EXECUTE.
DATASET ACTIVATE DataSet1.
SAVE OUTFILE='C:\Users\user\Desktop\C05973.sav'
/COMPRESSED.
FREQUENCIES VARIABLES=Score
/FORMAT=NOTABLE
/STATISTICS=STDDEV MINIMUM MAXIMUM MEAN MEDIAN MODE SUM
/BARCHART FREQ
/ORDER=ANALYSIS.
Frequencies
33
Secure Best Marks with AI Grader
Need help grading? Try our AI Grader for instant feedback on your assignments.
Notes
Output Created 01-SEP-2022 16:13:27
Comments
Input Data C:\Users\user\Desktop\
C05973.sav
Active Dataset DataSet1
Filter <none>
Weight <none>
Split File <none>
N of Rows in Working Data File 29
Missing Value Handling Definition of Missing User-defined missing values are
treated as missing.
Cases Used Statistics are based on all cases
with valid data.
Syntax FREQUENCIES
VARIABLES=Score
/FORMAT=NOTABLE
/STATISTICS=STDDEV
MINIMUM MAXIMUM MEAN
MEDIAN MODE SUM
/BARCHART FREQ
/ORDER=ANALYSIS.
Resources Processor Time 00:00:00.16
Elapsed Time 00:00:00.14
[DataSet1] C:\Users\user\Desktop\C05973.sav
Statistics
Score
N Valid 29
Missing 0
Mean 120.9310
Median 119.0000
Mode 94.00a
34
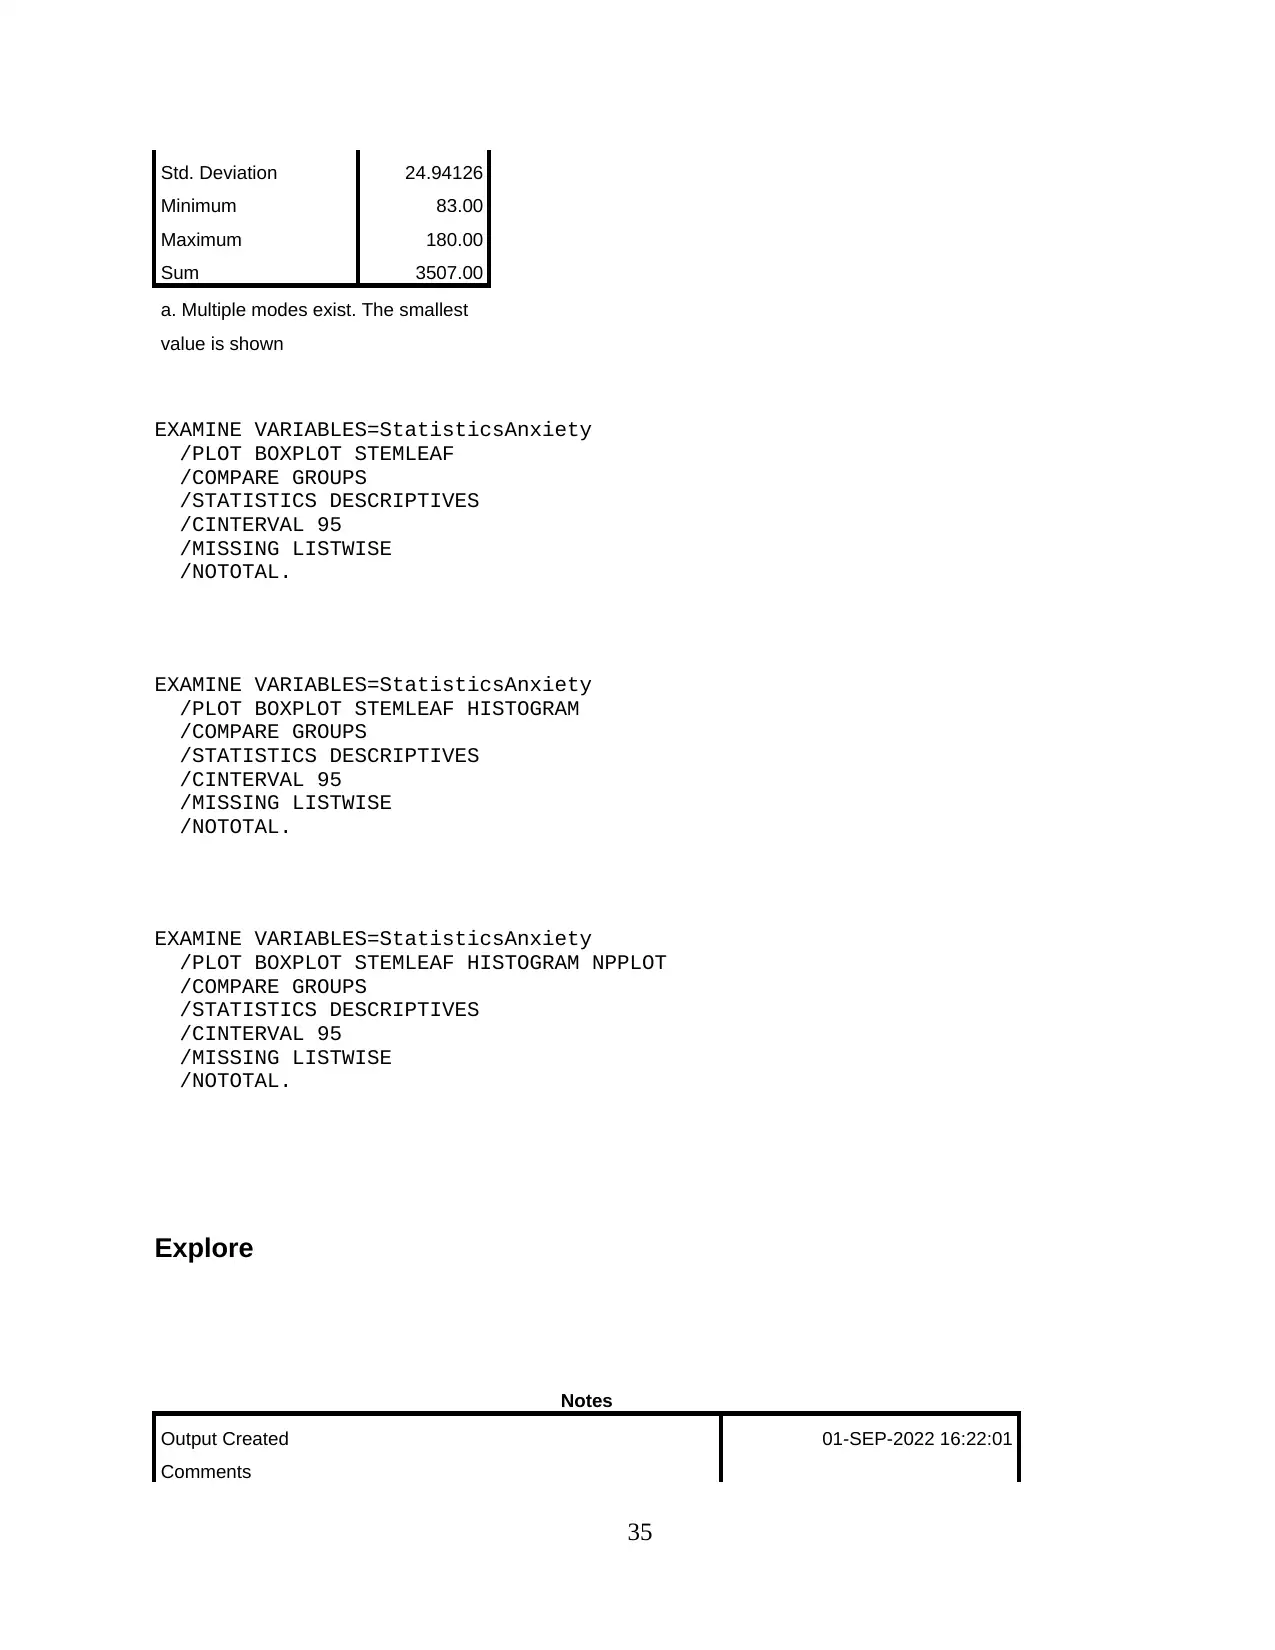
Std. Deviation 24.94126
Minimum 83.00
Maximum 180.00
Sum 3507.00
a. Multiple modes exist. The smallest
value is shown
EXAMINE VARIABLES=StatisticsAnxiety
/PLOT BOXPLOT STEMLEAF
/COMPARE GROUPS
/STATISTICS DESCRIPTIVES
/CINTERVAL 95
/MISSING LISTWISE
/NOTOTAL.
EXAMINE VARIABLES=StatisticsAnxiety
/PLOT BOXPLOT STEMLEAF HISTOGRAM
/COMPARE GROUPS
/STATISTICS DESCRIPTIVES
/CINTERVAL 95
/MISSING LISTWISE
/NOTOTAL.
EXAMINE VARIABLES=StatisticsAnxiety
/PLOT BOXPLOT STEMLEAF HISTOGRAM NPPLOT
/COMPARE GROUPS
/STATISTICS DESCRIPTIVES
/CINTERVAL 95
/MISSING LISTWISE
/NOTOTAL.
Explore
Notes
Output Created 01-SEP-2022 16:22:01
Comments
35
Input Data C:\Users\user\Desktop\
C05973.sav
Active Dataset DataSet1
Filter <none>
Weight <none>
Split File <none>
N of Rows in Working Data File 29
Missing Value Handling Definition of Missing User-defined missing values for
dependent variables are treated
as missing.
Cases Used Statistics are based on cases with
no missing values for any
dependent variable or factor used.
Syntax EXAMINE
VARIABLES=StatisticsAnxiety
/PLOT BOXPLOT STEMLEAF
HISTOGRAM NPPLOT
/COMPARE GROUPS
/STATISTICS DESCRIPTIVES
/CINTERVAL 95
/MISSING LISTWISE
/NOTOTAL.
Resources Processor Time 00:00:00.55
Elapsed Time 00:00:00.63
[DataSet1] C:\Users\user\Desktop\C05973.sav
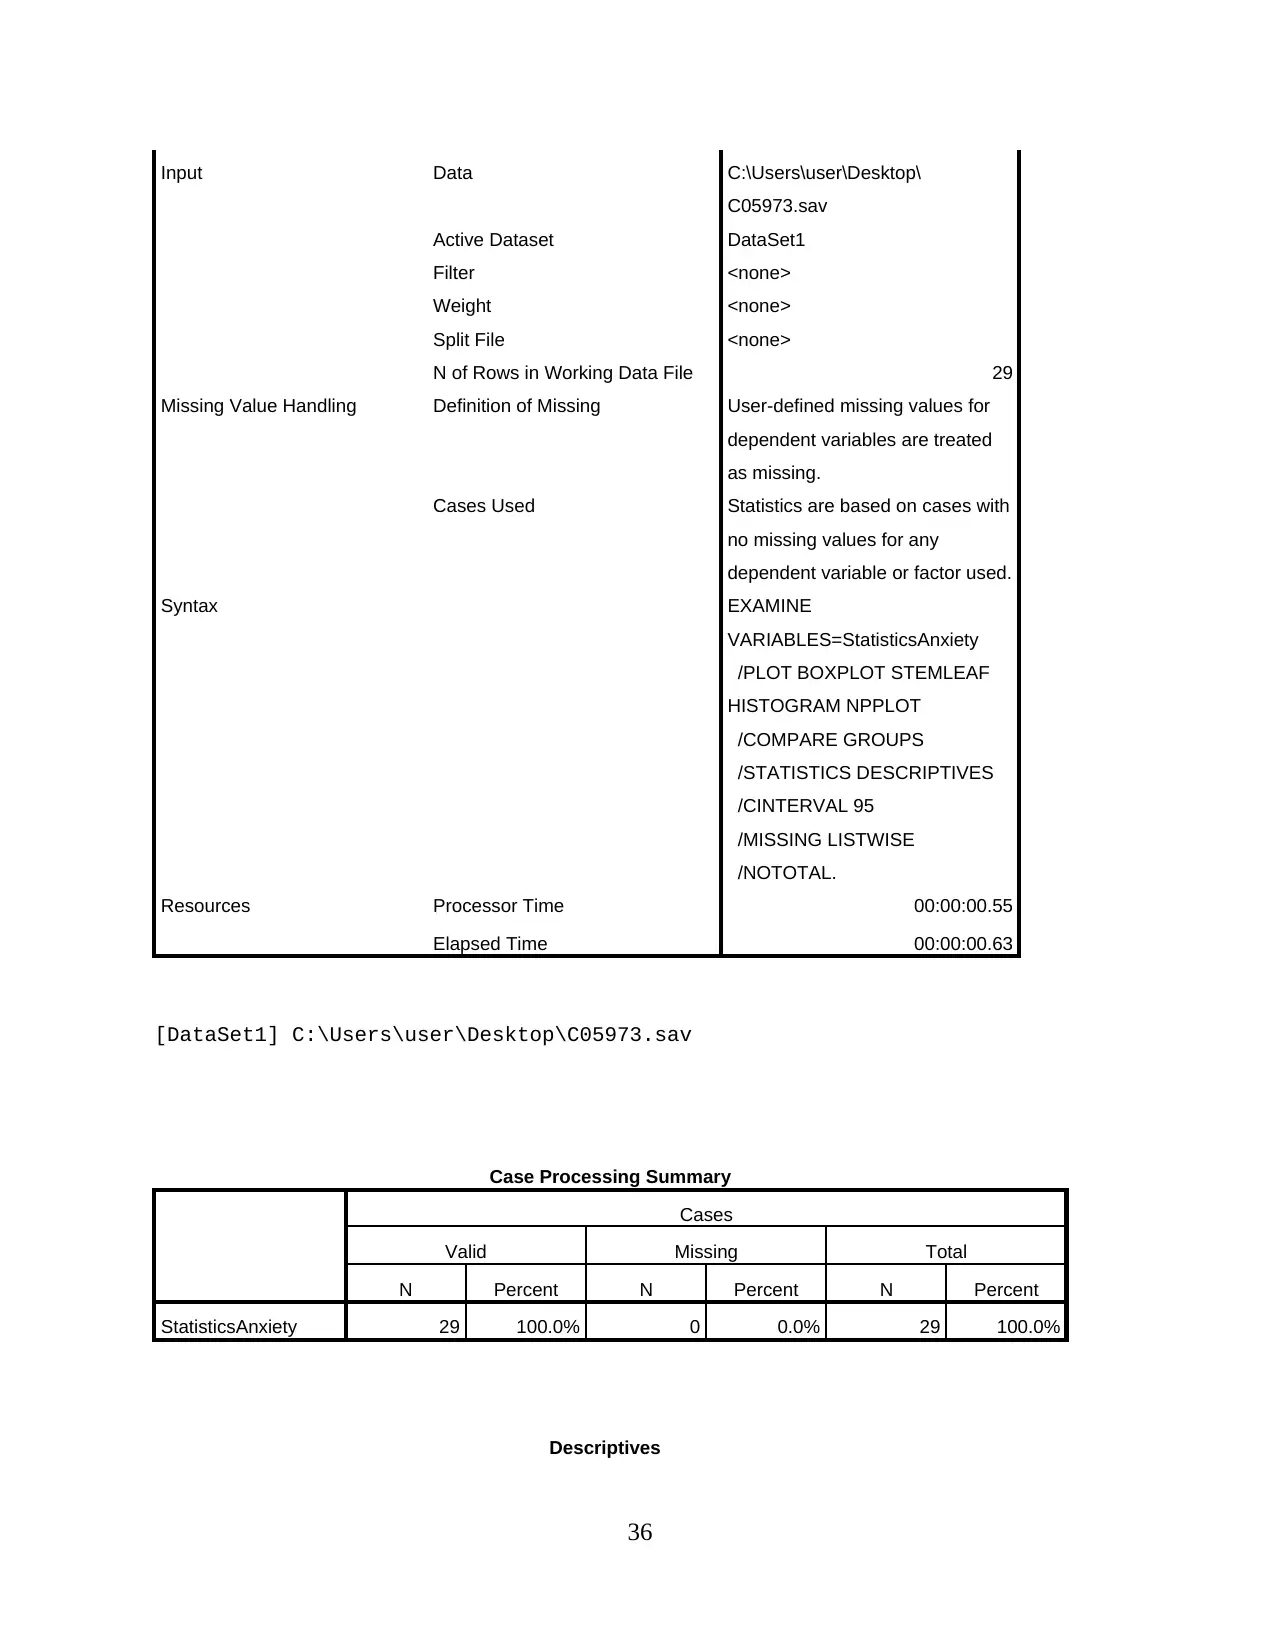
Case Processing Summary
Cases
Valid Missing Total
N Percent N Percent N Percent
StatisticsAnxiety 29 100.0% 0 0.0% 29 100.0%
Descriptives
36
C05973.sav
Active Dataset DataSet1
Filter <none>
Weight <none>
Split File <none>
N of Rows in Working Data File 29
Missing Value Handling Definition of Missing User-defined missing values for
dependent variables are treated
as missing.
Cases Used Statistics are based on cases with
no missing values for any
dependent variable or factor used.
Syntax EXAMINE
VARIABLES=StatisticsAnxiety
/PLOT BOXPLOT STEMLEAF
HISTOGRAM NPPLOT
/COMPARE GROUPS
/STATISTICS DESCRIPTIVES
/CINTERVAL 95
/MISSING LISTWISE
/NOTOTAL.
Resources Processor Time 00:00:00.55
Elapsed Time 00:00:00.63
[DataSet1] C:\Users\user\Desktop\C05973.sav
Case Processing Summary
Cases
Valid Missing Total
N Percent N Percent N Percent
StatisticsAnxiety 29 100.0% 0 0.0% 29 100.0%
Descriptives
36
Paraphrase This Document
Need a fresh take? Get an instant paraphrase of this document with our AI Paraphraser
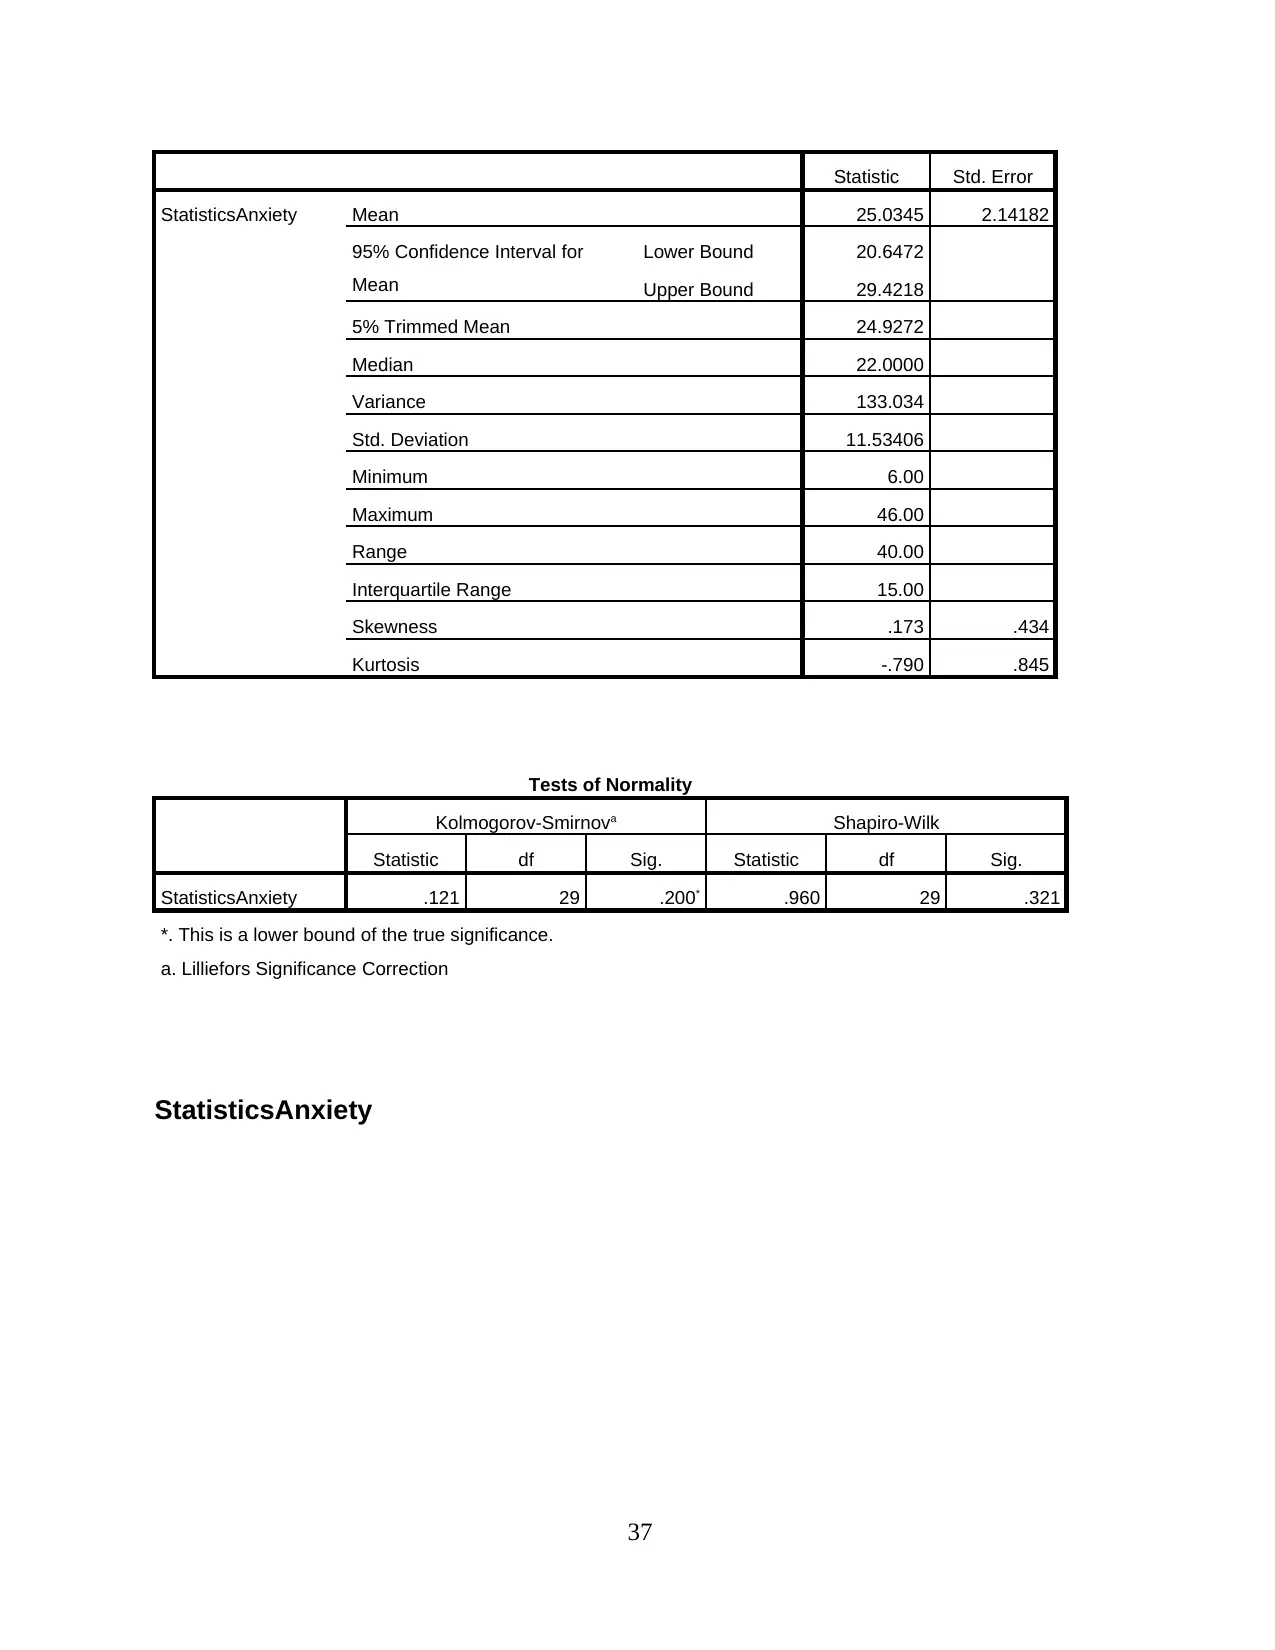
Statistic Std. Error
StatisticsAnxiety Mean 25.0345 2.14182
95% Confidence Interval for
Mean
Lower Bound 20.6472
Upper Bound 29.4218
5% Trimmed Mean 24.9272
Median 22.0000
Variance 133.034
Std. Deviation 11.53406
Minimum 6.00
Maximum 46.00
Range 40.00
Interquartile Range 15.00
Skewness .173 .434
Kurtosis -.790 .845
Tests of Normality
Kolmogorov-Smirnova Shapiro-Wilk
Statistic df Sig. Statistic df Sig.
StatisticsAnxiety .121 29 .200* .960 29 .321
*. This is a lower bound of the true significance.
a. Lilliefors Significance Correction
StatisticsAnxiety
37
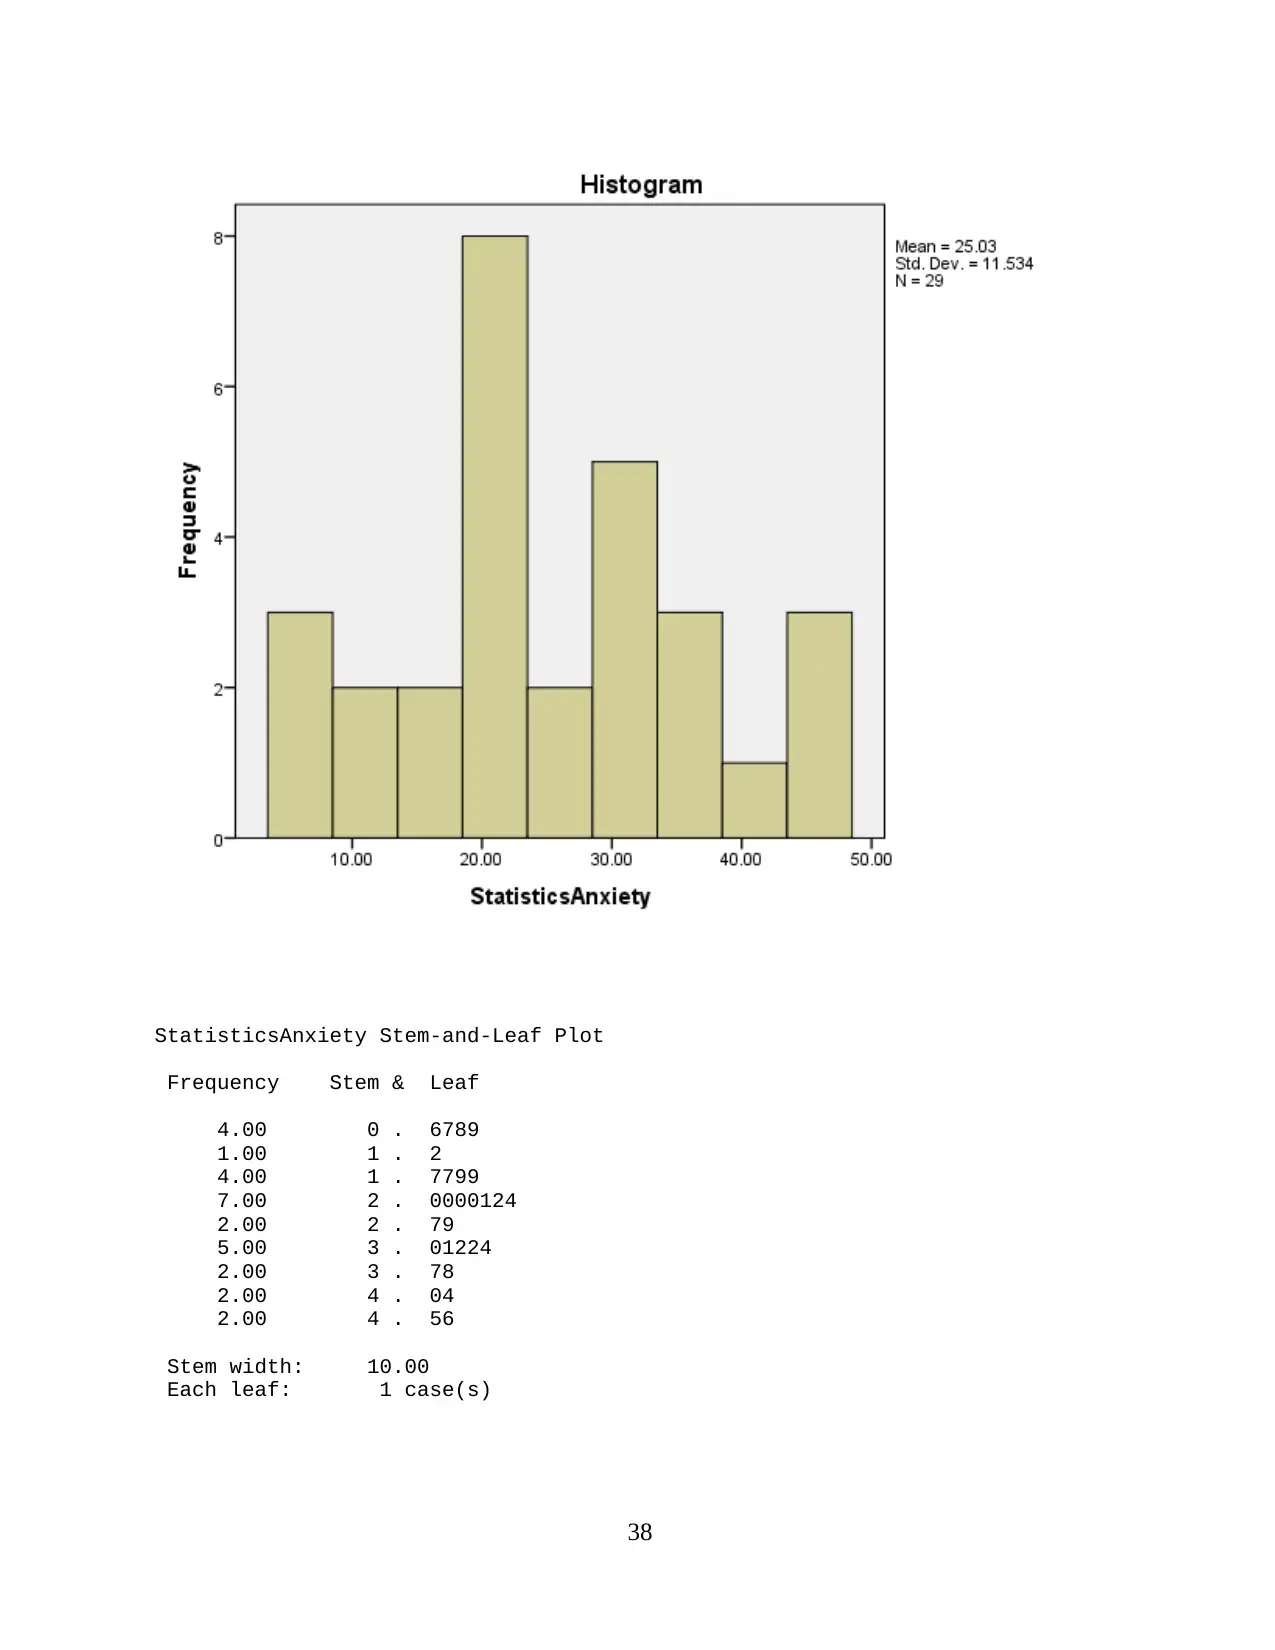
StatisticsAnxiety Stem-and-Leaf Plot
Frequency Stem & Leaf
4.00 0 . 6789
1.00 1 . 2
4.00 1 . 7799
7.00 2 . 0000124
2.00 2 . 79
5.00 3 . 01224
2.00 3 . 78
2.00 4 . 04
2.00 4 . 56
Stem width: 10.00
Each leaf: 1 case(s)
38
Frequency Stem & Leaf
4.00 0 . 6789
1.00 1 . 2
4.00 1 . 7799
7.00 2 . 0000124
2.00 2 . 79
5.00 3 . 01224
2.00 3 . 78
2.00 4 . 04
2.00 4 . 56
Stem width: 10.00
Each leaf: 1 case(s)
38
39
Secure Best Marks with AI Grader
Need help grading? Try our AI Grader for instant feedback on your assignments.
40
CORRELATIONS
/VARIABLES=socialmediatime StatisticsAnxiety
/PRINT=TWOTAIL NOSIG
/MISSING=PAIRWISE.
Correlations
Notes
Output Created 01-SEP-2022 16:23:24
41
/VARIABLES=socialmediatime StatisticsAnxiety
/PRINT=TWOTAIL NOSIG
/MISSING=PAIRWISE.
Correlations
Notes
Output Created 01-SEP-2022 16:23:24
41
Comments
Input Data C:\Users\user\Desktop\
C05973.sav
Active Dataset DataSet1
Filter <none>
Weight <none>
Split File <none>
N of Rows in Working Data File 29
Missing Value Handling Definition of Missing User-defined missing values are
treated as missing.
Cases Used Statistics for each pair of
variables are based on all the
cases with valid data for that pair.
Syntax CORRELATIONS
/VARIABLES=socialmediatime
StatisticsAnxiety
/PRINT=TWOTAIL NOSIG
/MISSING=PAIRWISE.
Resources Processor Time 00:00:00.00
Elapsed Time 00:00:00.00
[DataSet1] C:\Users\user\Desktop\C05973.sav
Correlations
socialmediatime StatisticsAnxiety
socialmediatime Pearson Correlation 1 .091
Sig. (2-tailed) .640
N 29 29
StatisticsAnxiety Pearson Correlation .091 1
Sig. (2-tailed) .640
N 29 29
CORRELATIONS
/VARIABLES=workstatus PetOwnership
/PRINT=TWOTAIL NOSIG
/MISSING=PAIRWISE.
42
Paraphrase This Document
Need a fresh take? Get an instant paraphrase of this document with our AI Paraphraser
Correlations
Notes
Output Created 01-SEP-2022 16:25:59
Comments
Input Data C:\Users\user\Desktop\
C05973.sav
Active Dataset DataSet1
Filter <none>
Weight <none>
Split File <none>
N of Rows in Working Data File 29
Missing Value Handling Definition of Missing User-defined missing values are
treated as missing.
Cases Used Statistics for each pair of
variables are based on all the
cases with valid data for that pair.
Syntax CORRELATIONS
/VARIABLES=workstatus
PetOwnership
/PRINT=TWOTAIL NOSIG
/MISSING=PAIRWISE.
Resources Processor Time 00:00:00.00
Elapsed Time 00:00:00.00
[DataSet1] C:\Users\user\Desktop\C05973.sav
Correlations
workstatus PetOwnership
workstatus Pearson Correlation 1 .034
43
Sig. (2-tailed) .860
N 29 29
PetOwnership Pearson Correlation .034 1
Sig. (2-tailed) .860
N 29 29
NEW FILE.
DATASET NAME DataSet2 WINDOW=FRONT.
SAVE OUTFILE='C:\Users\user\Desktop\C05973-Q1.sav'
/COMPRESSED.
FREQUENCIES VARIABLES=Financial_awareness
Anxiety_for_financial_decision_making Stable_income
Prevailing_working_environment_of_company Ability_to_pay_debts
/FORMAT=NOTABLE
/ORDER=ANALYSIS.
Frequencies
Notes
Output Created 01-SEP-2022 17:11:26
Comments
Input Data C:\Users\user\Desktop\C05973-
Q1.sav
Active Dataset DataSet2
Filter <none>
Weight <none>
Split File <none>
N of Rows in Working Data File 29
Missing Value Handling Definition of Missing User-defined missing values are
treated as missing.
Cases Used Statistics are based on all cases
with valid data.
44
N 29 29
PetOwnership Pearson Correlation .034 1
Sig. (2-tailed) .860
N 29 29
NEW FILE.
DATASET NAME DataSet2 WINDOW=FRONT.
SAVE OUTFILE='C:\Users\user\Desktop\C05973-Q1.sav'
/COMPRESSED.
FREQUENCIES VARIABLES=Financial_awareness
Anxiety_for_financial_decision_making Stable_income
Prevailing_working_environment_of_company Ability_to_pay_debts
/FORMAT=NOTABLE
/ORDER=ANALYSIS.
Frequencies
Notes
Output Created 01-SEP-2022 17:11:26
Comments
Input Data C:\Users\user\Desktop\C05973-
Q1.sav
Active Dataset DataSet2
Filter <none>
Weight <none>
Split File <none>
N of Rows in Working Data File 29
Missing Value Handling Definition of Missing User-defined missing values are
treated as missing.
Cases Used Statistics are based on all cases
with valid data.
44
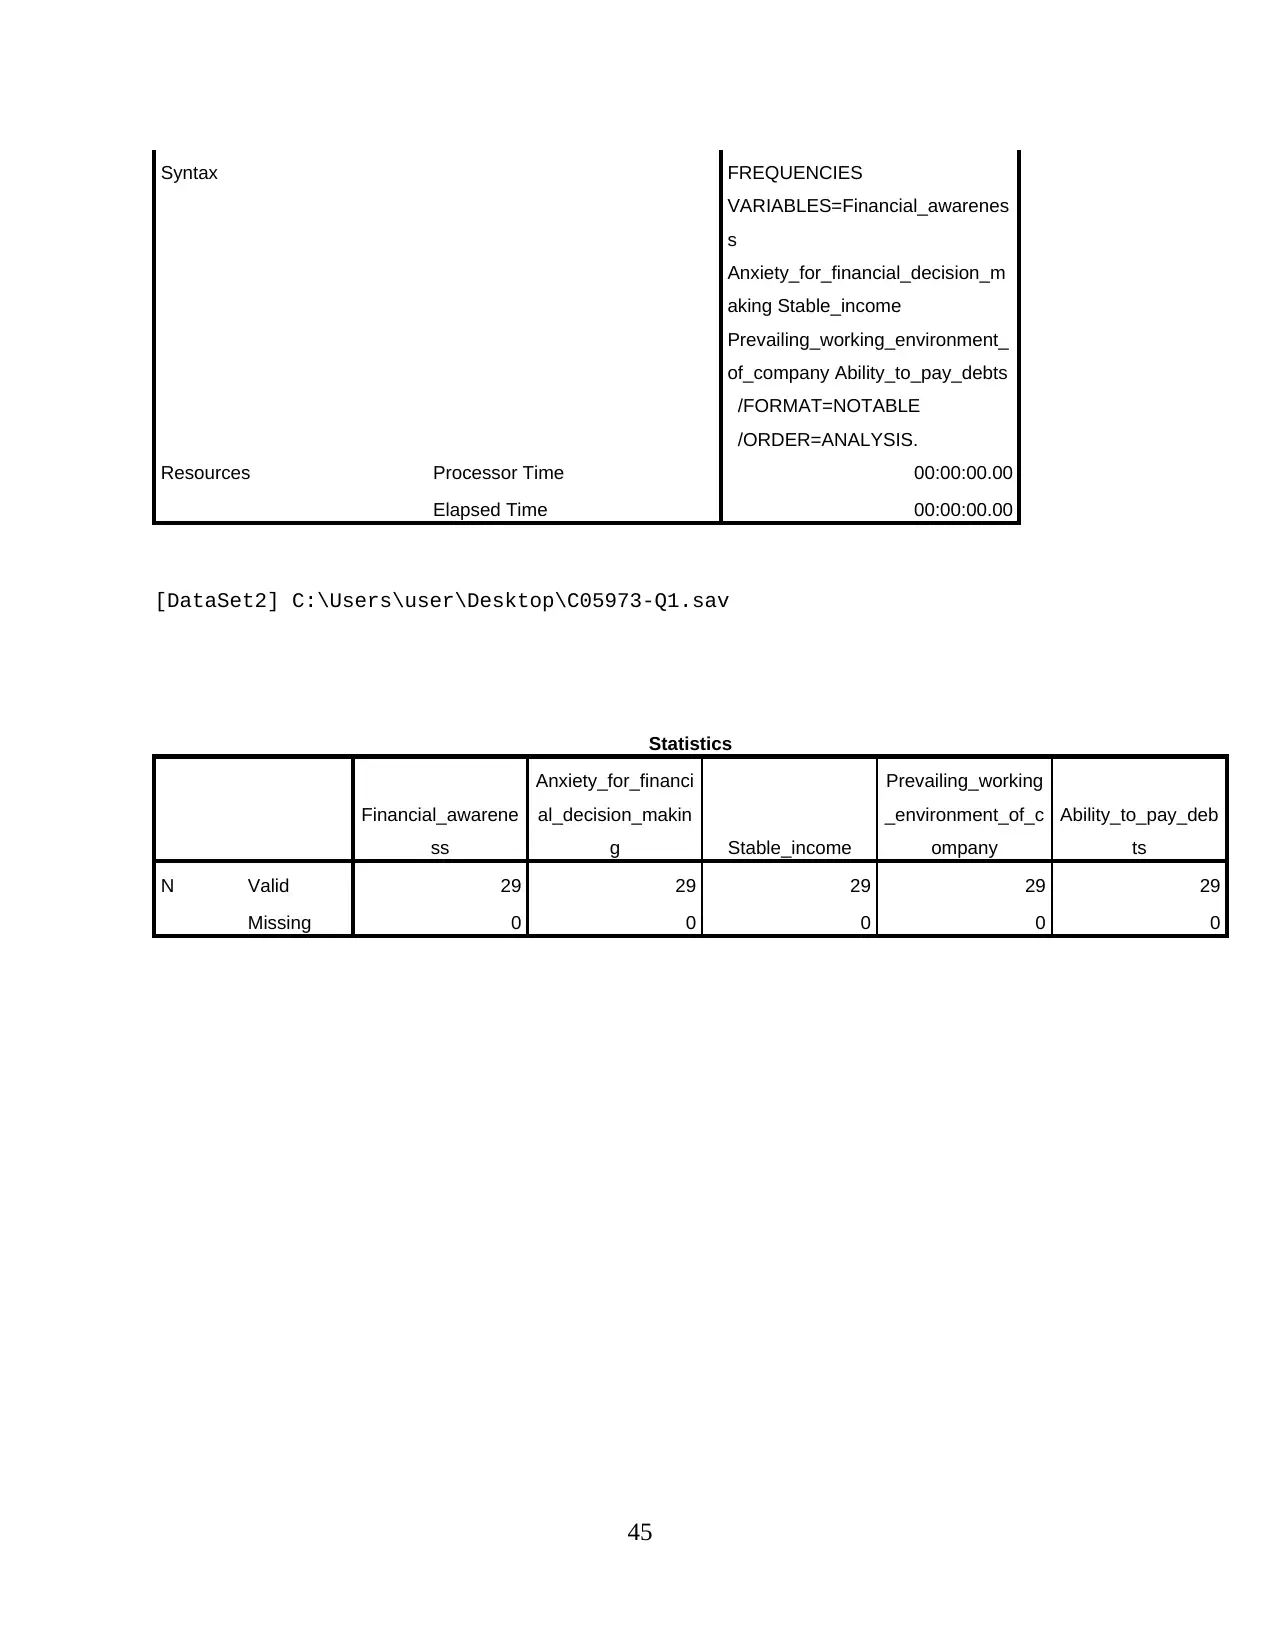
Syntax FREQUENCIES
VARIABLES=Financial_awarenes
s
Anxiety_for_financial_decision_m
aking Stable_income
Prevailing_working_environment_
of_company Ability_to_pay_debts
/FORMAT=NOTABLE
/ORDER=ANALYSIS.
Resources Processor Time 00:00:00.00
Elapsed Time 00:00:00.00
[DataSet2] C:\Users\user\Desktop\C05973-Q1.sav
Statistics
Financial_awarene
ss
Anxiety_for_financi
al_decision_makin
g Stable_income
Prevailing_working
_environment_of_c
ompany
Ability_to_pay_deb
ts
N Valid 29 29 29 29 29
Missing 0 0 0 0 0
45
1 out of 46

Your All-in-One AI-Powered Toolkit for Academic Success.
+13062052269
info@desklib.com
Available 24*7 on WhatsApp / Email
![[object Object]](/_next/static/media/star-bottom.7253800d.svg)
Unlock your academic potential
© 2024 | Zucol Services PVT LTD | All rights reserved.