Capital Structure and Lending: A Study on Banking Sector
VerifiedAdded on 2019/11/14
|33
|7693
|171
Report
AI Summary
The provided content discusses various aspects of risk management, capital structure, and lending at banks, with a focus on Indian banking institutions. The articles explore the relationships between financial ratios, bank performance, and risk-based capital ratios, as well as the impact of internet banking on bank performance. Other topics covered include efficiency measurement, corporate governance, and the determinants of bank profitability. The studies employ various analytical techniques, including data envelopment analysis, event history analysis, and multiple discriminant analysis.
Contribute Materials
Your contribution can guide someone’s learning journey. Share your
documents today.
Running head: FINANCIAL COMPARISION BETWEEN BANKS
Financial Comparison between Standard Chartered Bank and United Overseas Bank
Name of the University:
Name of the Student:
Authors Note:
Financial Comparison between Standard Chartered Bank and United Overseas Bank
Name of the University:
Name of the Student:
Authors Note:
Secure Best Marks with AI Grader
Need help grading? Try our AI Grader for instant feedback on your assignments.
1FINANCIAL COMPARISION BETWEEN BANKS
Table of Contents
1. Introduction..................................................................................................................................3
1.1. Research Background...........................................................................................................3
1.2. Company Background..........................................................................................................3
1.3. Research Significance...........................................................................................................4
2. Literature Review........................................................................................................................5
2.1. Financial Analysis Concept..................................................................................................5
2.2. Financial Ratios Concept......................................................................................................5
2.3. Use of Financial Ratios in Banks..........................................................................................6
2.3.1. Credit Loss Ratio...........................................................................................................6
2.3.2. Cost/Income Ratio.........................................................................................................7
2.3.3. Net Interest Margin Ratio..............................................................................................8
2.3.4. Earnings per Share Ratio...............................................................................................8
2.3.5. Return on Equity............................................................................................................8
2.3.6. Capital Adequacy Ratio.................................................................................................9
3. Research Questions and Objectives...........................................................................................10
3.1. Research Questions:............................................................................................................10
3.2. Research Objectives............................................................................................................10
4. Research Methodology..............................................................................................................10
2FINANCIAL COMPARISION BETWEEN BANKS
4.1. Research Design.................................................................................................................10
4.2. Data Collection...................................................................................................................11
4.3. Data Analysis......................................................................................................................12
4.4. Limitations..........................................................................................................................12
4.5. Reliability and Suitability...................................................................................................12
5. Findings and Analysis................................................................................................................14
5.1. Financial Statements of Standard Chartered Bank and United Overseas Bank.................14
5.1. Credit Loss Ratio Analysis.................................................................................................20
5.2. Cost/Income Ratio Analysis...............................................................................................21
5.3. Net Interest Margin Ratio Analysis....................................................................................22
5.4. Earnings per Share Ratio Analysis.....................................................................................24
5.5. Return on Equity Ratio Analysis........................................................................................25
5.6. Capital Adequacy Ratio Analysis.......................................................................................27
6. Conclusion and Recommendations............................................................................................28
6.1. Conclusion..........................................................................................................................28
6.2. Recommendations to Banks...............................................................................................29
Reference List................................................................................................................................31
3FINANCIAL COMPARISION BETWEEN BANKS
1. Introduction
1.1. Research Background
In economic improvement, banks serves as critical part for the economy as these are
fundamental financial interlinks that facilitate borrowing and lending exercises within indirect
market. In the event that banks might not fit well within industry, it might contribute to huge
failure within the economy (Altman 2013). Commercial banks (CBs) are different from other
partnership organizations as they have unique components within the assets and liabilities
section. Then again, same as few organizations, the business operation of CBs are measured by
the basic offer that they issue to their investors.
1.2. Company Background
Standard Chartered Bank Plc (alluded as "the bank") is among the renowned commercial
banks that has it’s headquarter in London, UK. The bank is set up after The Standard Bank
merger with The Chartered Bank in 1969. Standard Chartered Bank Plc obtained Standard
Chartered Merchant Bank Asia Limited in 1985, Korea First Bank in 2005, ANZ Grindlays Bank
in 2000 and American Express Bank Ltd in 2008. Starting at 30 June 2010, the aggregate
resource of Standard Chartered Bank Plc achieved USD 480.8 billion and is positioned ninth in
UK. The bank had acquired 18.4% of Temasek Holdings and 6.2% of Blackrock Inc (Altman
2013).
UOB is positioned among the renowned banks that has set up itself as a main and local
bank in Singapore and in Asia through business acquisitions. Today, the UOB Company has its
business operations worldwide in 19 nations within Asia Pacific, Western Europe and North
America - having a system of more than 500 workplaces. Singapore, Malaysia, Indonesia,
Secure Best Marks with AI Grader
Need help grading? Try our AI Grader for instant feedback on your assignments.
4FINANCIAL COMPARISION BETWEEN BANKS
Thailand and China are managing an account backups of UOB. UOB offers a broad range of
financial services through its international business partners (Avkiran 2011). The company offers
consumers with access to financial services like private management of an account, individual
money management, business and corporate money saving.
1.3. Research Significance
The financial performance of the commercial banks is required to be assessed and
financial ratio analysis serves as an effective measure to evaluate the bank performance in the
current paper. In addition, there are many causes due to which such financial condition becomes
more intensified, for example, fluctuation on loan fees and external trade rates, liquidity hazard,
decreasing society dependence through financial framework, confinement within lending
exercises and decreased financial movement. In a situation of loss on operation or working
capital deficiency, the company can use the information from its annual report to make effective
business decisions (Barathi Kamath 2017). In such scenario, ratio analysis is considered to be an
effective analysis that can signify the financial position of the company. In addition the ratio
analysis demonstrates a connection between all the elements in income statement or balance
sheet or can help in analyzing the profitability or loss trend within the financial statements.
Along these lines, in this analysis, it will look out which financial ratios must be utilized in the
company to counteract bank failure. A research report regarding "Forecast of bank failure" taken
from Aggarwal, Paruthi and Kumar (2014) will be adjusted and those important financial ratios
are likewise at that point to be clarified in this analysis.
5FINANCIAL COMPARISION BETWEEN BANKS
2. Literature Review
2.1. Financial Analysis Concept
Financial analysis is observed to give supplementary information for various leaders. A
Several indicators including an analysis in light of characteristics and effects on economy
focused organizations will be sought out or discovered and utilized in investigation cash process.
A lot of indicators are given to settle on choice regarding picking the vital operating exercises
tool along with choosing sorts of venture that must be to be financed (Beaver, Correia and
McNichols 2012). Along these lines, an idea has been turned out in the procedure of financial
investigation that financial ratios, designs or certain strategies was decided for analyzing. In this
way, the indicators are then to research the implementation of the major aspect in deciding.
2.2. Financial Ratios Concept
Keeping in mind the end goal to assess the performance of depository organizations,
financial proclamations of commercial banks manages wide range of accessible financial data for
public. In contrast with financial explanation accounts, financial ratios are less demanding to
clarify an organization’s business operation as in financial reports. In addition, financial ratios
are dependably a significant measurement when they work out with an analysis or a reason for
reviewing changes in propensity; or the consequences will be severe, a ratio itself is an un-
significant number in light of the fact that the ratios utilized as a part does not totally explain the
business performance of the company (Berger et al. 2012). Organization analyses those ratios at
that point to compare them and develop standard ratios for itself or different organizations in a
similar industry. This helps in analyzing the organization's propensity by utilizing same ratio
over a long time that is picked arbitrarily relying upon organization needs.
6FINANCIAL COMPARISION BETWEEN BANKS
Applying pertinent financial ratios, is an approach to screen an organization's position by
drawing out the outcome on how the organization effectively created stores and benefits. As
indicated by the ratios with a year based investigation (financial proclamation is examined in a
particular time), it perfectly secured the count by alluding the measurement taken from an
association's financial explanation, with the goal that those ratios can demonstrate an
organization financial status. The correlation which utilizes organization's comparable ratios in a
portion of year is deemed as cross-sectional analysis (Bhattacharyya, Lovell and Sahay 2013).
Cross-sectional analysis utilizes organization's comparative ratios in a portion of years to do a
correlation. Despite utilizing several financial analysis techniques, ratio analysis is attempting to
give a portrayal of organization's strengths and shortcomings for assessing the vital part on of
financial situation of the company. In this way, those data offers a few chances for financial
specialists, experts and supervisors to conduct a ratio analysis before settling on a choice.
2.3. Use of Financial Ratios in Banks
Banks are financial organization, despite the fact that they are also financial
establishments, which offers detailed financial data different from other financial establishments.
Inclination of economy acts as vital part that affects banks' benefits, as banks' income majorly
originate from the cash they have in net premium salary. This is an aspect based on which the
loan costs rely upon the financial condition, so the interest free margin can be kept up as high as
it could. "Expectation of bank collapse", the example has drawn a perfect decision based on six
financial ratios clarified in this analysis.
2.3.1. Credit Loss Ratio
Credit loss ratio signifies changes on liquidity are a critical change to be expected. In
addition, defaulting credits are vital to be considered than liquidity changes. Credit loss ratio can
Paraphrase This Document
Need a fresh take? Get an instant paraphrase of this document with our AI Paraphraser
7FINANCIAL COMPARISION BETWEEN BANKS
be understood as ratio which signifies net measure of credit faults remains connected in
aggregate sum of bank offering with borrowers. It is an attainment rate that remains decreased
than one within ratio.
Credit loss ratio= Net credit loss/Total lending
At the point the banks considered lending exercises; it is conceivable to realize
importance of credit loss. By taking a look at credits, bank will expect that most of them will end
up being a default installment. In estimation of banks' benefit before charge, banks might follow
conceivable costs. Consequently, banks were ensured that when borrowers neglect to pay; they
remain within controller capital necessity along with financial commitments. Negative situation
has appeared to bank's business at the time credit loss was increased (Chaudhary and Sharma
2011). Conversely, an analysis in credit loss will be done with different banks through explaining
credit loss over aggregate lending. By focusing on default credits, it can be said that more
prominent the bank can deal with aggregate lending, the more littler the rate will be observed
within this ratio.
2.3.2. Cost/Income Ratio
The second ratio within exploration shows critical connection among operating income
along with operating costs. This ratio measures the effective way in which bank has a capacity to
manage working costs by producing operating income. In this way, this ratio will be looked for
maintaining a high ratio under such circumstances (Malhotra and Singh 2016).
Income/Cost ratio= Income/Cost
Cost-to-income ratio is all the regularly utilized by bank to show operational
effectiveness after financial emergency that happened. In this ratio, bank's capacity is not to
8FINANCIAL COMPARISION BETWEEN BANKS
focus on dealing with working costs which it probably ought to be limited. Thus, bring down
value is more favored.
Cost/Income – ratio= Cost/Income
In this ratio, adding up to working expense is best for computing those charges on poor
obligation along with suspicious obligation. Moreover, working salary is including the aggregate
sum of net intrigue and salary with no intrigue.
2.3.3. Net Interest Margin Ratio
This ratio can be explained as the way in which banks create net interest pay from credit
resources (additionally called as interest acquiring resources). It is likewise maintaining a
proximity ratio along with non-financial organizations' gross profit edge (Hill, Perry and Andes
2011).
Net interest margin = Net Interest Income/Average Total Assets
2.3.4. Earnings per Share Ratio
Earnings per share are a ratio that gauges net benefit gained by banks or participating
organizations in connection to amount of customary offers issued. In financial investigation, this
ratio is typically used to give compensation to basic investors on their venture. In any case, EPS
is largely affected by the amount of regular offers issued (Chu and Lim 2014).
Earnings per share = Net income/Number of ordinary shares issued
2.3.5. Return on Equity
This ratio is among the most important ratios that remain within the strategy of producing
more cash. In such scenario, Return on Equity (ROE) is important among them. With respect to
9FINANCIAL COMPARISION BETWEEN BANKS
measuring benefit, ROE is the financial ratio that explains utilizing investor contributed cash to
bank's reserve.
Return for Equity = Net income owing to investors/Shareholders' value
As a financial specialist, bank investors are probably going to see this ratio to be as high
as expected under certain circumstances (Chiaramonte and Casu 2017). In any case, a higher
ROE additionally bring up an increase in risks. On the other hand, a development risk of
dissolvability issue is because of the reason that bank has a trouble to maintain the least standard
of controller capital along these lines that causes a major fall in investors' finance.
2.3.6. Capital Adequacy Ratio
In capital adequacy ratio, a controller ratio was made to ensure banks or other financial
organizations have adequate cash-flow to remove them from trouble and furthermore ready to
deal with a huge number of loss.
Capital adequacy ratio = Teir1+ Teir2 capital/Risk weighted assets
Number of volume that bank is ready to find is controlled by the bank's capacity to
payback its investors on time and extra risk taken (Chiaramonte and Casu 2017). This ratio
focuses on analyzing a measure of capital used to deal with the risks in saving money. Since
bank has different sorts of benefits, a few assets are discarded in the record, for example, credits
and credit risk of advances. In view of Basel II, CAR is not permitted to maintain a standard
level of 8%.
Secure Best Marks with AI Grader
Need help grading? Try our AI Grader for instant feedback on your assignments.
10FINANCIAL COMPARISION BETWEEN BANKS
3. Research Questions and Objectives
3.1. Research Questions:
The research questions those are to be answered in carrying out Financial Comparison
between Standard Chartered Bank and United Overseas Bank are explained under:
Why financial ratio evaluation is selected for investigating performance of selected
companies?
What are financial ratios that will be used in order to prevent banking collapse?
What is the importance of analyzing six selected financial ratios?
3.2. Research Objectives
The research objectives those are to be addressed in carrying out Financial Comparison
between Standard Chartered Bank and United Overseas Bank are explained under:
To evaluate whether the financial ratio evaluation should be selected for investigating
performance of selected companies
To evaluate whether the financial ratios will be used in order to prevent banking collapse
To evaluate the importance of analyzing six selected financial ratios of the selected banks
4. Research Methodology
4.1. Research Design
Exploratory research is carried out in the analysis for the reason that financial ratios were
being found from case of forecasting bank emergency. Thus, it offers increased sense to this
point. In this manner, between major research approaches that includes quantitative research and
subjective research, subjective research is highly appropriate to employ for such research (Hill,
11FINANCIAL COMPARISION BETWEEN BANKS
Perry and Andes 2011). The cause of selecting subjective research as an exploration approach is
because such research is depended on an improvement of hypothesis.
In the research, procedure that is utilized is managing the contextual investigations is
focused on contemplating financial ratios that is utilized inside bank to avert insolvency. A
reference is coded from previous research explains that, it is appropriate as a solitary outline of
contextual analysis and in case when the hypothesis presents a detailed rule in basic case.
Furthermore, contextual investigation is required in the exploration as best approach to
distinguish significant financial ratios.
4.2. Data Collection
There exist two approaches for information accumulation for an analysis:
1) Essential information; and
2) Optional information. Information which is gathered in view of addressing particular
objective to settle the research question is considered as essential information.
Optional information is likewise called as secondary information which explains that a
collection of assets is taken from the analysis that is already available in previous researches and
is there for utilization. In this research, it has turned out to be a source of attaining optional
information, for example, diary, article, online reading material, solid site and few more.
Furthermore, this analysis was not carrying out any essential information accumulation as it is
not required to do as such (Hill, Perry and Andes 2011). The secondary information appears to
be gathered for other reason other than analyzing in this investigation therefore this
supplementary information has been checked properly. The collection process selected was
principally to understand major part of the issue by analyzing that information.
12FINANCIAL COMPARISION BETWEEN BANKS
4.3. Data Analysis
Information analysis serves as a strategy breakdown from graphic analysis, was utilized
as a part of carrying out investigation for the research. The example of Meyer and Pifer
demonstrated six financial ratios remain essential as best approach to deal with insolvency.
Considering the same, research was conducted by utilizing associated accessible information.
Significance of these ratios must be analyzed before utilizing such aspects to conduct analysis on
two selected banks.
4.4. Limitations
By utilizing secondary information in this exploration, a couple of limitations are
experienced that reduced information usefulness. Due to such limitations, researcher ought to be
inefficient while utilizing the secondary information. In view of those issues, the researcher may
require significant investment in examining the ratios as it perhaps serves as an appropriate
analysis (Goyal and Joshi 2011). Thus, it offers increased sense to this point. In this manner,
between major research approaches that includes quantitative research and subjective research,
subjective research is highly appropriate to employ for such research. Consequently, in this
analysis, use of secondary information is important to get an alternate complaint with initial
information originator.
4.5. Reliability and Suitability
As per Goyal and Joshi (2011), certain optional information was utilized focused on the
researcher that ought to guarantee that they could satisfy the accompanying qualities:
• Reliability
Paraphrase This Document
Need a fresh take? Get an instant paraphrase of this document with our AI Paraphraser
13FINANCIAL COMPARISION BETWEEN BANKS
Since secondary information is accessible and simple to attain, it ought to be focused on
feeling of unwavering quality. In such aspect, it might be tried through discovering appropriate
response from pertinent inquiries. Those inquiries are:
(a) Who is individual that gathered information?
(b) What sort of sources are available for information turned out with?
(c) Were all information gathered through a moral ways?
(d) When were such information gathered?
(e) Was there certain contentions showed up with first specialist?
(f) Which type exact information was desired? Is it accurate to say that it was accomplished or
not?
• Suitability
As secondary information must be gathered from accessible data, as, those information
accumulations were done to suit the research analysis. Hence, rationality of information relies
upon the agent's exploration prerequisite, it might be reasonable for one however not another.
Along these lines, the clearness of layout and company units are utilized at the occasion of
gathering essential information sources must be investigated precisely by researcher. The
comparable approach to do as such on considered the reason, range and nature of first analysis.
In conclusion, the researcher ought not to utilize that information if any distinctions were found
in, in light of the fact that they demonstrated inadmissible with as of now analysis.
• Sufficiency
14FINANCIAL COMPARISION BETWEEN BANKS
The researcher might not utilize the optional information that was discovered to be
inadequate despite the fact that the information achieved maintains the level of exactness; they
are as yet considered to be lacking. In the event that the range of information which is either
more extensive or smaller than the at present analysis zone, the information was moreover
considered as deficient. From every one of the attributes, it was being evidenced that a high risk
is involved in utilizing the prepared accessible information. The prepared accessible information
is a concern just when they are deemed to be adequate, appropriate and dependable for the
researcher. In other perspective, if the prepared accessible information was turned out from
reliable sources and likewise reasonable and adequate. Analysis of the same is deemed to be
simply aimless for using it as it is not worth to rely on utilizing study to gather data. Now and
again, helpfulness of optional information might be profited by the researcher who must utilize
the data under self-assurance.
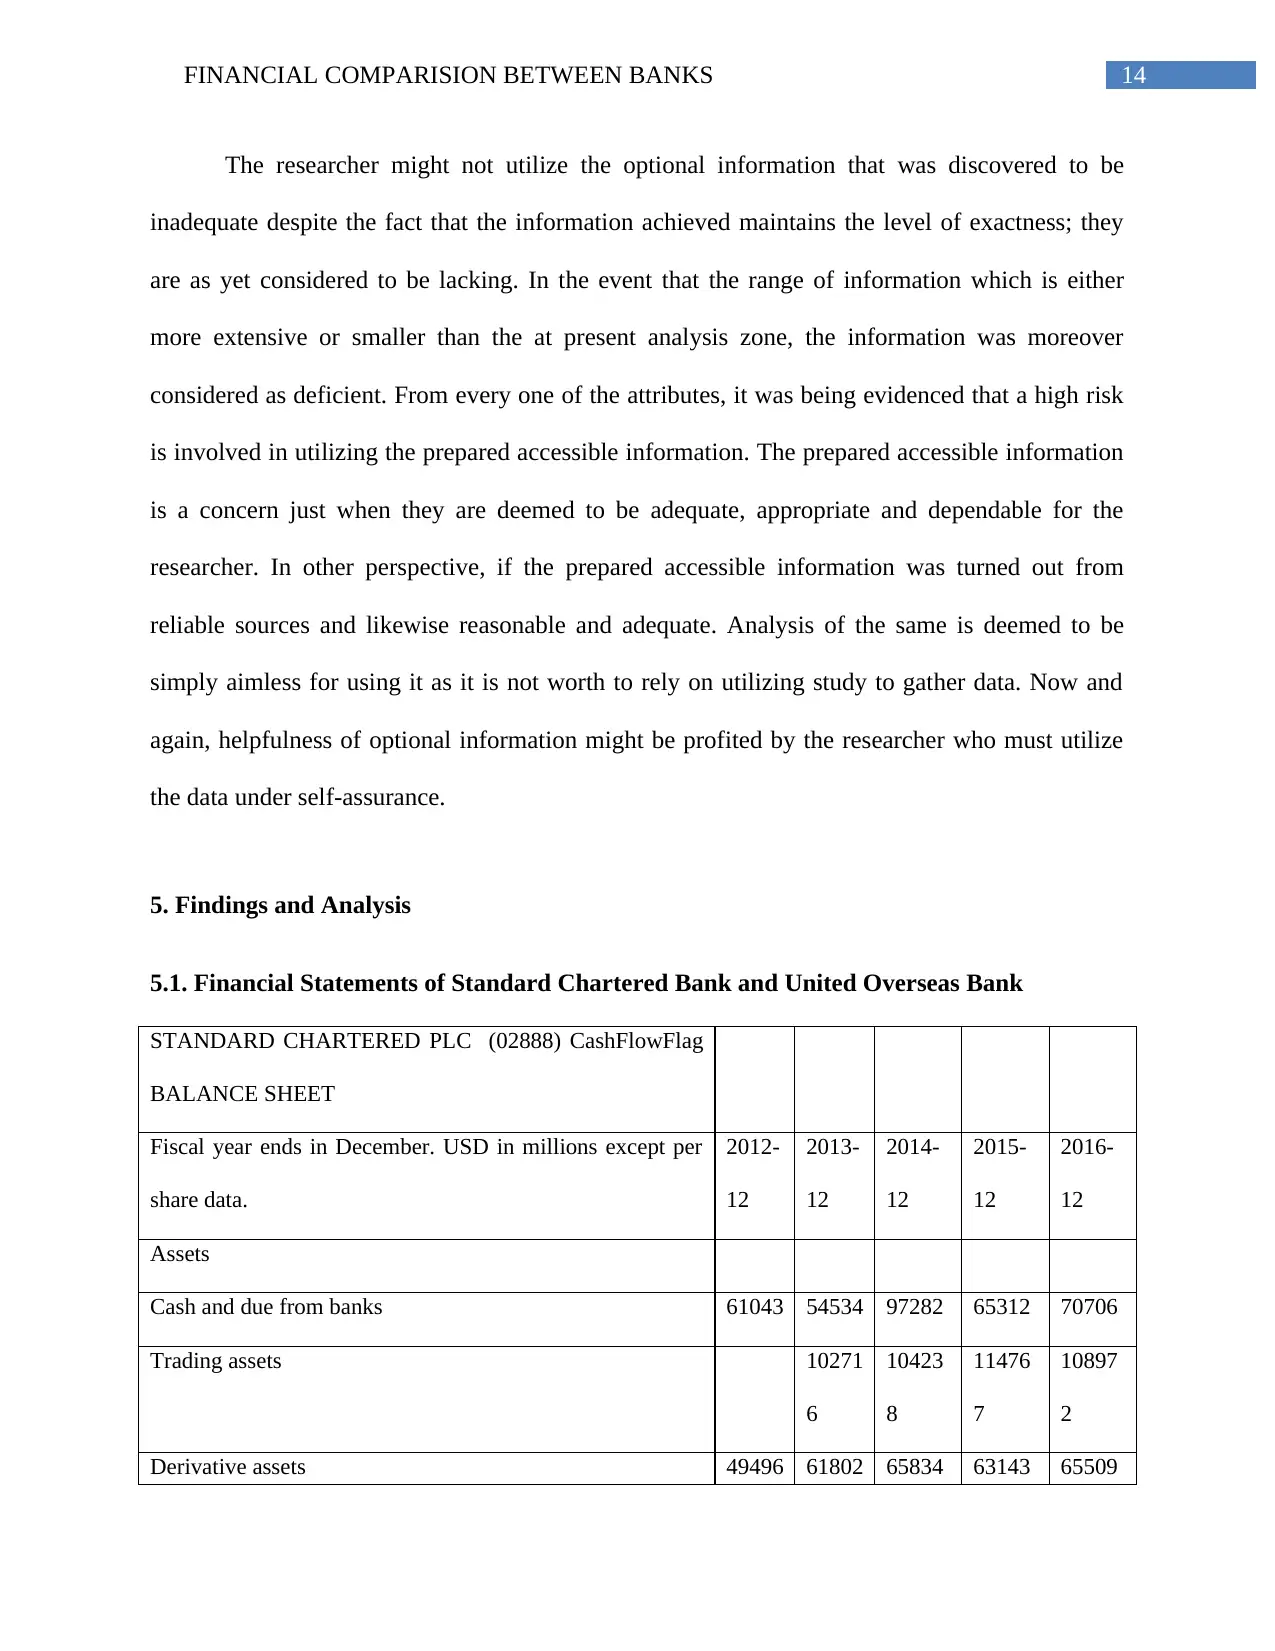
5. Findings and Analysis
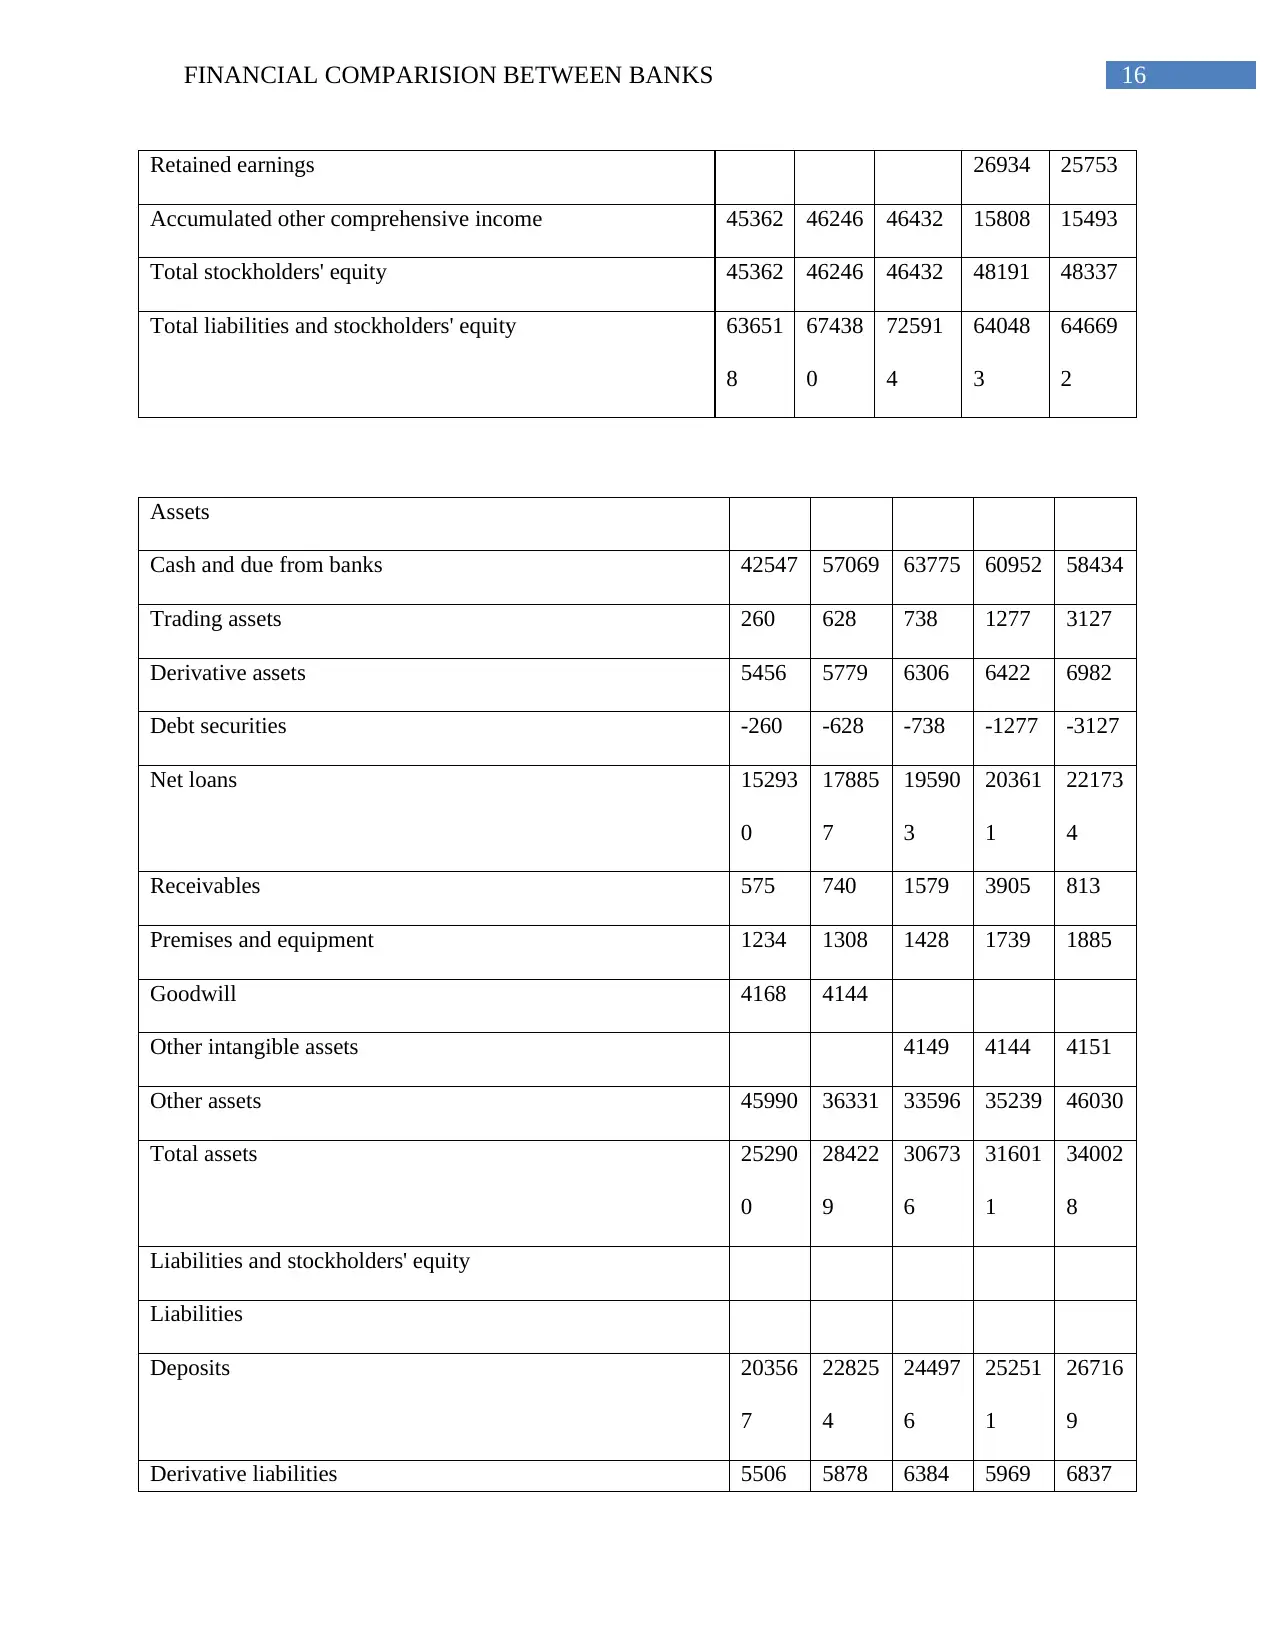
5.1. Financial Statements of Standard Chartered Bank and United Overseas Bank
STANDARD CHARTERED PLC (02888) CashFlowFlag
BALANCE SHEET
Fiscal year ends in December. USD in millions except per
share data.
2012-
12
2013-
12
2014-
12
2015-
12
2016-
12
Assets
Cash and due from banks 61043 54534 97282 65312 70706
Trading assets 10271
6
10423
8
11476
7
10897
2
Derivative assets 49496 61802 65834 63143 65509
The researcher might not utilize the optional information that was discovered to be
inadequate despite the fact that the information achieved maintains the level of exactness; they
are as yet considered to be lacking. In the event that the range of information which is either
more extensive or smaller than the at present analysis zone, the information was moreover
considered as deficient. From every one of the attributes, it was being evidenced that a high risk
is involved in utilizing the prepared accessible information. The prepared accessible information
is a concern just when they are deemed to be adequate, appropriate and dependable for the
researcher. In other perspective, if the prepared accessible information was turned out from
reliable sources and likewise reasonable and adequate. Analysis of the same is deemed to be
simply aimless for using it as it is not worth to rely on utilizing study to gather data. Now and
again, helpfulness of optional information might be profited by the researcher who must utilize
the data under self-assurance.
5. Findings and Analysis
5.1. Financial Statements of Standard Chartered Bank and United Overseas Bank
STANDARD CHARTERED PLC (02888) CashFlowFlag
BALANCE SHEET
Fiscal year ends in December. USD in millions except per
share data.
2012-
12
2013-
12
2014-
12
2015-
12
2016-
12
Assets
Cash and due from banks 61043 54534 97282 65312 70706
Trading assets 10271
6
10423
8
11476
7
10897
2
Derivative assets 49496 61802 65834 63143 65509
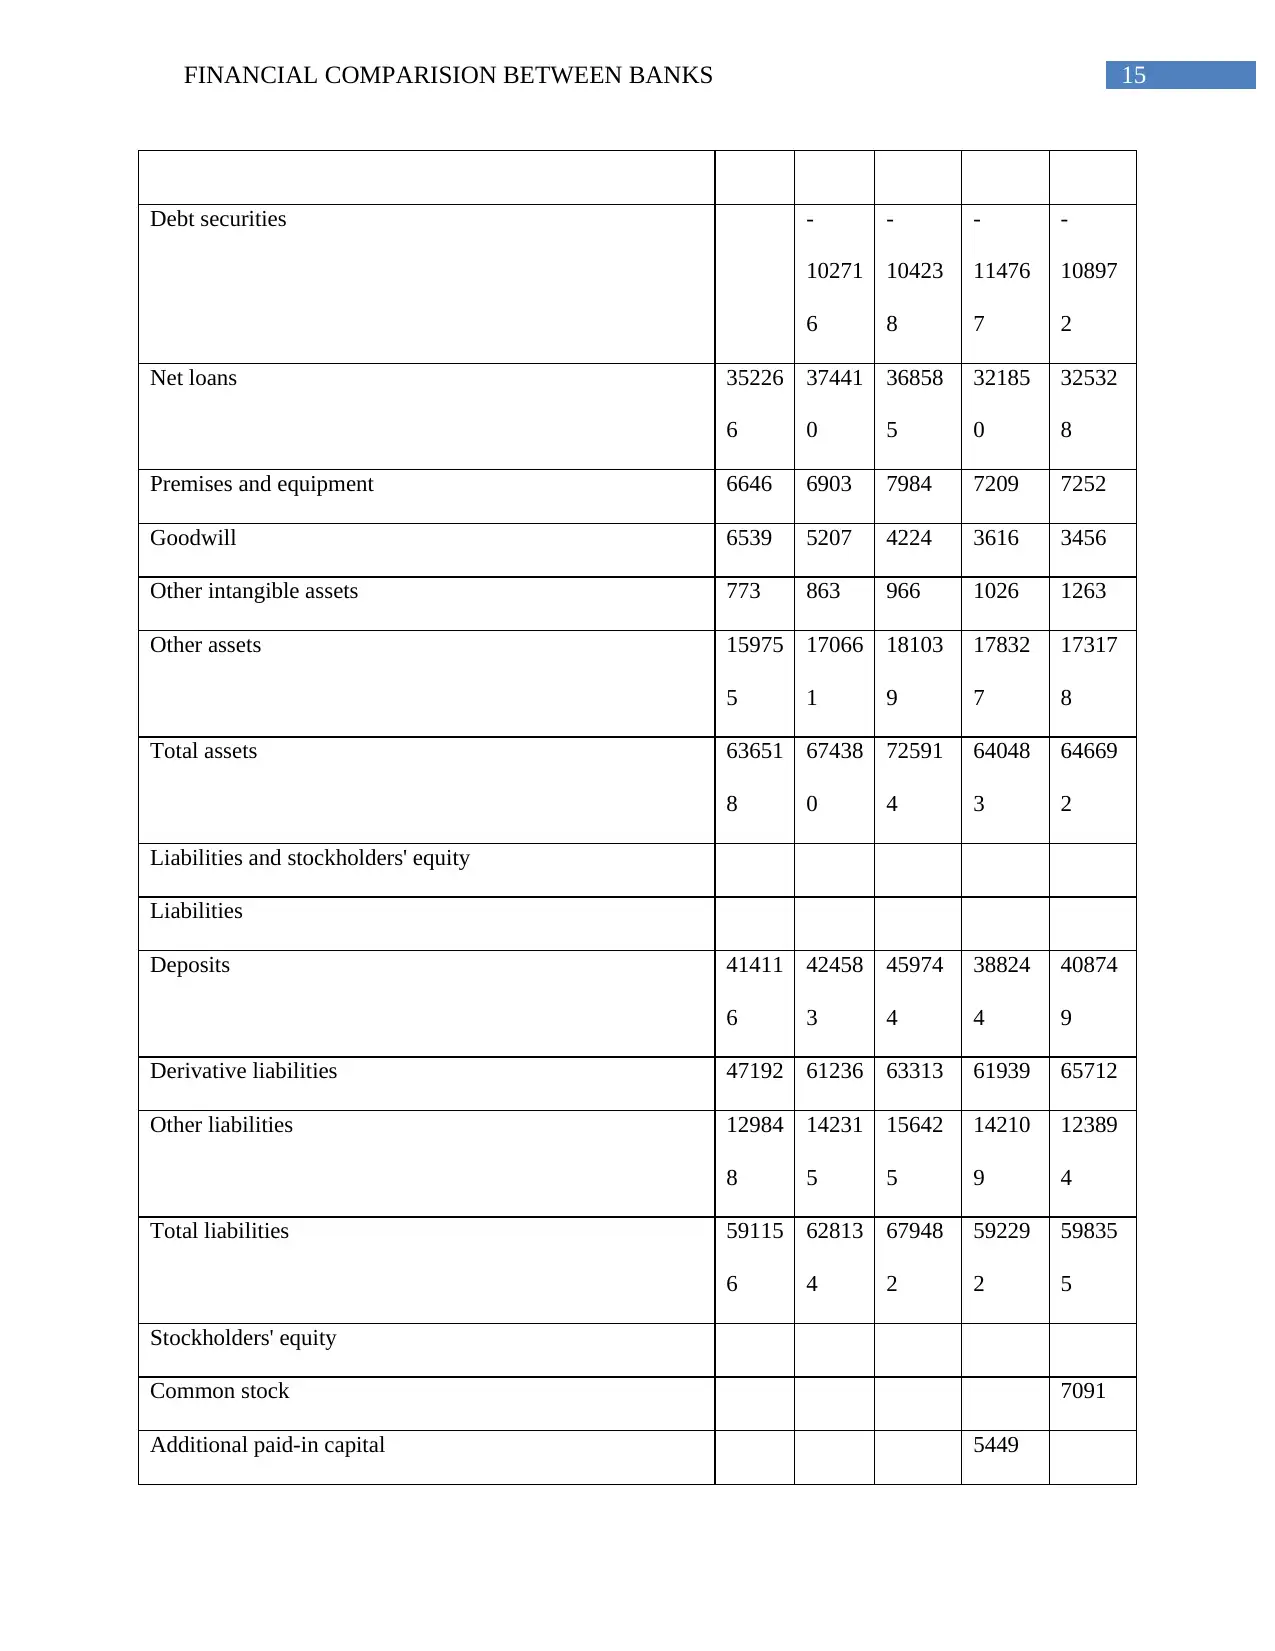
15FINANCIAL COMPARISION BETWEEN BANKS
Debt securities -
10271
6
-
10423
8
-
11476
7
-
10897
2
Net loans 35226
6
37441
0
36858
5
32185
0
32532
8
Premises and equipment 6646 6903 7984 7209 7252
Goodwill 6539 5207 4224 3616 3456
Other intangible assets 773 863 966 1026 1263
Other assets 15975
5
17066
1
18103
9
17832
7
17317
8
Total assets 63651
8
67438
0
72591
4
64048
3
64669
2
Liabilities and stockholders' equity
Liabilities
Deposits 41411
6
42458
3
45974
4
38824
4
40874
9
Derivative liabilities 47192 61236 63313 61939 65712
Other liabilities 12984
8
14231
5
15642
5
14210
9
12389
4
Total liabilities 59115
6
62813
4
67948
2
59229
2
59835
5
Stockholders' equity
Common stock 7091
Additional paid-in capital 5449
Secure Best Marks with AI Grader
Need help grading? Try our AI Grader for instant feedback on your assignments.
16FINANCIAL COMPARISION BETWEEN BANKS
Retained earnings 26934 25753
Accumulated other comprehensive income 45362 46246 46432 15808 15493
Total stockholders' equity 45362 46246 46432 48191 48337
Total liabilities and stockholders' equity 63651
8
67438
0
72591
4
64048
3
64669
2
Assets
Cash and due from banks 42547 57069 63775 60952 58434
Trading assets 260 628 738 1277 3127
Derivative assets 5456 5779 6306 6422 6982
Debt securities -260 -628 -738 -1277 -3127
Net loans 15293
0
17885
7
19590
3
20361
1
22173
4
Receivables 575 740 1579 3905 813
Premises and equipment 1234 1308 1428 1739 1885
Goodwill 4168 4144
Other intangible assets 4149 4144 4151
Other assets 45990 36331 33596 35239 46030
Total assets 25290
0
28422
9
30673
6
31601
1
34002
8
Liabilities and stockholders' equity
Liabilities
Deposits 20356
7
22825
4
24497
6
25251
1
26716
9
Derivative liabilities 5506 5878 6384 5969 6837
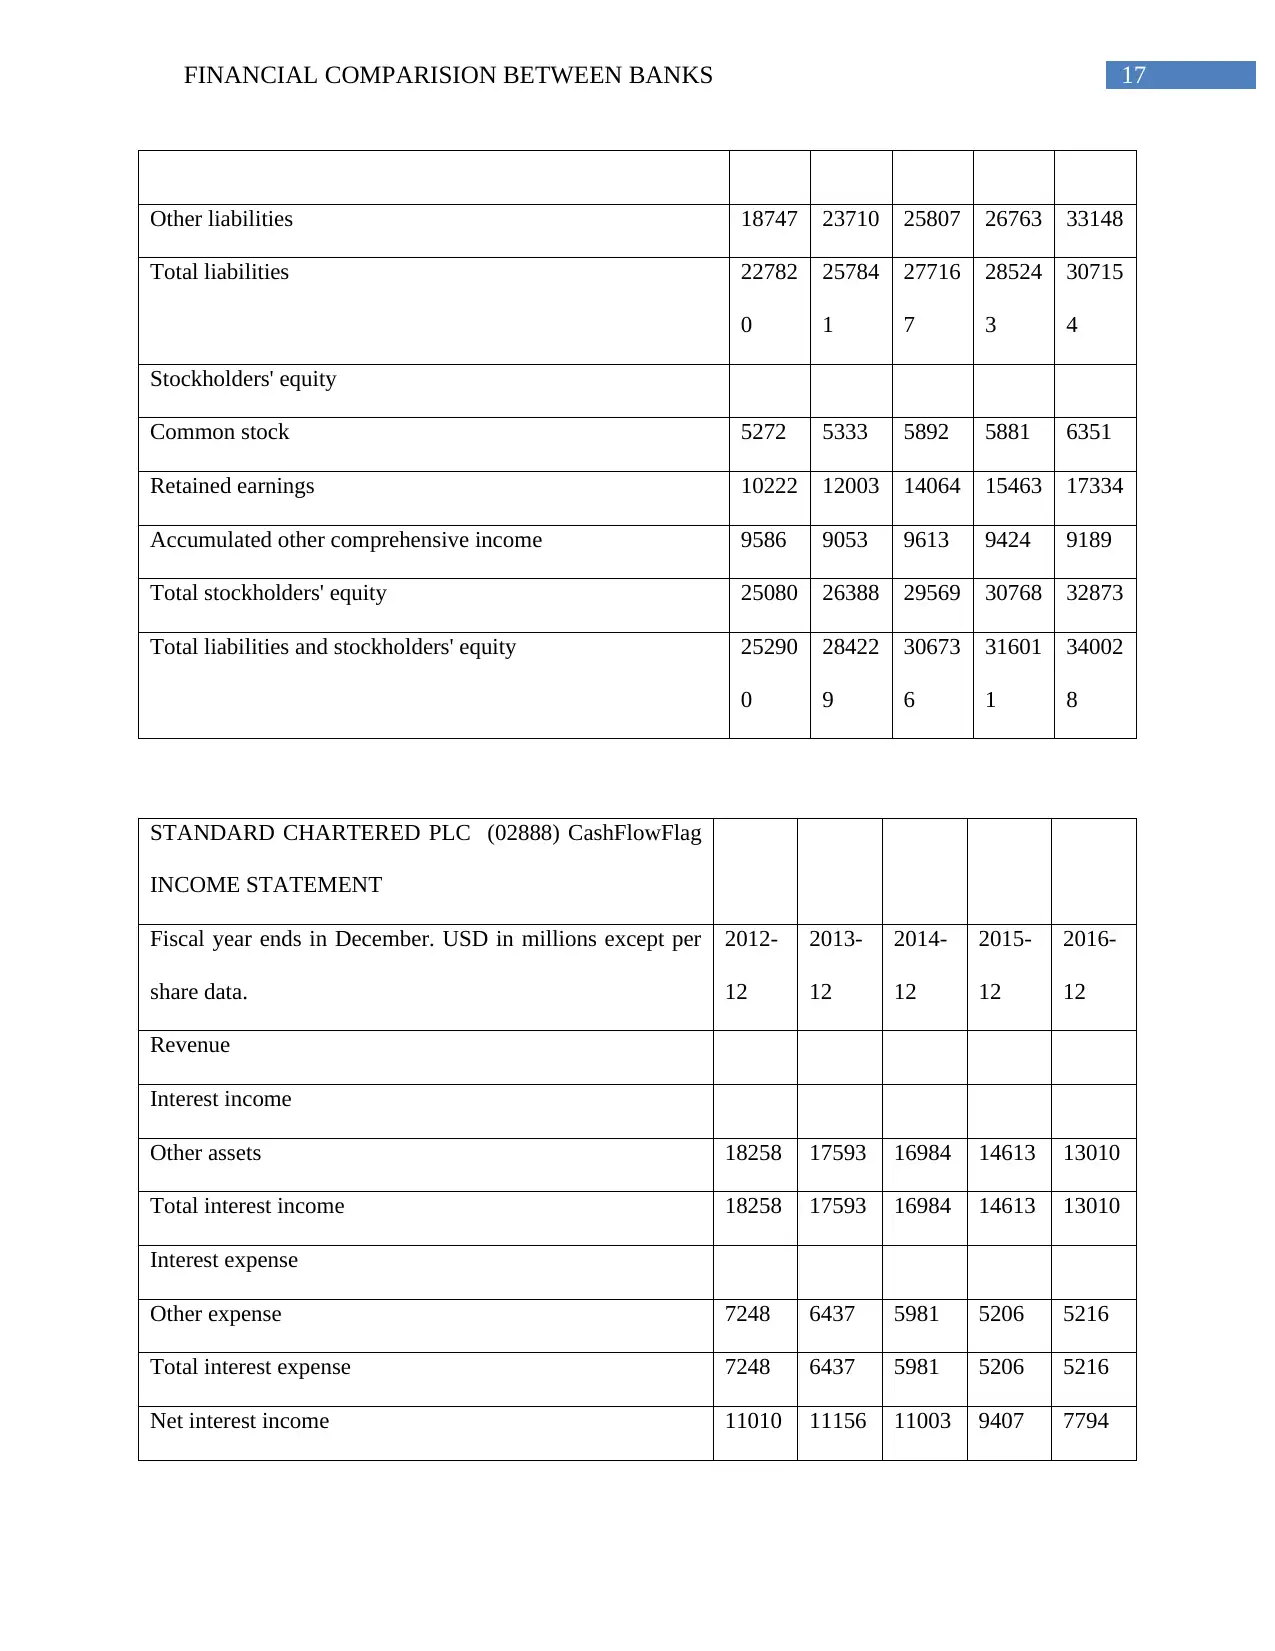
17FINANCIAL COMPARISION BETWEEN BANKS
Other liabilities 18747 23710 25807 26763 33148
Total liabilities 22782
0
25784
1
27716
7
28524
3
30715
4
Stockholders' equity
Common stock 5272 5333 5892 5881 6351
Retained earnings 10222 12003 14064 15463 17334
Accumulated other comprehensive income 9586 9053 9613 9424 9189
Total stockholders' equity 25080 26388 29569 30768 32873
Total liabilities and stockholders' equity 25290
0
28422
9
30673
6
31601
1
34002
8
STANDARD CHARTERED PLC (02888) CashFlowFlag
INCOME STATEMENT
Fiscal year ends in December. USD in millions except per
share data.
2012-
12
2013-
12
2014-
12
2015-
12
2016-
12
Revenue
Interest income
Other assets 18258 17593 16984 14613 13010
Total interest income 18258 17593 16984 14613 13010
Interest expense
Other expense 7248 6437 5981 5206 5216
Total interest expense 7248 6437 5981 5206 5216
Net interest income 11010 11156 11003 9407 7794
18FINANCIAL COMPARISION BETWEEN BANKS
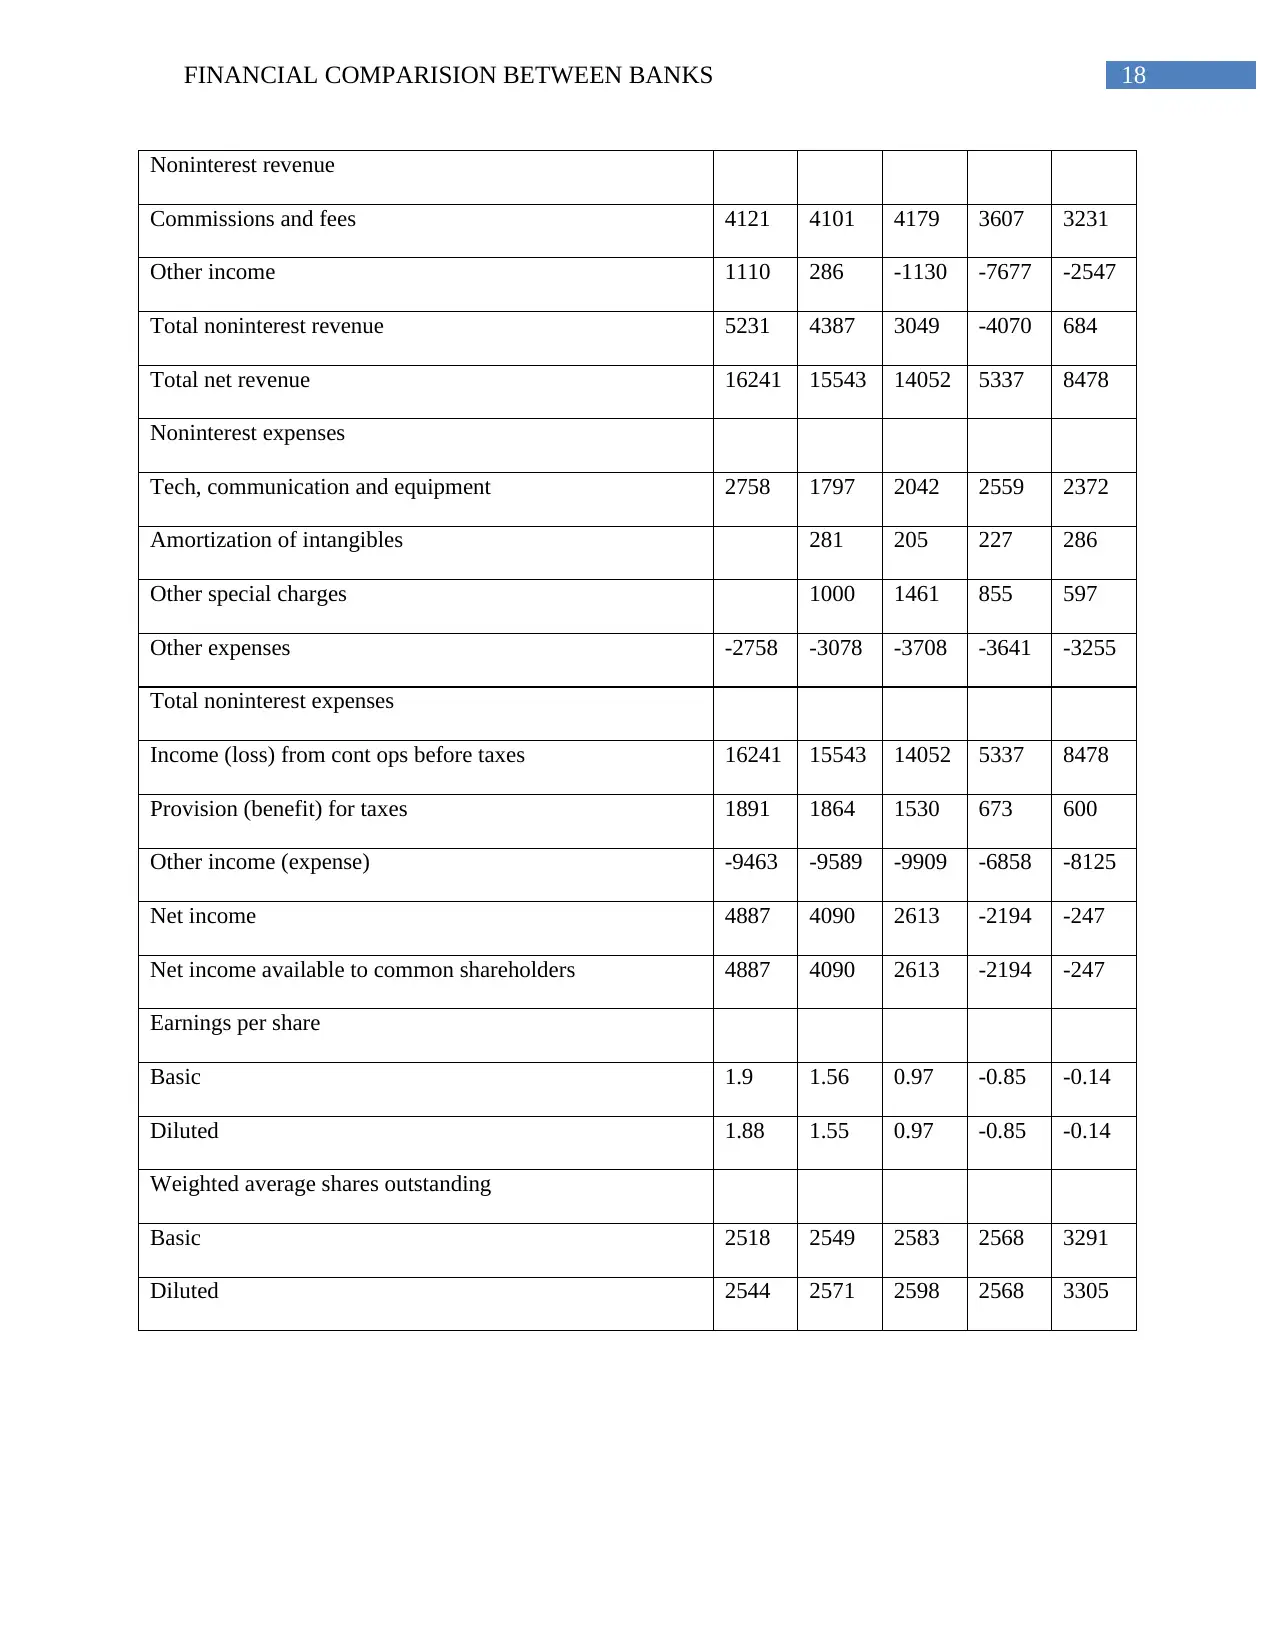
Noninterest revenue
Commissions and fees 4121 4101 4179 3607 3231
Other income 1110 286 -1130 -7677 -2547
Total noninterest revenue 5231 4387 3049 -4070 684
Total net revenue 16241 15543 14052 5337 8478
Noninterest expenses
Tech, communication and equipment 2758 1797 2042 2559 2372
Amortization of intangibles 281 205 227 286
Other special charges 1000 1461 855 597
Other expenses -2758 -3078 -3708 -3641 -3255
Total noninterest expenses
Income (loss) from cont ops before taxes 16241 15543 14052 5337 8478
Provision (benefit) for taxes 1891 1864 1530 673 600
Other income (expense) -9463 -9589 -9909 -6858 -8125
Net income 4887 4090 2613 -2194 -247
Net income available to common shareholders 4887 4090 2613 -2194 -247
Earnings per share
Basic 1.9 1.56 0.97 -0.85 -0.14
Diluted 1.88 1.55 0.97 -0.85 -0.14
Weighted average shares outstanding
Basic 2518 2549 2583 2568 3291
Diluted 2544 2571 2598 2568 3305
Paraphrase This Document
Need a fresh take? Get an instant paraphrase of this document with our AI Paraphraser
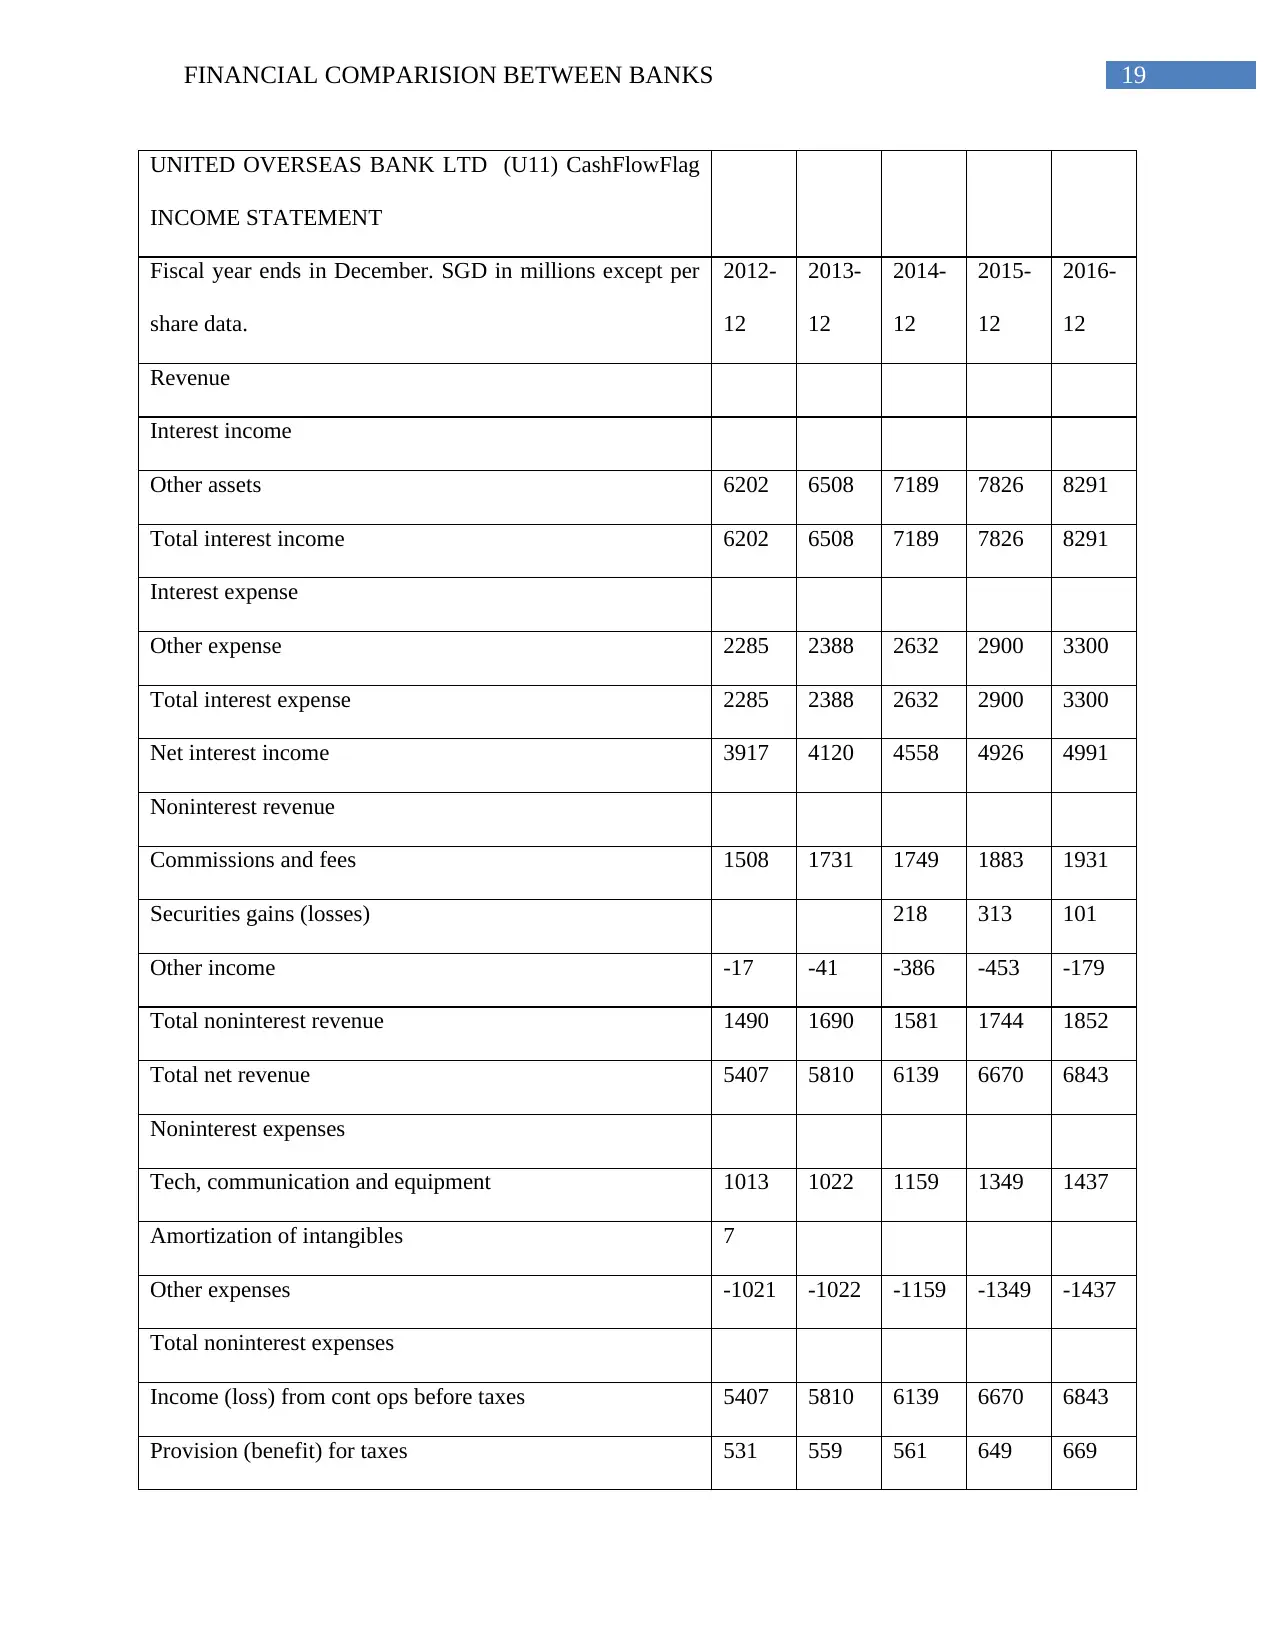
19FINANCIAL COMPARISION BETWEEN BANKS
UNITED OVERSEAS BANK LTD (U11) CashFlowFlag
INCOME STATEMENT
Fiscal year ends in December. SGD in millions except per
share data.
2012-
12
2013-
12
2014-
12
2015-
12
2016-
12
Revenue
Interest income
Other assets 6202 6508 7189 7826 8291
Total interest income 6202 6508 7189 7826 8291
Interest expense
Other expense 2285 2388 2632 2900 3300
Total interest expense 2285 2388 2632 2900 3300
Net interest income 3917 4120 4558 4926 4991
Noninterest revenue
Commissions and fees 1508 1731 1749 1883 1931
Securities gains (losses) 218 313 101
Other income -17 -41 -386 -453 -179
Total noninterest revenue 1490 1690 1581 1744 1852
Total net revenue 5407 5810 6139 6670 6843
Noninterest expenses
Tech, communication and equipment 1013 1022 1159 1349 1437
Amortization of intangibles 7
Other expenses -1021 -1022 -1159 -1349 -1437
Total noninterest expenses
Income (loss) from cont ops before taxes 5407 5810 6139 6670 6843
Provision (benefit) for taxes 531 559 561 649 669
20FINANCIAL COMPARISION BETWEEN BANKS
Other income (expense) -2074 -2243 -2329 -2812 -3078
Net income 2803 3008 3249 3209 3096
Preferred dividend 102 105 92
Net income available to common shareholders 2803 3008 3147 3104 3004
Earnings per share
Basic 1.72 1.84 1.98 1.94 1.86
Diluted 1.71 1.84 1.97 1.93 1.85
Weighted average shares outstanding
Basic 1574 1575 1591 1602 1617
Diluted 1578 1580 1597 1607 1623
5.1. Credit Loss Ratio Analysis
Standard Chartered Bank (2016) United Overseas Bank (2016)
Credit Loss Ratio 12.41920609 4.848325289
Net credit losses/ Total lending
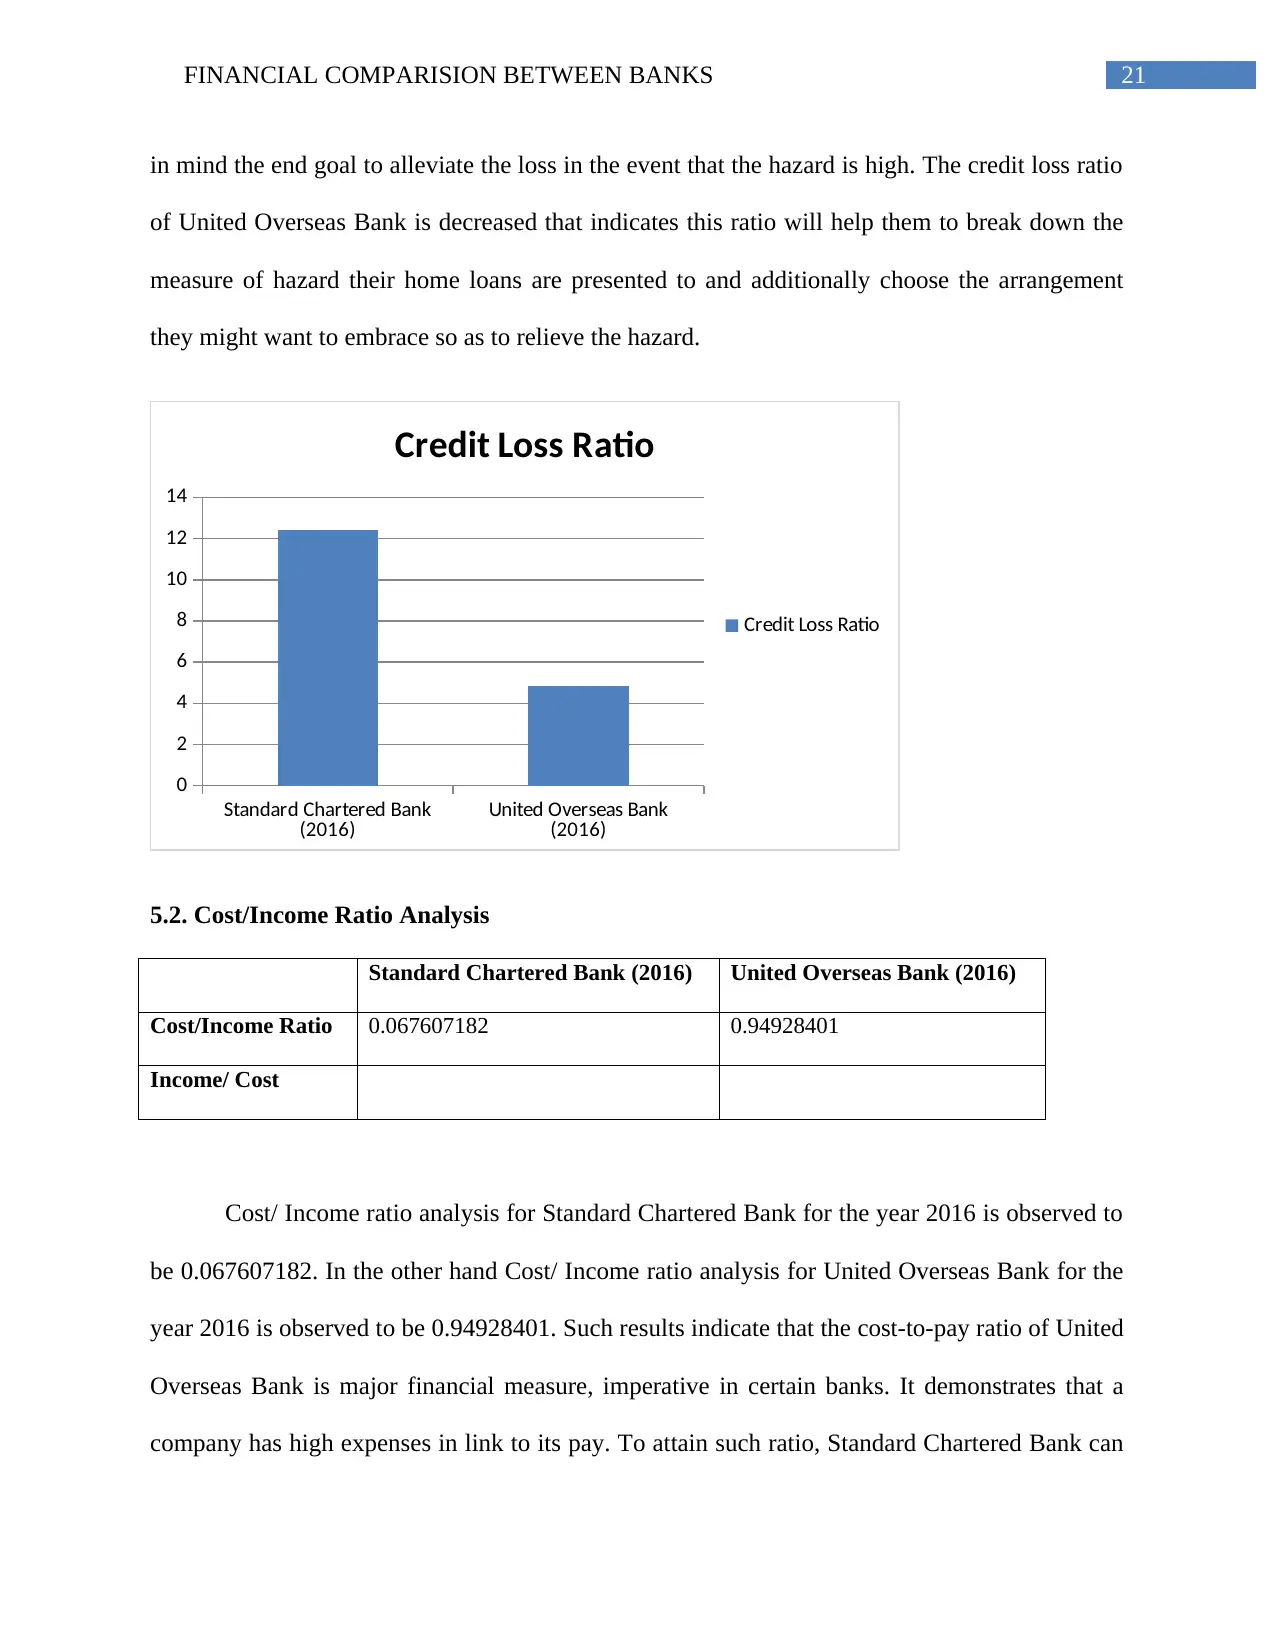
Credit loss ratio is characterized as the ratio of current credit related loss to the present
standard esteem or unique standard estimation of the Mortgage Backed security (MBS). Home
loan sponsored securities are the securities that are moved down by home loans or gathering of
home loans. Credit loss ratio for Standard Chartered Bank for the year 2016 is observed to be
12.41920609. In the other hand Credit loss ratio for United Overseas Bank for the year 2016 is
observed to be 4.848325289. Such results indicate that this ratio is higher for Standard Chartered
Bank and this gauges the measure of risk resource that is presented to and gives the guarantor
organization to perceive what sort of activities and arrangements they have to embrace keeping
Other income (expense) -2074 -2243 -2329 -2812 -3078
Net income 2803 3008 3249 3209 3096
Preferred dividend 102 105 92
Net income available to common shareholders 2803 3008 3147 3104 3004
Earnings per share
Basic 1.72 1.84 1.98 1.94 1.86
Diluted 1.71 1.84 1.97 1.93 1.85
Weighted average shares outstanding
Basic 1574 1575 1591 1602 1617
Diluted 1578 1580 1597 1607 1623
5.1. Credit Loss Ratio Analysis
Standard Chartered Bank (2016) United Overseas Bank (2016)
Credit Loss Ratio 12.41920609 4.848325289
Net credit losses/ Total lending
Credit loss ratio is characterized as the ratio of current credit related loss to the present
standard esteem or unique standard estimation of the Mortgage Backed security (MBS). Home
loan sponsored securities are the securities that are moved down by home loans or gathering of
home loans. Credit loss ratio for Standard Chartered Bank for the year 2016 is observed to be
12.41920609. In the other hand Credit loss ratio for United Overseas Bank for the year 2016 is
observed to be 4.848325289. Such results indicate that this ratio is higher for Standard Chartered
Bank and this gauges the measure of risk resource that is presented to and gives the guarantor
organization to perceive what sort of activities and arrangements they have to embrace keeping
21FINANCIAL COMPARISION BETWEEN BANKS
in mind the end goal to alleviate the loss in the event that the hazard is high. The credit loss ratio
of United Overseas Bank is decreased that indicates this ratio will help them to break down the
measure of hazard their home loans are presented to and additionally choose the arrangement
they might want to embrace so as to relieve the hazard.
Standard Chartered Bank
(2016) United Overseas Bank
(2016)
0
2
4
6
8
10
12
14
Credit Loss Ratio
Credit Loss Ratio
5.2. Cost/Income Ratio Analysis
Standard Chartered Bank (2016) United Overseas Bank (2016)
Cost/Income Ratio 0.067607182 0.94928401
Income/ Cost
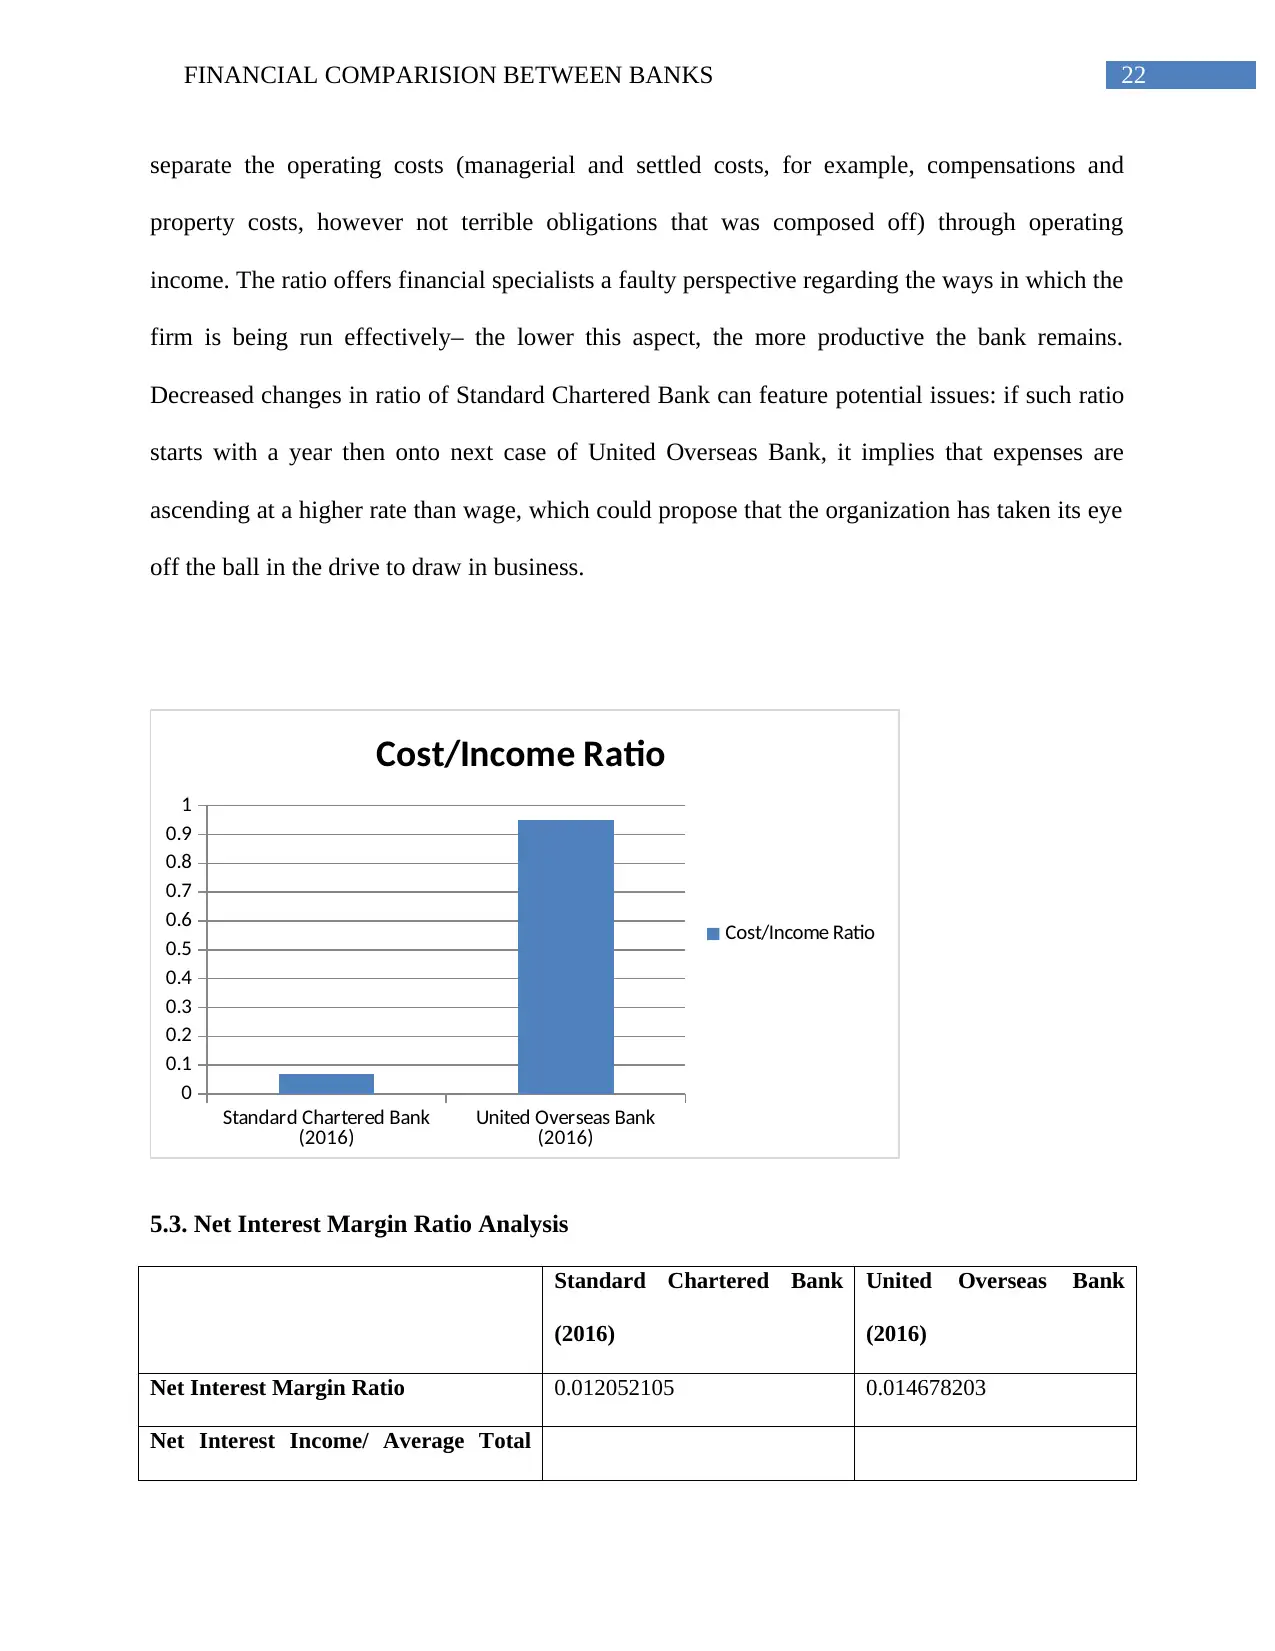
Cost/ Income ratio analysis for Standard Chartered Bank for the year 2016 is observed to
be 0.067607182. In the other hand Cost/ Income ratio analysis for United Overseas Bank for the
year 2016 is observed to be 0.94928401. Such results indicate that the cost-to-pay ratio of United
Overseas Bank is major financial measure, imperative in certain banks. It demonstrates that a
company has high expenses in link to its pay. To attain such ratio, Standard Chartered Bank can
in mind the end goal to alleviate the loss in the event that the hazard is high. The credit loss ratio
of United Overseas Bank is decreased that indicates this ratio will help them to break down the
measure of hazard their home loans are presented to and additionally choose the arrangement
they might want to embrace so as to relieve the hazard.
Standard Chartered Bank
(2016) United Overseas Bank
(2016)
0
2
4
6
8
10
12
14
Credit Loss Ratio
Credit Loss Ratio
5.2. Cost/Income Ratio Analysis
Standard Chartered Bank (2016) United Overseas Bank (2016)
Cost/Income Ratio 0.067607182 0.94928401
Income/ Cost
Cost/ Income ratio analysis for Standard Chartered Bank for the year 2016 is observed to
be 0.067607182. In the other hand Cost/ Income ratio analysis for United Overseas Bank for the
year 2016 is observed to be 0.94928401. Such results indicate that the cost-to-pay ratio of United
Overseas Bank is major financial measure, imperative in certain banks. It demonstrates that a
company has high expenses in link to its pay. To attain such ratio, Standard Chartered Bank can
Secure Best Marks with AI Grader
Need help grading? Try our AI Grader for instant feedback on your assignments.
22FINANCIAL COMPARISION BETWEEN BANKS
separate the operating costs (managerial and settled costs, for example, compensations and
property costs, however not terrible obligations that was composed off) through operating
income. The ratio offers financial specialists a faulty perspective regarding the ways in which the
firm is being run effectively– the lower this aspect, the more productive the bank remains.
Decreased changes in ratio of Standard Chartered Bank can feature potential issues: if such ratio
starts with a year then onto next case of United Overseas Bank, it implies that expenses are
ascending at a higher rate than wage, which could propose that the organization has taken its eye
off the ball in the drive to draw in business.
Standard Chartered Bank
(2016) United Overseas Bank
(2016)
0
0.1
0.2
0.3
0.4
0.5
0.6
0.7
0.8
0.9
1
Cost/Income Ratio
Cost/Income Ratio
5.3. Net Interest Margin Ratio Analysis
Standard Chartered Bank
(2016)
United Overseas Bank
(2016)
Net Interest Margin Ratio 0.012052105 0.014678203
Net Interest Income/ Average Total
23FINANCIAL COMPARISION BETWEEN BANKS
Assets
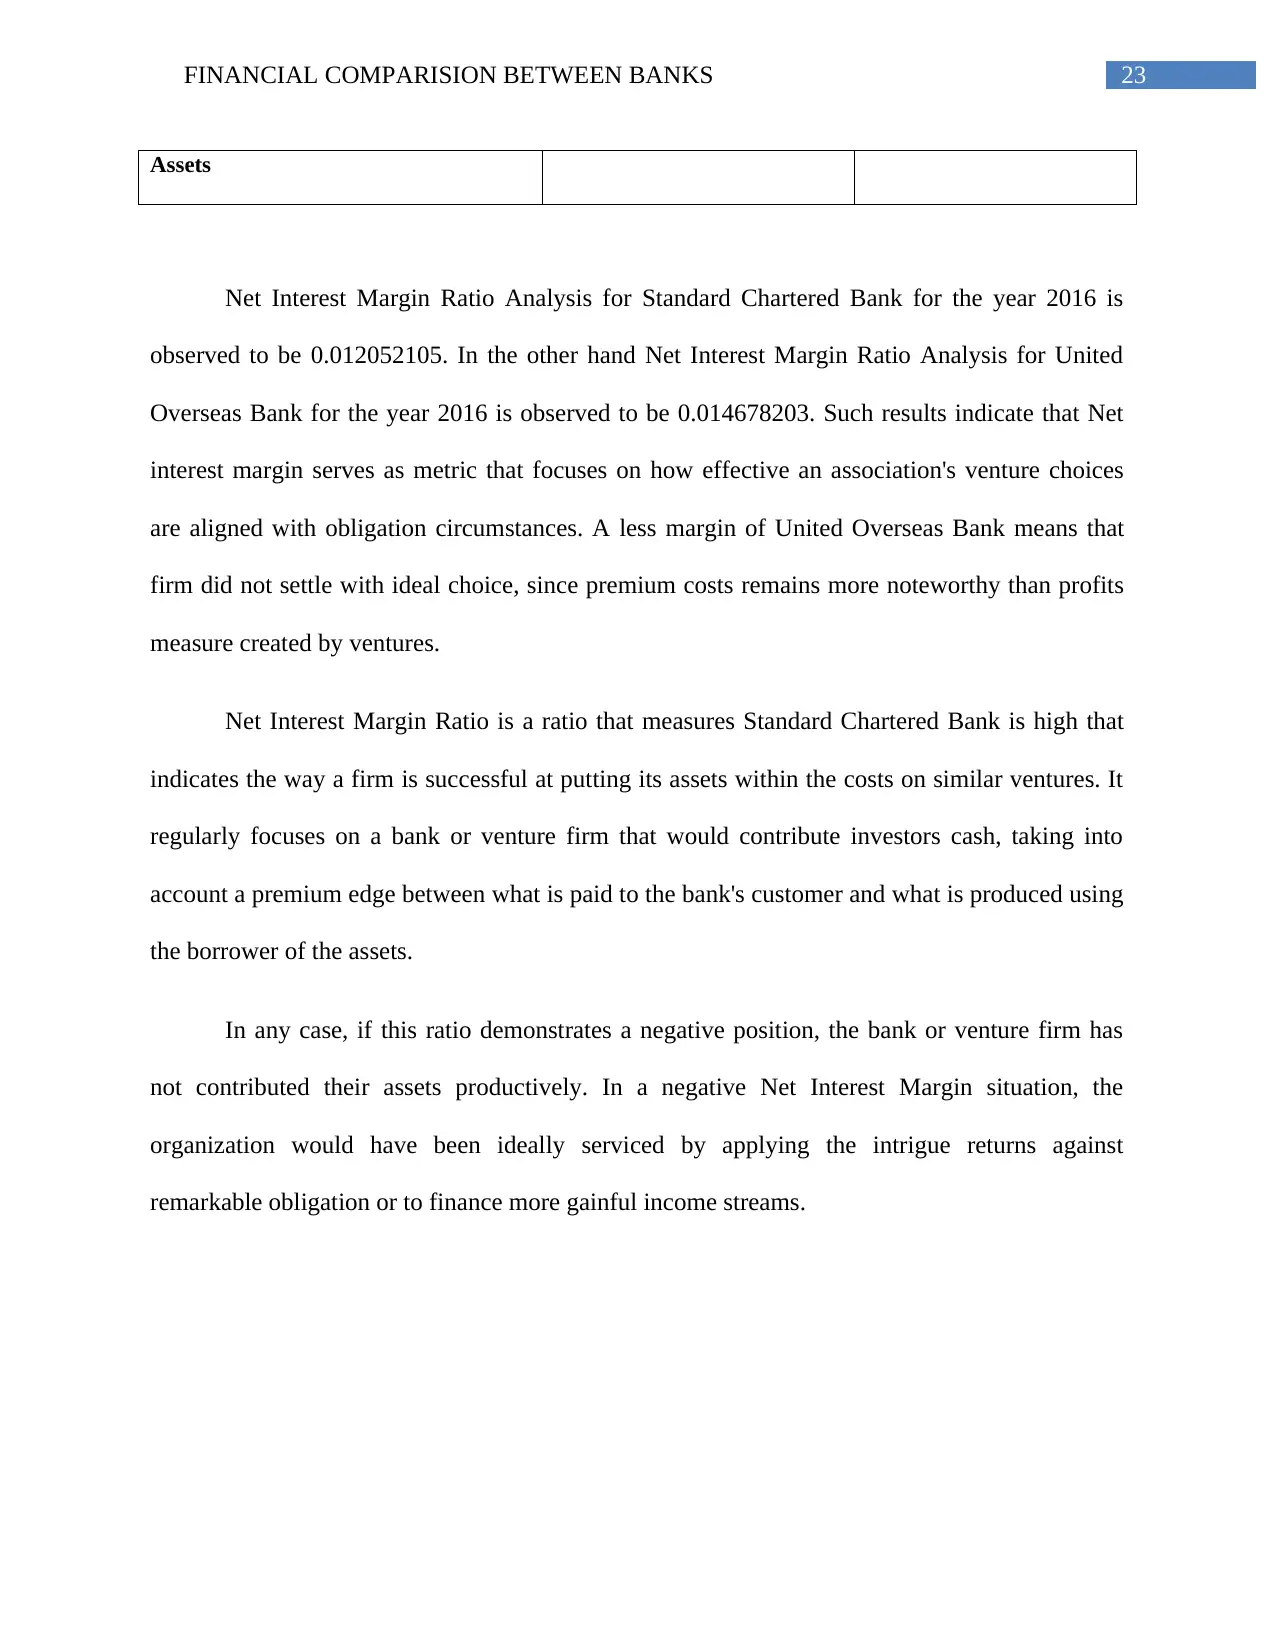
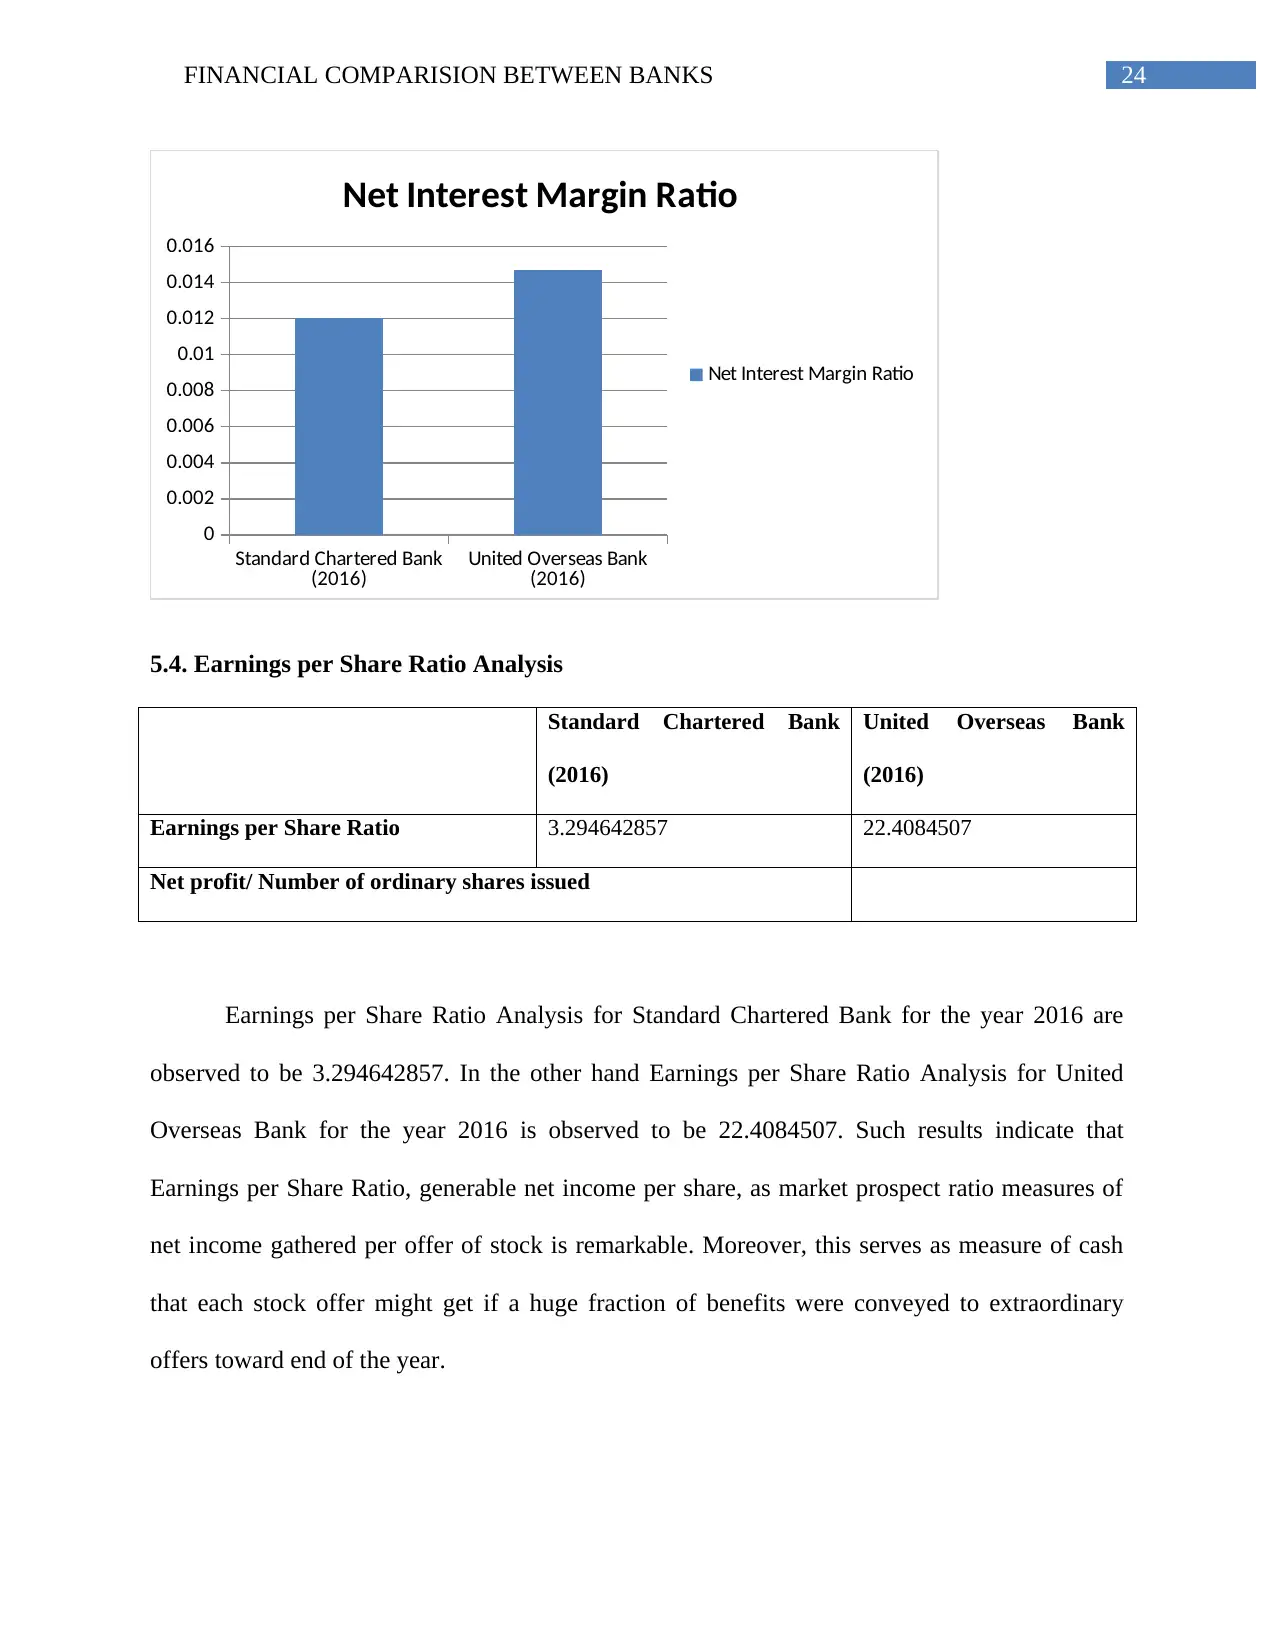
Net Interest Margin Ratio Analysis for Standard Chartered Bank for the year 2016 is
observed to be 0.012052105. In the other hand Net Interest Margin Ratio Analysis for United
Overseas Bank for the year 2016 is observed to be 0.014678203. Such results indicate that Net
interest margin serves as metric that focuses on how effective an association's venture choices
are aligned with obligation circumstances. A less margin of United Overseas Bank means that
firm did not settle with ideal choice, since premium costs remains more noteworthy than profits
measure created by ventures.
Net Interest Margin Ratio is a ratio that measures Standard Chartered Bank is high that
indicates the way a firm is successful at putting its assets within the costs on similar ventures. It
regularly focuses on a bank or venture firm that would contribute investors cash, taking into
account a premium edge between what is paid to the bank's customer and what is produced using
the borrower of the assets.
In any case, if this ratio demonstrates a negative position, the bank or venture firm has
not contributed their assets productively. In a negative Net Interest Margin situation, the
organization would have been ideally serviced by applying the intrigue returns against
remarkable obligation or to finance more gainful income streams.
Assets
Net Interest Margin Ratio Analysis for Standard Chartered Bank for the year 2016 is
observed to be 0.012052105. In the other hand Net Interest Margin Ratio Analysis for United
Overseas Bank for the year 2016 is observed to be 0.014678203. Such results indicate that Net
interest margin serves as metric that focuses on how effective an association's venture choices
are aligned with obligation circumstances. A less margin of United Overseas Bank means that
firm did not settle with ideal choice, since premium costs remains more noteworthy than profits
measure created by ventures.
Net Interest Margin Ratio is a ratio that measures Standard Chartered Bank is high that
indicates the way a firm is successful at putting its assets within the costs on similar ventures. It
regularly focuses on a bank or venture firm that would contribute investors cash, taking into
account a premium edge between what is paid to the bank's customer and what is produced using
the borrower of the assets.
In any case, if this ratio demonstrates a negative position, the bank or venture firm has
not contributed their assets productively. In a negative Net Interest Margin situation, the
organization would have been ideally serviced by applying the intrigue returns against
remarkable obligation or to finance more gainful income streams.
24FINANCIAL COMPARISION BETWEEN BANKS
Standard Chartered Bank
(2016) United Overseas Bank
(2016)
0
0.002
0.004
0.006
0.008
0.01
0.012
0.014
0.016
Net Interest Margin Ratio
Net Interest Margin Ratio
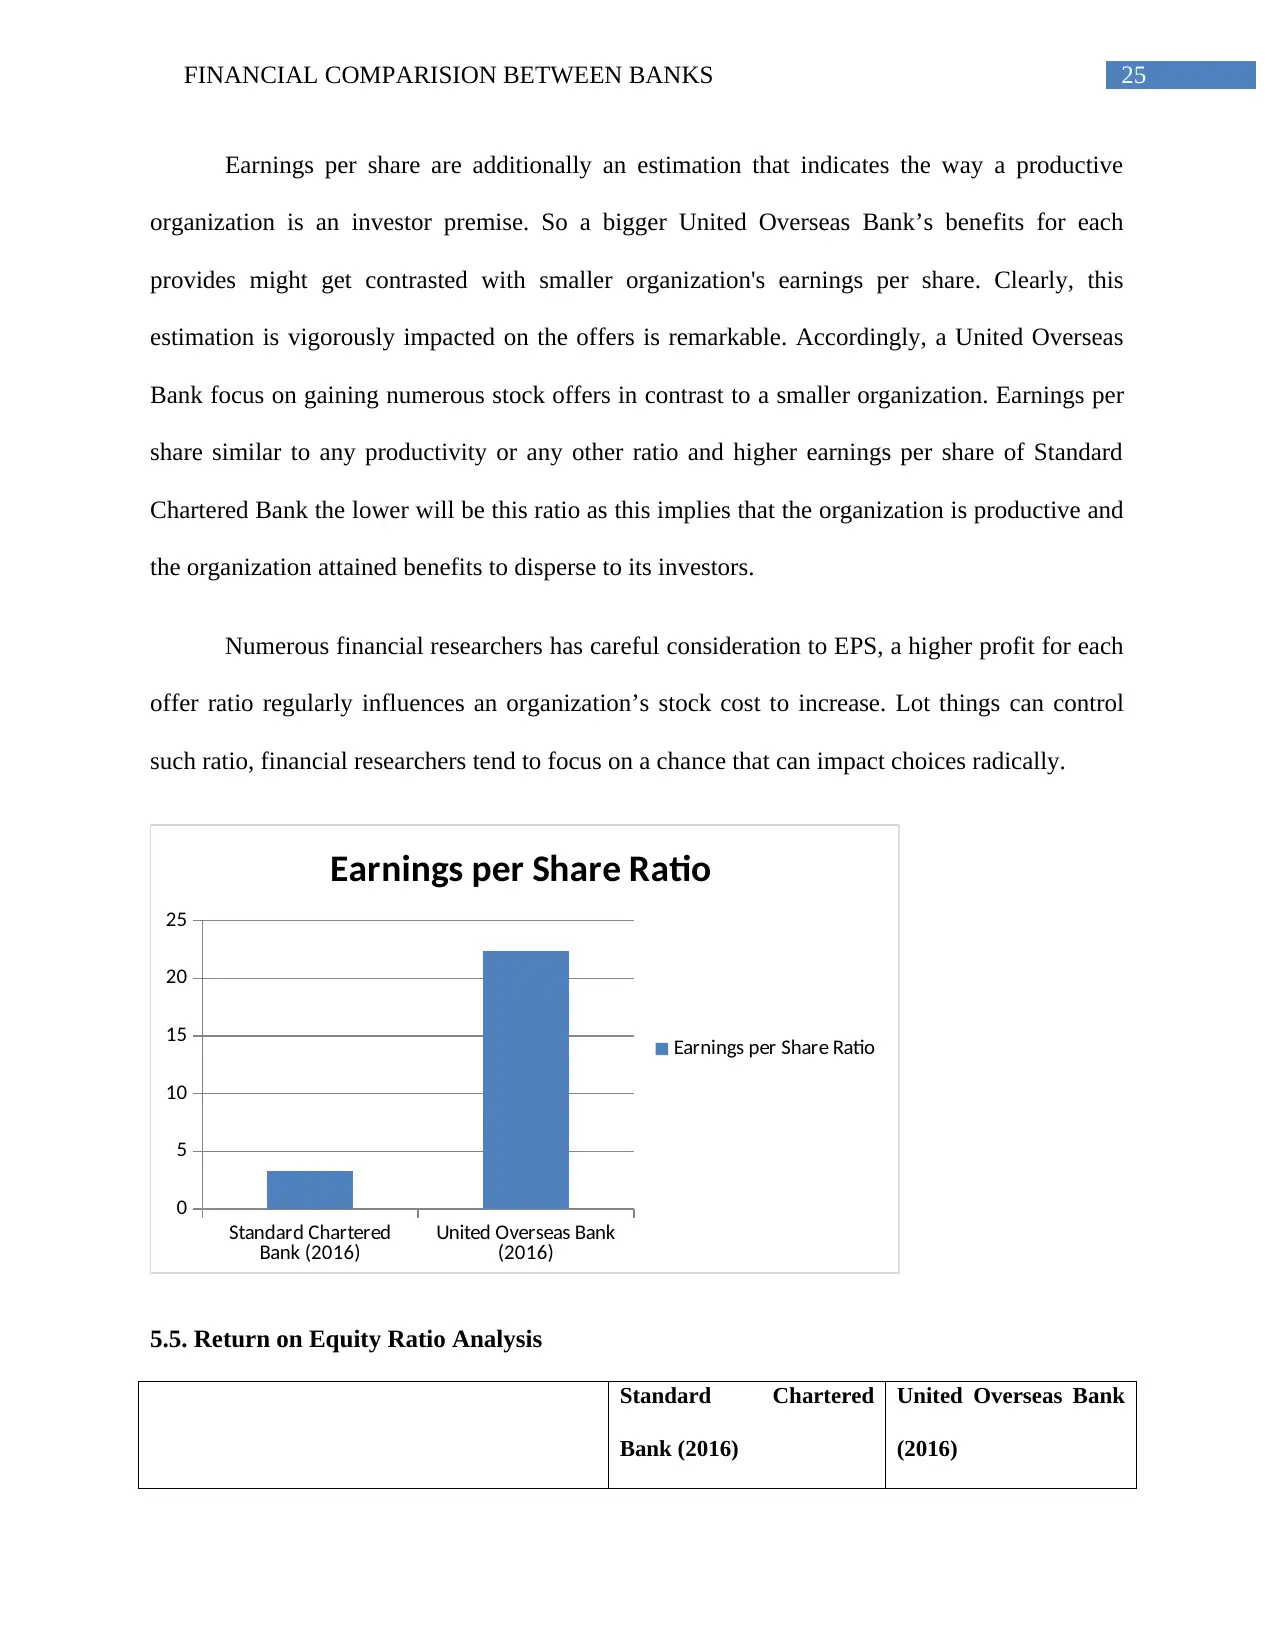
5.4. Earnings per Share Ratio Analysis
Standard Chartered Bank
(2016)
United Overseas Bank
(2016)
Earnings per Share Ratio 3.294642857 22.4084507
Net profit/ Number of ordinary shares issued
Earnings per Share Ratio Analysis for Standard Chartered Bank for the year 2016 are
observed to be 3.294642857. In the other hand Earnings per Share Ratio Analysis for United
Overseas Bank for the year 2016 is observed to be 22.4084507. Such results indicate that
Earnings per Share Ratio, generable net income per share, as market prospect ratio measures of
net income gathered per offer of stock is remarkable. Moreover, this serves as measure of cash
that each stock offer might get if a huge fraction of benefits were conveyed to extraordinary
offers toward end of the year.
Standard Chartered Bank
(2016) United Overseas Bank
(2016)
0
0.002
0.004
0.006
0.008
0.01
0.012
0.014
0.016
Net Interest Margin Ratio
Net Interest Margin Ratio
5.4. Earnings per Share Ratio Analysis
Standard Chartered Bank
(2016)
United Overseas Bank
(2016)
Earnings per Share Ratio 3.294642857 22.4084507
Net profit/ Number of ordinary shares issued
Earnings per Share Ratio Analysis for Standard Chartered Bank for the year 2016 are
observed to be 3.294642857. In the other hand Earnings per Share Ratio Analysis for United
Overseas Bank for the year 2016 is observed to be 22.4084507. Such results indicate that
Earnings per Share Ratio, generable net income per share, as market prospect ratio measures of
net income gathered per offer of stock is remarkable. Moreover, this serves as measure of cash
that each stock offer might get if a huge fraction of benefits were conveyed to extraordinary
offers toward end of the year.
Paraphrase This Document
Need a fresh take? Get an instant paraphrase of this document with our AI Paraphraser
25FINANCIAL COMPARISION BETWEEN BANKS
Earnings per share are additionally an estimation that indicates the way a productive
organization is an investor premise. So a bigger United Overseas Bank’s benefits for each
provides might get contrasted with smaller organization's earnings per share. Clearly, this
estimation is vigorously impacted on the offers is remarkable. Accordingly, a United Overseas
Bank focus on gaining numerous stock offers in contrast to a smaller organization. Earnings per
share similar to any productivity or any other ratio and higher earnings per share of Standard
Chartered Bank the lower will be this ratio as this implies that the organization is productive and
the organization attained benefits to disperse to its investors.
Numerous financial researchers has careful consideration to EPS, a higher profit for each
offer ratio regularly influences an organization’s stock cost to increase. Lot things can control
such ratio, financial researchers tend to focus on a chance that can impact choices radically.
Standard Chartered
Bank (2016) United Overseas Bank
(2016)
0
5
10
15
20
25
Earnings per Share Ratio
Earnings per Share Ratio
5.5. Return on Equity Ratio Analysis
Standard Chartered
Bank (2016)
United Overseas Bank
(2016)
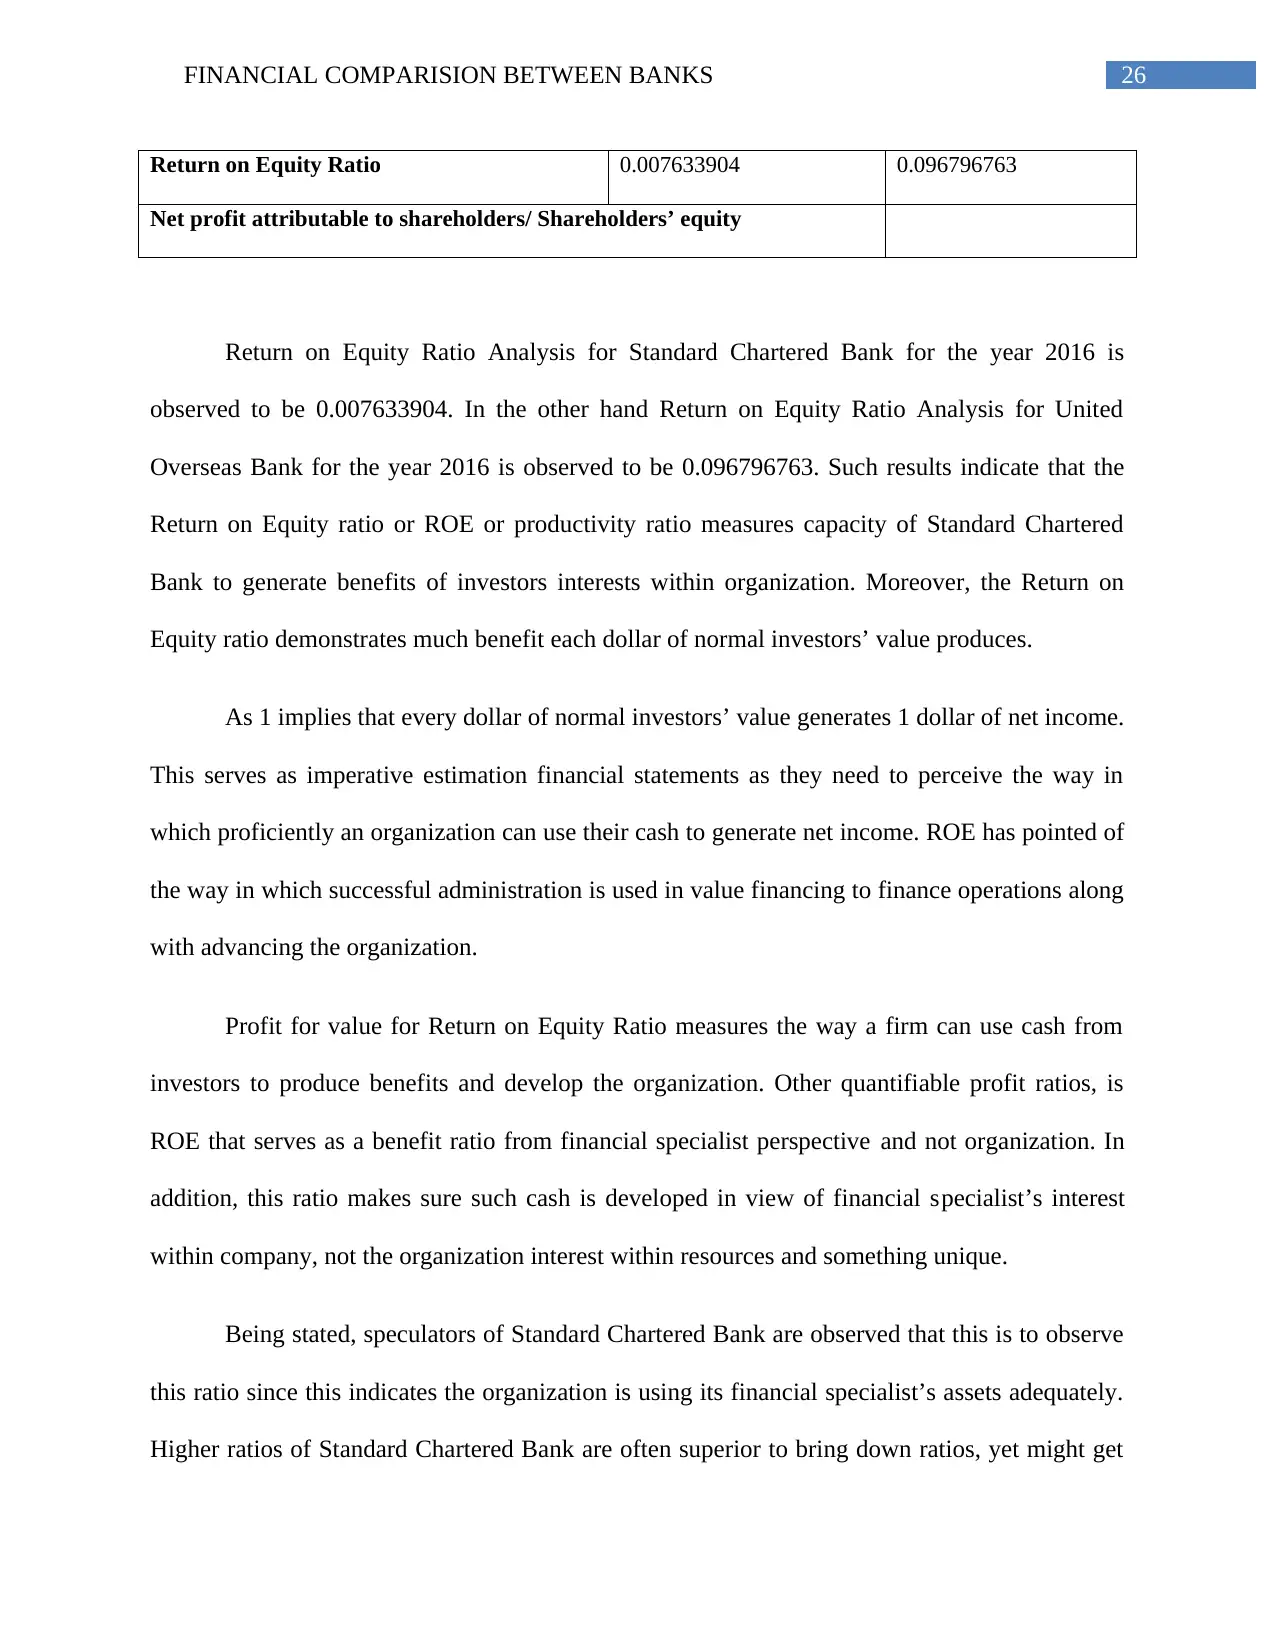
26FINANCIAL COMPARISION BETWEEN BANKS
Return on Equity Ratio 0.007633904 0.096796763
Net profit attributable to shareholders/ Shareholders’ equity
Return on Equity Ratio Analysis for Standard Chartered Bank for the year 2016 is
observed to be 0.007633904. In the other hand Return on Equity Ratio Analysis for United
Overseas Bank for the year 2016 is observed to be 0.096796763. Such results indicate that the
Return on Equity ratio or ROE or productivity ratio measures capacity of Standard Chartered
Bank to generate benefits of investors interests within organization. Moreover, the Return on
Equity ratio demonstrates much benefit each dollar of normal investors’ value produces.
As 1 implies that every dollar of normal investors’ value generates 1 dollar of net income.
This serves as imperative estimation financial statements as they need to perceive the way in
which proficiently an organization can use their cash to generate net income. ROE has pointed of
the way in which successful administration is used in value financing to finance operations along
with advancing the organization.
Profit for value for Return on Equity Ratio measures the way a firm can use cash from
investors to produce benefits and develop the organization. Other quantifiable profit ratios, is
ROE that serves as a benefit ratio from financial specialist perspective and not organization. In
addition, this ratio makes sure such cash is developed in view of financial specialist’s interest
within company, not the organization interest within resources and something unique.
Being stated, speculators of Standard Chartered Bank are observed that this is to observe
this ratio since this indicates the organization is using its financial specialist’s assets adequately.
Higher ratios of Standard Chartered Bank are often superior to bring down ratios, yet might get
27FINANCIAL COMPARISION BETWEEN BANKS
contrasted with organizations ratios in business. Since each industry has distinctive levels of
financial specialists and salary, ROE can be utilized to look at organizations outside of their
ventures adequately.
Standard Chartered
Bank (2016) United Overseas Bank
(2016)
0
0.02
0.04
0.06
0.08
0.1
0.12
Return on Equity Ratio
Return on Equity Ratio
5.6. Capital Adequacy Ratio Analysis
Standard Chartered Bank
(2016)
United Overseas Bank
(2016)
Capital adequacy ratio 649.1448931 93.00361359
Teir1+ Teir2 capital/ Risk weighted
assets
Capital Adequacy Ratio Analysis for Standard Chartered Bank for the year 2016 is
observed to be 649.1448931. In the other hand Capital Adequacy Ratio Analysis for United
Overseas Bank for the year 2016 is observed to be 93.00361359. Such results indicate that
Secure Best Marks with AI Grader
Need help grading? Try our AI Grader for instant feedback on your assignments.
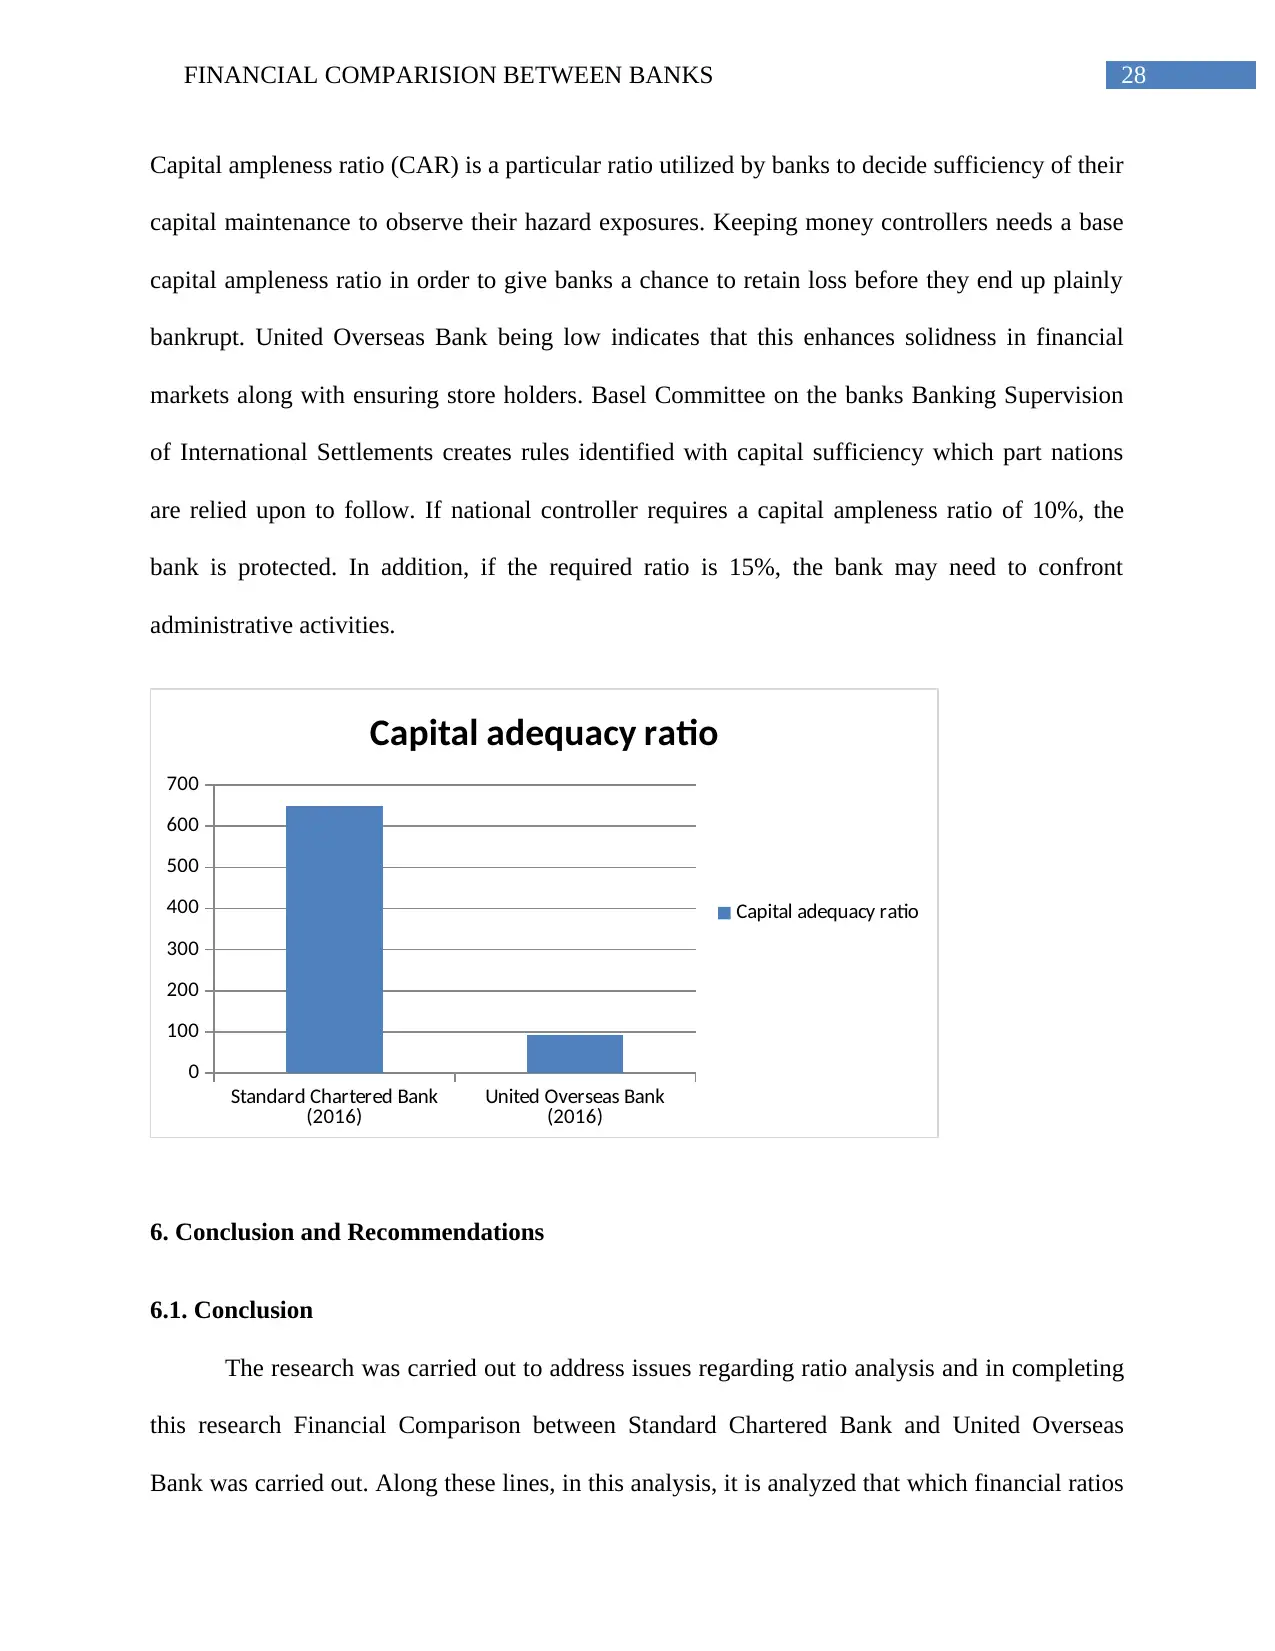
28FINANCIAL COMPARISION BETWEEN BANKS
Capital ampleness ratio (CAR) is a particular ratio utilized by banks to decide sufficiency of their
capital maintenance to observe their hazard exposures. Keeping money controllers needs a base
capital ampleness ratio in order to give banks a chance to retain loss before they end up plainly
bankrupt. United Overseas Bank being low indicates that this enhances solidness in financial
markets along with ensuring store holders. Basel Committee on the banks Banking Supervision
of International Settlements creates rules identified with capital sufficiency which part nations
are relied upon to follow. If national controller requires a capital ampleness ratio of 10%, the
bank is protected. In addition, if the required ratio is 15%, the bank may need to confront
administrative activities.
Standard Chartered Bank
(2016) United Overseas Bank
(2016)
0
100
200
300
400
500
600
700
Capital adequacy ratio
Capital adequacy ratio
6. Conclusion and Recommendations
6.1. Conclusion
The research was carried out to address issues regarding ratio analysis and in completing
this research Financial Comparison between Standard Chartered Bank and United Overseas
Bank was carried out. Along these lines, in this analysis, it is analyzed that which financial ratios
29FINANCIAL COMPARISION BETWEEN BANKS
could be utilized in the best approach to counteract bank disappointments. From the financial and
ratio analysis it was gathered that Credit loss ratio indicate that this ratio measures the intensity
of risk resource that is presented to the bank and supports the guarantor organization to perceive
what sort of activities and arrangements they have to embrace keeping in mind the end goal to
alleviate the loss in the event that the risk is high. The credit loss ratio will help them to break
down the measure of risks that their home loans are dealing with and additionally choose the
arrangement they might want to embrace so as to relieve the hazard.
6.2. Recommendations to Banks
Relied on findings of financial ratio analysis of selected banks namely Standard Chartered
Bank Plc and United Overseas Bank certain important recommendations are provided to both the
banks. Financial ratio analysis helps to derive an organization's arrival on value so as the after-
charge cost of obligation is lower than its arrival on value.
Enhance resource turnover: Resource turnover is a measure of an organization's
productivity. One can find it by separating deals by the organization's aggregate resources. All in
all, the deals that a company produces with respect to certain benefits can get highly beneficial
and higher profit for value it can obtain.
United Overseas Bank is recommended to start disseminating immobile money to
investors that can be a viable approach for an organization. The main difference in this
illustration is how much settlement without moving money is perched on the financial record. At
the point when money increases within an organization's financial report, it can drag down an
organization's arrival on value. This is the reason it's vital to consider an organization's financial
use while examining an organization's arrival on value.

30FINANCIAL COMPARISION BETWEEN BANKS
Paraphrase This Document
Need a fresh take? Get an instant paraphrase of this document with our AI Paraphraser
31FINANCIAL COMPARISION BETWEEN BANKS
Reference List
Aggarwal, S., Paruthi, R. and Kumar, R., 2014. Financial Performance of Indian Banks. BVIMR
Management Edge, 7(2).
Altman, E.I., 2013. Financial ratios, discriminant analysis and the prediction of corporate
bankruptcy. The journal of finance, 23(4), pp.589-609.
Avkiran, N.K., 2011. Association of DEA super-efficiency estimates with financial ratios:
Investigating the case for Chinese banks. Omega, 39(3), pp.323-334.
Barathi Kamath, G., 2017. The intellectual capital performance of the Indian banking
sector. Journal of Intellectual Capital, 8(1), pp.96-123.
Beaver, W.H., Correia, M. and McNichols, M.F., 2012. Do differences in financial reporting
attributes impair the predictive ability of financial ratios for bankruptcy?. Review of Accounting
Studies, 17(4), pp.969-1010.
Berger, A.N., DeYoung, R., Flannery, M.J., Lee, D. and Öztekin, Ö., 2012. How do large
banking organizations manage their capital ratios?. Journal of Financial Services
Research, 34(2-3), pp.123-149.
Bhattacharyya, A., Lovell, C.K. and Sahay, P., 2013. The impact of liberalization on the
productive efficiency of Indian commercial banks. European Journal of operational
research, 98(2), pp.332-345.
Bodie, Z., 2013. Investments. McGraw-Hill.
32FINANCIAL COMPARISION BETWEEN BANKS
Cebenoyan, A.S. and Strahan, P.E., 2014. Risk management, capital structure and lending at
banks. Journal of Banking & Finance, 28(1), pp.19-43.
Chandra, P., 2011. Financial management. Tata McGraw-Hill Education.
Chaudhary, K. and Sharma, M., 2011. Performance of Indian public sector banks and private
sector banks: A comparative study. International journal of innovation, management and
technology, 2(3), p.249.
Chen Goh, P., 2015. Intellectual capital performance of commercial banks in Malaysia. Journal
of intellectual capital, 6(3), pp.385-396.
Chiaramonte, L. and Casu, B., 2017. Capital and liquidity ratios and financial distress. Evidence
from the European banking industry. The British Accounting Review, 49(2), pp.138-161.
Chu, S.F. and Lim, G.H., 2014. Share performance and profit efficiency of banks in an
oligopolistic market: evidence from Singapore. Journal of Multinational Financial
Management, 8(2), pp.155-168.
Čihák, M. and Schaeck, K., 2015. How well do aggregate prudential ratios identify banking
system problems?. Journal of Financial Stability, 6(3), pp.130-144.
Fethi, M.D. and Pasiouras, F., 2014. Assessing bank efficiency and performance with operational
research and artificial intelligence techniques: A survey. European journal of operational
research, 204(2), pp.189-198.
Francis, W.B. and Osborne, M., 2015. On the Behavior and Determinants of Risk‐Based Capital
Ratios: Revisiting the Evidence from UK Banking Institutions. International Review of
Finance, 10(4), pp.485-518.
1 out of 33
Your All-in-One AI-Powered Toolkit for Academic Success.
+13062052269
info@desklib.com
Available 24*7 on WhatsApp / Email
![[object Object]](/_next/static/media/star-bottom.7253800d.svg)
Unlock your academic potential
© 2024 | Zucol Services PVT LTD | All rights reserved.