Financial Data Interpretation and Strategic Decision Making
VerifiedAdded on 2023/06/09
|20
|4577
|198
Report
AI Summary
This report provides a comprehensive financial analysis of Samsung PLC, utilizing financial statements such as income statements, balance sheets, and cash flow statements to assess the company's financial performance and strategic position. It includes a detailed interpretation of financial ratios, comparing performance across several accounting periods, and offers recommendations to Samsung PLC for enhancing commercial operations. Furthermore, the report explores the impact of innovative accounting methods on strategic choices, discusses the limitations of ratio analysis, and emphasizes the significance of cash flow management in capital spending proposals. A capital expenditure appraisal is conducted, evaluating the replacement of an outdated machine using financial techniques like Net Present Value and Internal Rate of Return to determine the financial viability of such an investment.
Financial Data and
Strategic Decision
Making
Strategic Decision
Making
Paraphrase This Document
Need a fresh take? Get an instant paraphrase of this document with our AI Paraphraser
Contents
INTRODUCTION...........................................................................................................................3
TASK 1 Financial Data and Strategic Decision Making.................................................................3
(Covered in PPT).........................................................................................................................3
TASK 2 Discussion Paper...............................................................................................................3
2.1 Interpretation of financial ratios of Samsung PLC to analyse the current viability of the
Company......................................................................................................................................3
2.2 Comparative analysis of financial ratio for Samsung PLC:..................................................5
2.3 Recommendation to Samsung PLC based on evaluation and interpretation of financial
position......................................................................................................................................10
TASK 3 Information Leaflet.........................................................................................................11
3.1 Effect of innovative accounting methods on strategic choices............................................11
3.2 Ratio analysis's shortcomings as a tool for strategic decision-making................................11
3.3 The significance of cash flow management when assessing capital spending proposals....12
3.4 Methods and tools are recommended to help businesses analyse financial data for the aim
of making strategic decisions.....................................................................................................12
TASK 4 Capital Expenditure Appraisal........................................................................................13
4.1 Assessment of capital expenditure proposal with the help of suitable financial technique:13
CONCLUSION..............................................................................................................................17
REFERENCES..............................................................................................................................18
INTRODUCTION
Finance refers to the procedure of increasing funds that help company to meet their day to
day operational need and wants. All businesses have financial needs since they support the
corporations' demand for operating capital (Cao, Guo and Zhang., 2020). In the below report,
Financial statements of the company is assessed which include income statement, statement of
financial position and cash flow statement which help company to analyse their financial
performance. There are other risk categories that have an impact on company strategy, such as
credit risk, market risk, liquidity risk, etc. These categories have been briefly outlined. This
report delivers a financial analysis of Samsung PLC's financial data, including ratio analysis for
several accounting periods so that success may be assessed. It has been suggested to Samsung
PLC that they improvise their approach in order to enhance commercial operations and
procedures. At the conclusion of this report, a capital budgeting choice has been taken regarding
the substitute of an out-dated machine with a new one using various financial techniques,
including the Net Present Value method, Internal Rate of Return method, Profitability index, etc.,
and a determination has been made as to whether or not such a replacement is advantageous to
the entity.
TASK 1 Financial Data and Strategic Decision Making
(Covered in PPT)
TASK 2 Discussion Paper
2.1 Interpretation of financial ratios of Samsung PLC to analyse the current viability of the
Company
Samsung is named as Samsung electronics limited established during the year 1969 and
registered as stock market listed company during the year 1975. They deals in different product
segments which includes consumer electronics, mobile telecommunication, information
technologies etc. Where Consumer electronics includes various products like television,
washing machines, air conditioners etc. Mobile telecommunication includes mobile handsets,
telecommunication networks, workstations etc. Financial accounting books is prepared by the
Korean firm which known as Korean IFRS (Dieci and He, 2018).
⊘ This is a preview!⊘
Do you want full access?
Subscribe today to unlock all pages.
Trusted by 1+ million students worldwide
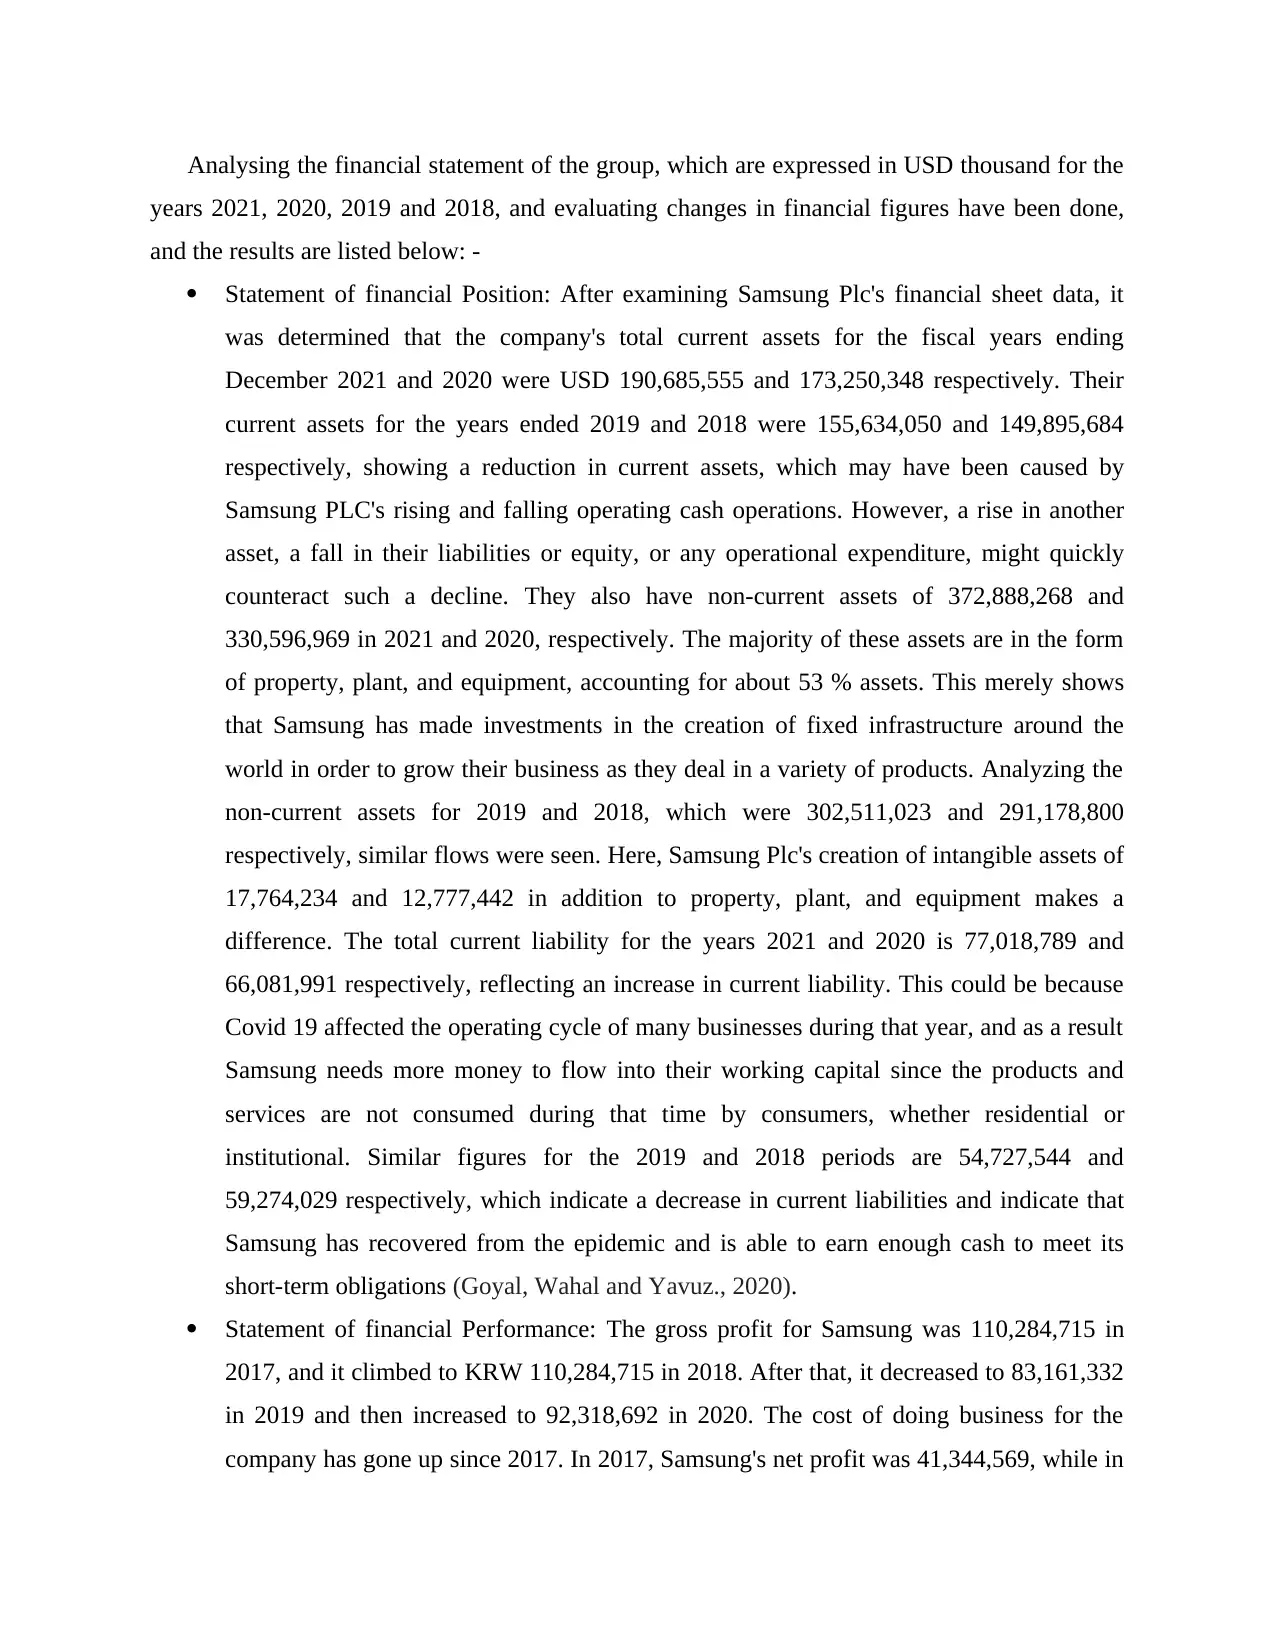
Analysing the financial statement of the group, which are expressed in USD thousand for the
years 2021, 2020, 2019 and 2018, and evaluating changes in financial figures have been done,
and the results are listed below: -
Statement of financial Position: After examining Samsung Plc's financial sheet data, it
was determined that the company's total current assets for the fiscal years ending
December 2021 and 2020 were USD 190,685,555 and 173,250,348 respectively. Their
current assets for the years ended 2019 and 2018 were 155,634,050 and 149,895,684
respectively, showing a reduction in current assets, which may have been caused by
Samsung PLC's rising and falling operating cash operations. However, a rise in another
asset, a fall in their liabilities or equity, or any operational expenditure, might quickly
counteract such a decline. They also have non-current assets of 372,888,268 and
330,596,969 in 2021 and 2020, respectively. The majority of these assets are in the form
of property, plant, and equipment, accounting for about 53 % assets. This merely shows
that Samsung has made investments in the creation of fixed infrastructure around the
world in order to grow their business as they deal in a variety of products. Analyzing the
non-current assets for 2019 and 2018, which were 302,511,023 and 291,178,800
respectively, similar flows were seen. Here, Samsung Plc's creation of intangible assets of
17,764,234 and 12,777,442 in addition to property, plant, and equipment makes a
difference. The total current liability for the years 2021 and 2020 is 77,018,789 and
66,081,991 respectively, reflecting an increase in current liability. This could be because
Covid 19 affected the operating cycle of many businesses during that year, and as a result
Samsung needs more money to flow into their working capital since the products and
services are not consumed during that time by consumers, whether residential or
institutional. Similar figures for the 2019 and 2018 periods are 54,727,544 and
59,274,029 respectively, which indicate a decrease in current liabilities and indicate that
Samsung has recovered from the epidemic and is able to earn enough cash to meet its
short-term obligations (Goyal, Wahal and Yavuz., 2020).
Statement of financial Performance: The gross profit for Samsung was 110,284,715 in
2017, and it climbed to KRW 110,284,715 in 2018. After that, it decreased to 83,161,332
in 2019 and then increased to 92,318,692 in 2020. The cost of doing business for the
company has gone up since 2017. In 2017, Samsung's net profit was 41,344,569, while in
Paraphrase This Document
Need a fresh take? Get an instant paraphrase of this document with our AI Paraphraser
2018, it was 43,890,877. Samsung's net profit, however, significantly dropped in 2019 to
$21,505,054, and it increased to $26,090,846 in 2020.
Statement of cash flow: Samsung's operating cash flows have decreased from 67,031,863
in 2018 to 45,382,915 in 2019, and then climbed to 65,287,009 in 2020, according to an
assessment of the firm's cash statement. From 39,948,171 in 2019 to 53,628,591 in 2020,
Samsung's net cash utilised for investment operations has grown. Samsung's free cash
flow in 2019 was 16,765,245 and it will be 25,015,196 in 2020.
2.2 Comparative analysis of financial ratio for Samsung PLC:
The following is the ratio analysis of Samsung PLC as shown under: -
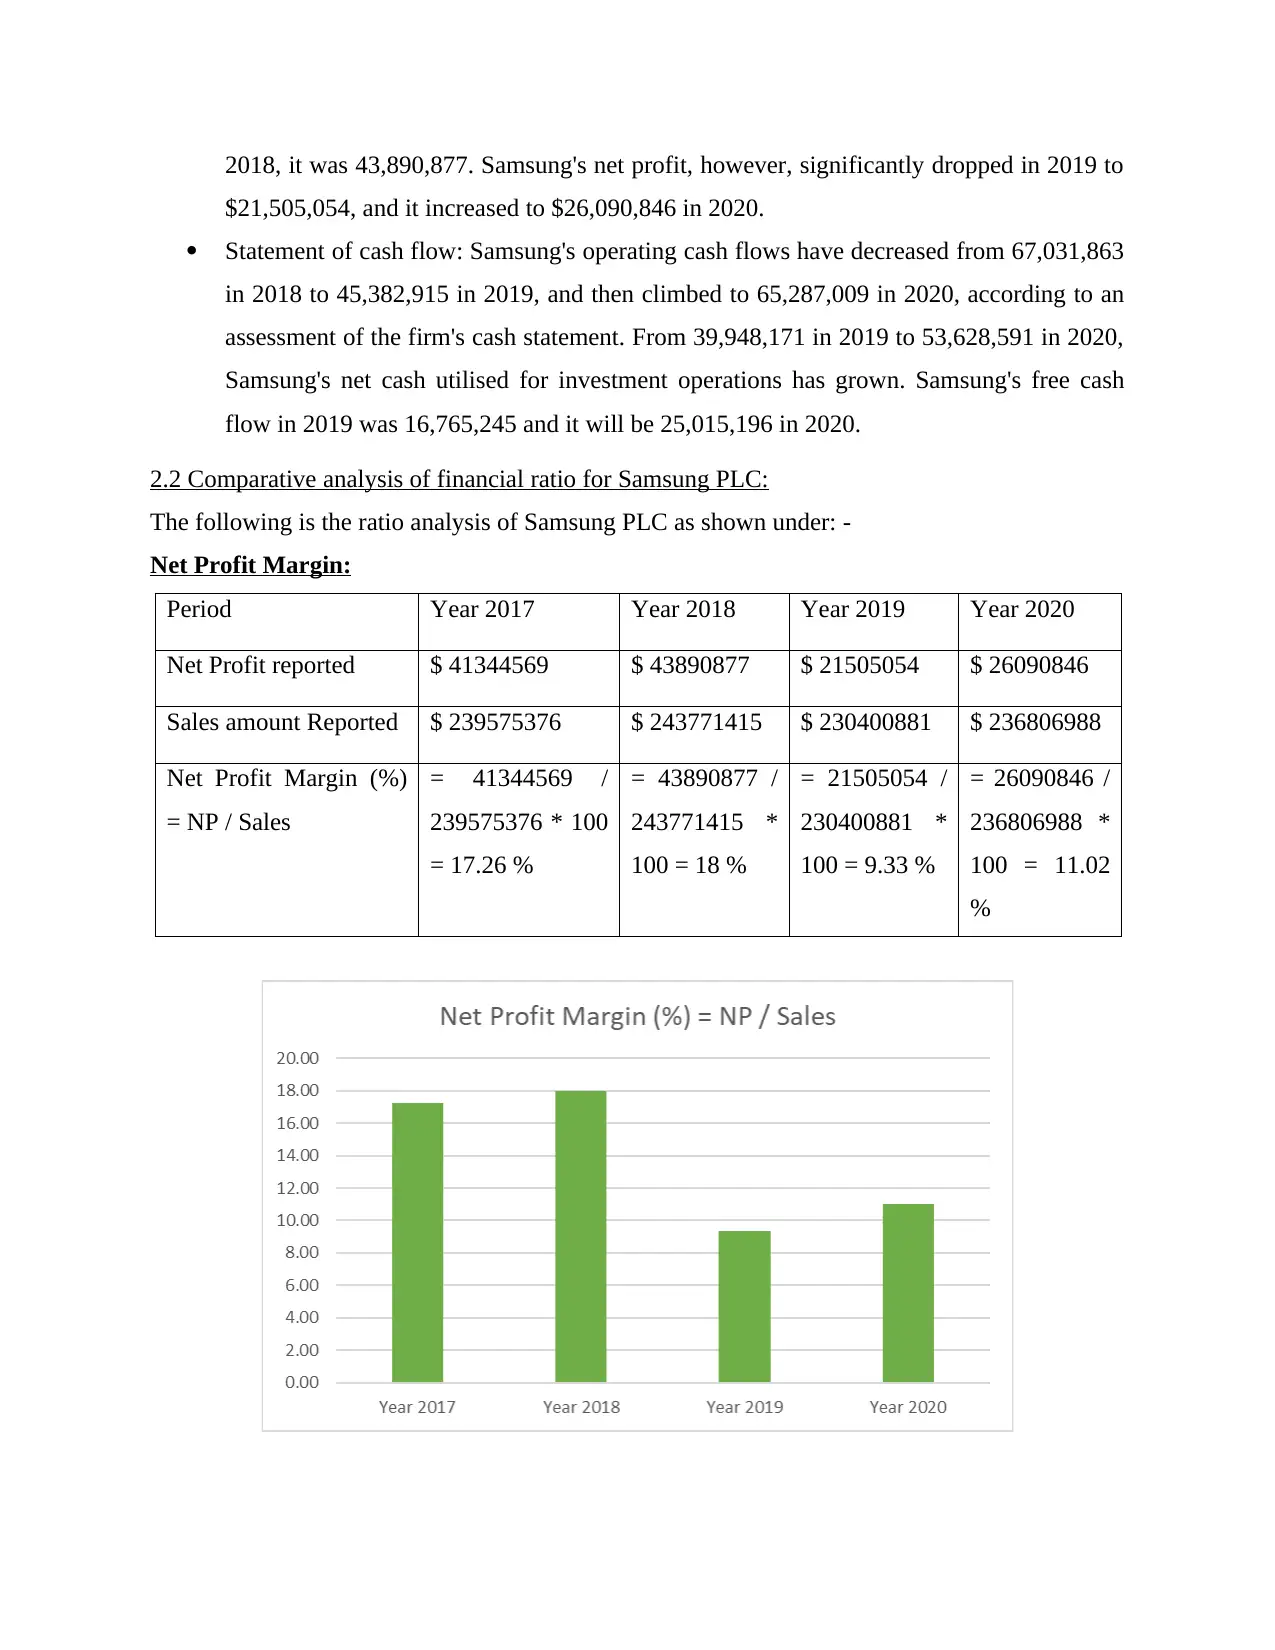
Net Profit Margin:
Period Year 2017 Year 2018 Year 2019 Year 2020
Net Profit reported $ 41344569 $ 43890877 $ 21505054 $ 26090846
Sales amount Reported $ 239575376 $ 243771415 $ 230400881 $ 236806988
Net Profit Margin (%)
= NP / Sales
= 41344569 /
239575376 * 100
= 17.26 %
= 43890877 /
243771415 *
100 = 18 %
= 21505054 /
230400881 *
100 = 9.33 %
= 26090846 /
236806988 *
100 = 11.02
%
$21,505,054, and it increased to $26,090,846 in 2020.
Statement of cash flow: Samsung's operating cash flows have decreased from 67,031,863
in 2018 to 45,382,915 in 2019, and then climbed to 65,287,009 in 2020, according to an
assessment of the firm's cash statement. From 39,948,171 in 2019 to 53,628,591 in 2020,
Samsung's net cash utilised for investment operations has grown. Samsung's free cash
flow in 2019 was 16,765,245 and it will be 25,015,196 in 2020.
2.2 Comparative analysis of financial ratio for Samsung PLC:
The following is the ratio analysis of Samsung PLC as shown under: -
Net Profit Margin:
Period Year 2017 Year 2018 Year 2019 Year 2020
Net Profit reported $ 41344569 $ 43890877 $ 21505054 $ 26090846
Sales amount Reported $ 239575376 $ 243771415 $ 230400881 $ 236806988
Net Profit Margin (%)
= NP / Sales
= 41344569 /
239575376 * 100
= 17.26 %
= 43890877 /
243771415 *
100 = 18 %
= 21505054 /
230400881 *
100 = 9.33 %
= 26090846 /
236806988 *
100 = 11.02
%
Interpretation: According to the above table and graph it is analyzed that net profit percentage of
Samsung Plc in year 2019 is 9.33%, in year 2018 is 18%, in year 2017 is 17.86%. it states that
profit percentage of Samsung Plc is decreased year by year. Fluctuation of net profit percentage
is clearly shown in the above graph. Company is back on the track in 2020 to improve its net
profit ratio. Net profit ratio of 2020 is 17.26% which shows that company working efficiently to
improve its position.
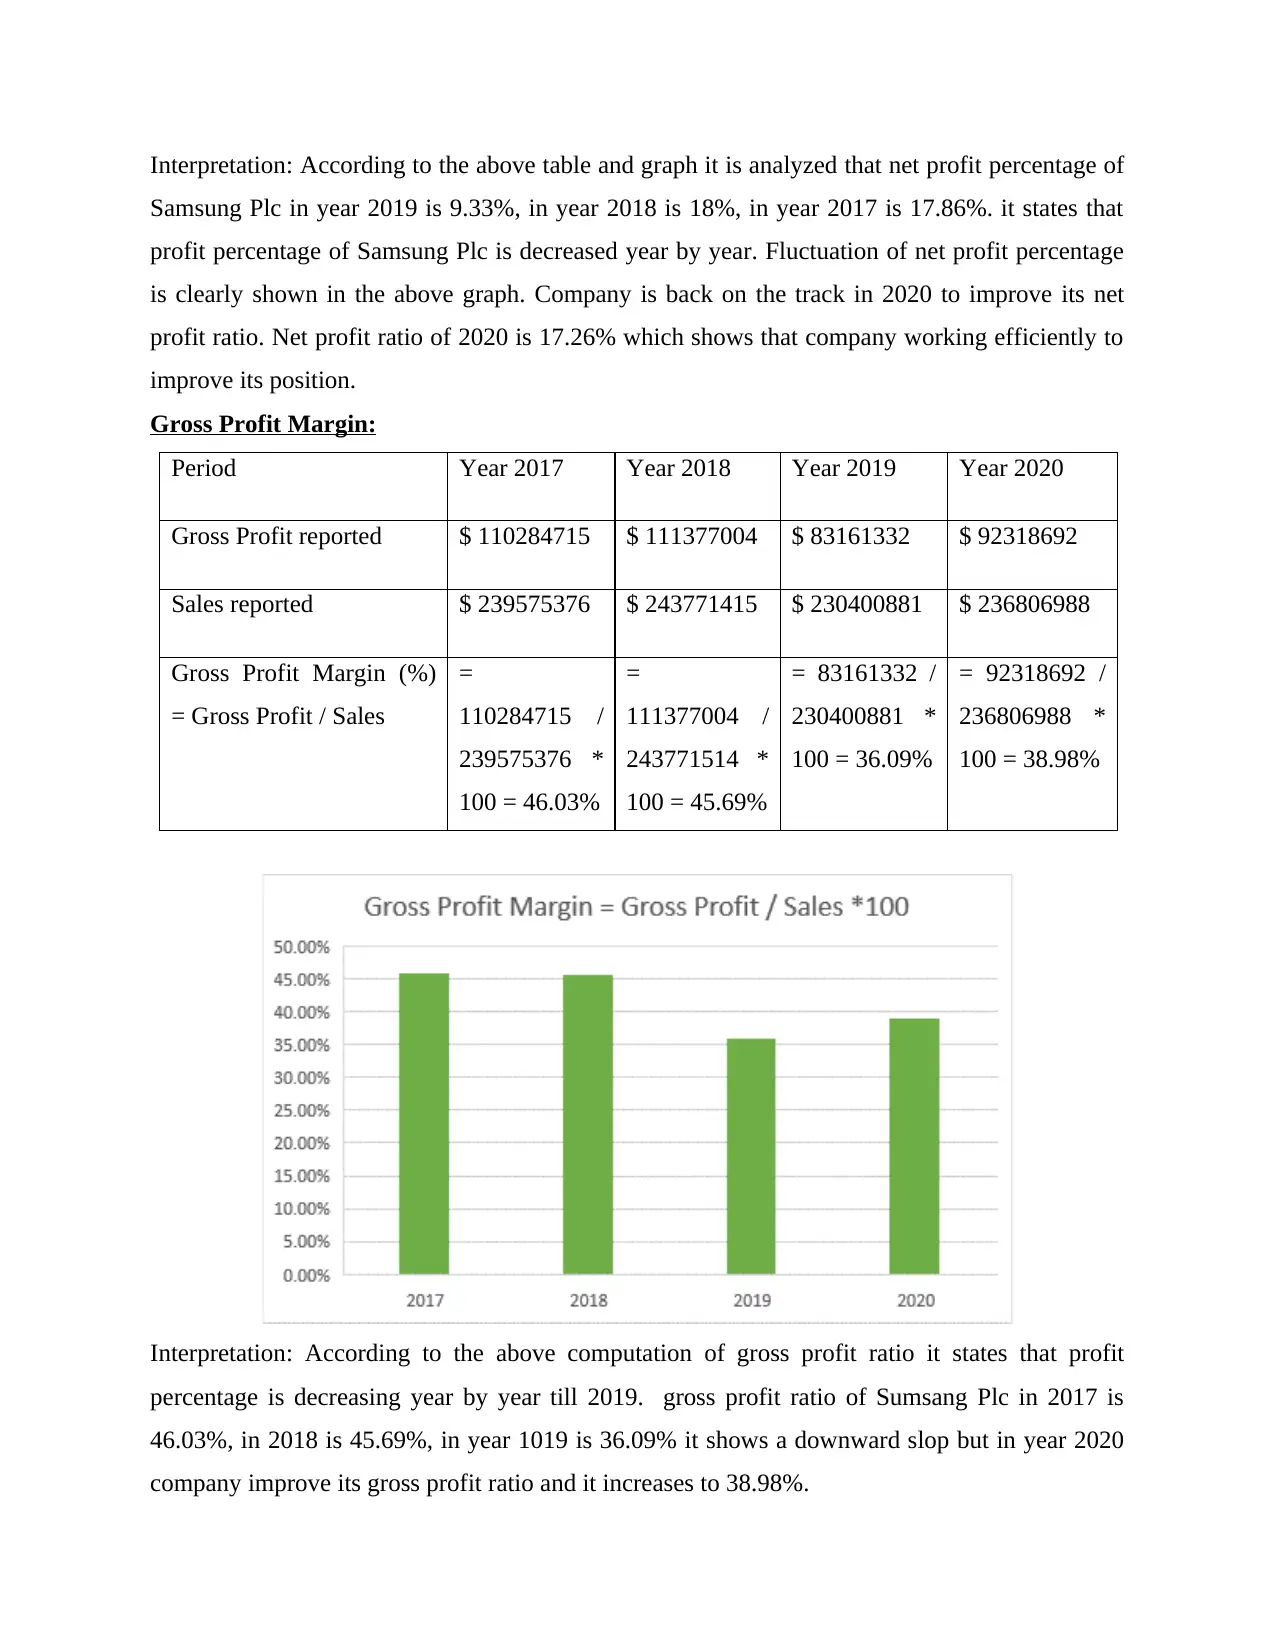
Gross Profit Margin:
Period Year 2017 Year 2018 Year 2019 Year 2020
Gross Profit reported $ 110284715 $ 111377004 $ 83161332 $ 92318692
Sales reported $ 239575376 $ 243771415 $ 230400881 $ 236806988
Gross Profit Margin (%)
= Gross Profit / Sales
=
110284715 /
239575376 *
100 = 46.03%
=
111377004 /
243771514 *
100 = 45.69%
= 83161332 /
230400881 *
100 = 36.09%
= 92318692 /
236806988 *
100 = 38.98%
Interpretation: According to the above computation of gross profit ratio it states that profit
percentage is decreasing year by year till 2019. gross profit ratio of Sumsang Plc in 2017 is
46.03%, in 2018 is 45.69%, in year 1019 is 36.09% it shows a downward slop but in year 2020
company improve its gross profit ratio and it increases to 38.98%.
Samsung Plc in year 2019 is 9.33%, in year 2018 is 18%, in year 2017 is 17.86%. it states that
profit percentage of Samsung Plc is decreased year by year. Fluctuation of net profit percentage
is clearly shown in the above graph. Company is back on the track in 2020 to improve its net
profit ratio. Net profit ratio of 2020 is 17.26% which shows that company working efficiently to
improve its position.
Gross Profit Margin:
Period Year 2017 Year 2018 Year 2019 Year 2020
Gross Profit reported $ 110284715 $ 111377004 $ 83161332 $ 92318692
Sales reported $ 239575376 $ 243771415 $ 230400881 $ 236806988
Gross Profit Margin (%)
= Gross Profit / Sales
=
110284715 /
239575376 *
100 = 46.03%
=
111377004 /
243771514 *
100 = 45.69%
= 83161332 /
230400881 *
100 = 36.09%
= 92318692 /
236806988 *
100 = 38.98%
Interpretation: According to the above computation of gross profit ratio it states that profit
percentage is decreasing year by year till 2019. gross profit ratio of Sumsang Plc in 2017 is
46.03%, in 2018 is 45.69%, in year 1019 is 36.09% it shows a downward slop but in year 2020
company improve its gross profit ratio and it increases to 38.98%.
⊘ This is a preview!⊘
Do you want full access?
Subscribe today to unlock all pages.
Trusted by 1+ million students worldwide
Current Ratio:
Period Year 2017 Year 2018 Year 2019 Year 2020
Current Assets $ 146982464 $ 174697424 $ 181385260 $ 198215579
Current Liabilities $ 67175114 $ 69081510 $ 63782764 $ 75604351
Current Ratio =
Current Assets /
Current Liabilities
= 146982464 /
67175114 = 2.19
Times
=
174697424 /
69081510 =
2.53 Times
=
181385260 /
63782764 =
2.84 Times
= 198215579
/ 75604351 =
2.62 Times
Interpretation: Current ratio shows the liquidity position of the company and as per above
computation liquidity position of the company is continuously growing but in year 2020 current
ratio is slightly decline to 2.62 times. Above graph shows company is performing well from year
2017 to 2019. Due to increase in current liabilities company’s current ratio is decreased in year
2020.
Debt-to-equity ratio:
Period Year 2017 Year 2018 Year 2019 Year 2020
Debt $ 2767807 $ 1047057 $ 3172479 $ 2947853
Equity $ 207213416 $ 240068993 $ 254915472 $ 267670331
Debt-to-Equity = Debt /
Equity
= 2767807 /
207213416 =
= 1047057 /
240068993 =
= 3172479 /
254915472 =
= 2947853 /
267670331 =
Period Year 2017 Year 2018 Year 2019 Year 2020
Current Assets $ 146982464 $ 174697424 $ 181385260 $ 198215579
Current Liabilities $ 67175114 $ 69081510 $ 63782764 $ 75604351
Current Ratio =
Current Assets /
Current Liabilities
= 146982464 /
67175114 = 2.19
Times
=
174697424 /
69081510 =
2.53 Times
=
181385260 /
63782764 =
2.84 Times
= 198215579
/ 75604351 =
2.62 Times
Interpretation: Current ratio shows the liquidity position of the company and as per above
computation liquidity position of the company is continuously growing but in year 2020 current
ratio is slightly decline to 2.62 times. Above graph shows company is performing well from year
2017 to 2019. Due to increase in current liabilities company’s current ratio is decreased in year
2020.
Debt-to-equity ratio:
Period Year 2017 Year 2018 Year 2019 Year 2020
Debt $ 2767807 $ 1047057 $ 3172479 $ 2947853
Equity $ 207213416 $ 240068993 $ 254915472 $ 267670331
Debt-to-Equity = Debt /
Equity
= 2767807 /
207213416 =
= 1047057 /
240068993 =
= 3172479 /
254915472 =
= 2947853 /
267670331 =
Paraphrase This Document
Need a fresh take? Get an instant paraphrase of this document with our AI Paraphraser
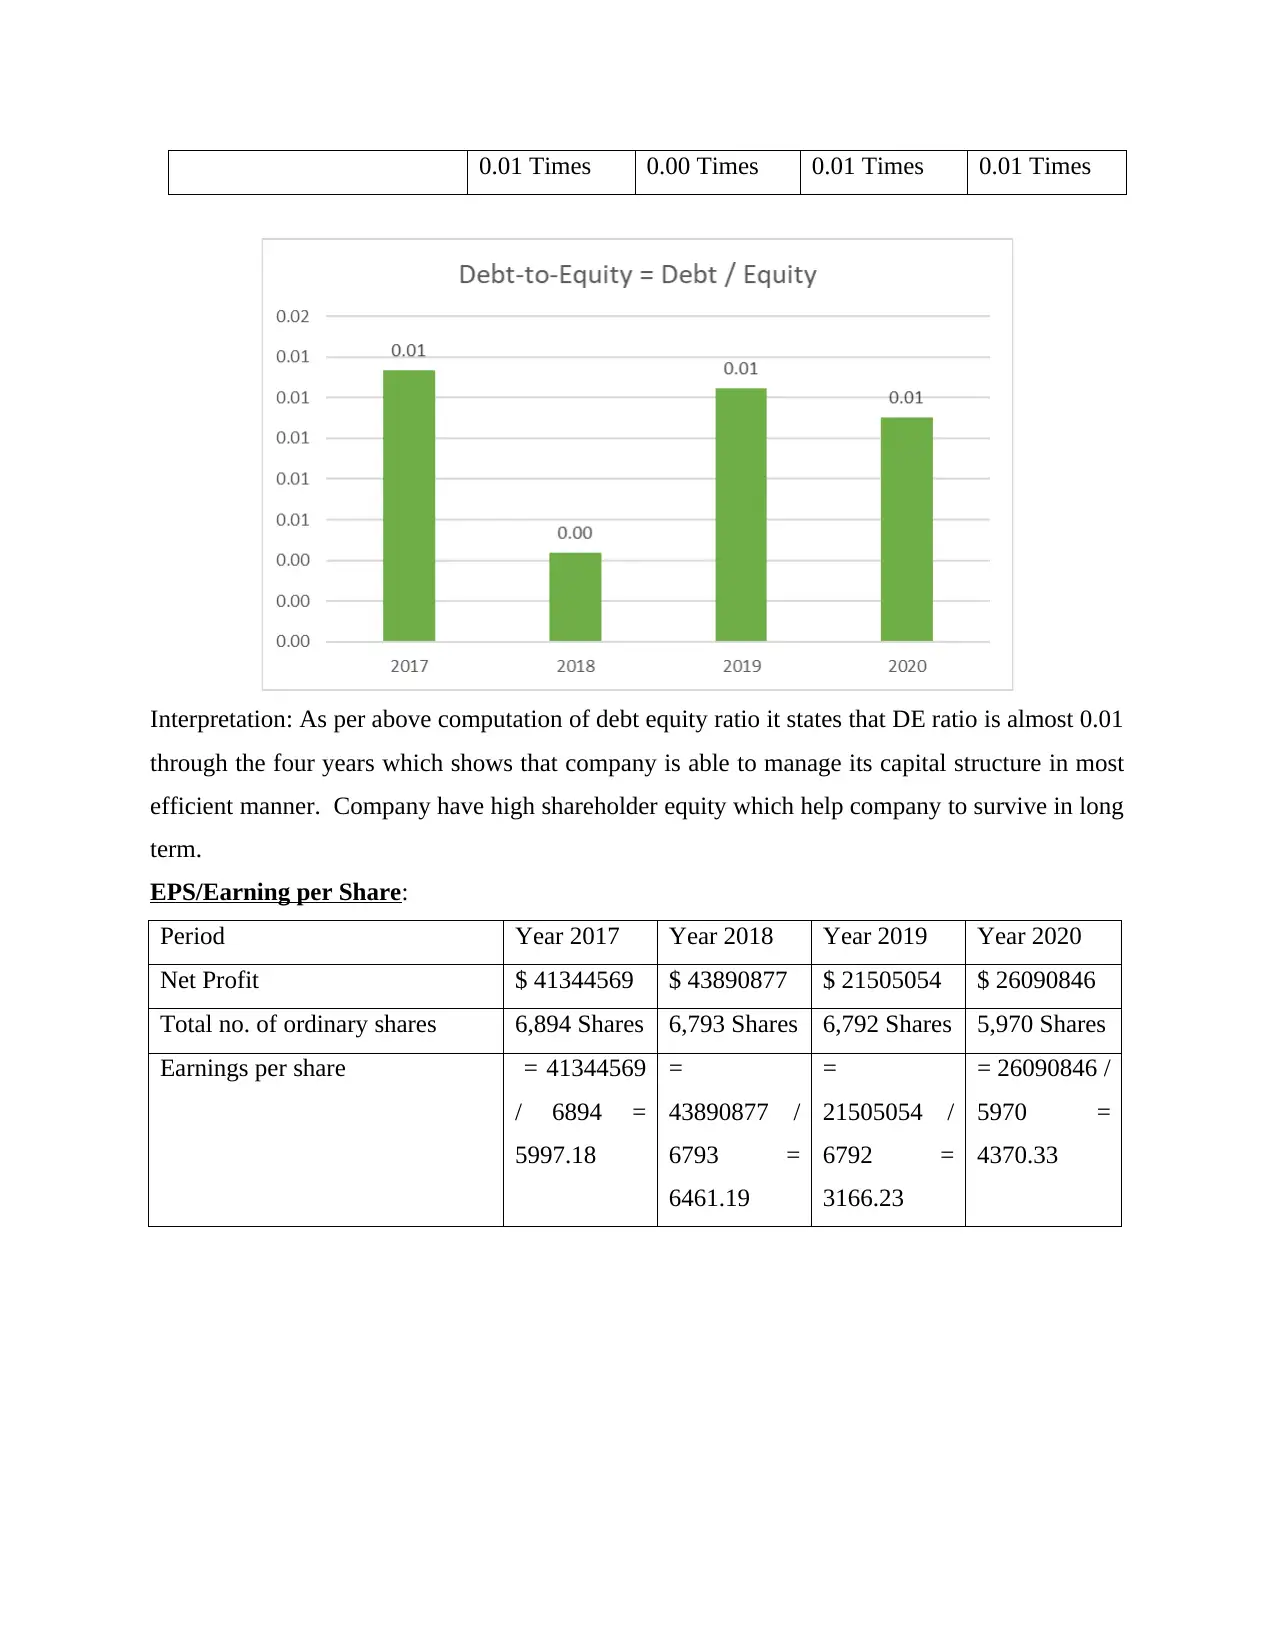
0.01 Times 0.00 Times 0.01 Times 0.01 Times
Interpretation: As per above computation of debt equity ratio it states that DE ratio is almost 0.01
through the four years which shows that company is able to manage its capital structure in most
efficient manner. Company have high shareholder equity which help company to survive in long
term.
EPS/Earning per Share:
Period Year 2017 Year 2018 Year 2019 Year 2020
Net Profit $ 41344569 $ 43890877 $ 21505054 $ 26090846
Total no. of ordinary shares 6,894 Shares 6,793 Shares 6,792 Shares 5,970 Shares
Earnings per share = 41344569
/ 6894 =
5997.18
=
43890877 /
6793 =
6461.19
=
21505054 /
6792 =
3166.23
= 26090846 /
5970 =
4370.33
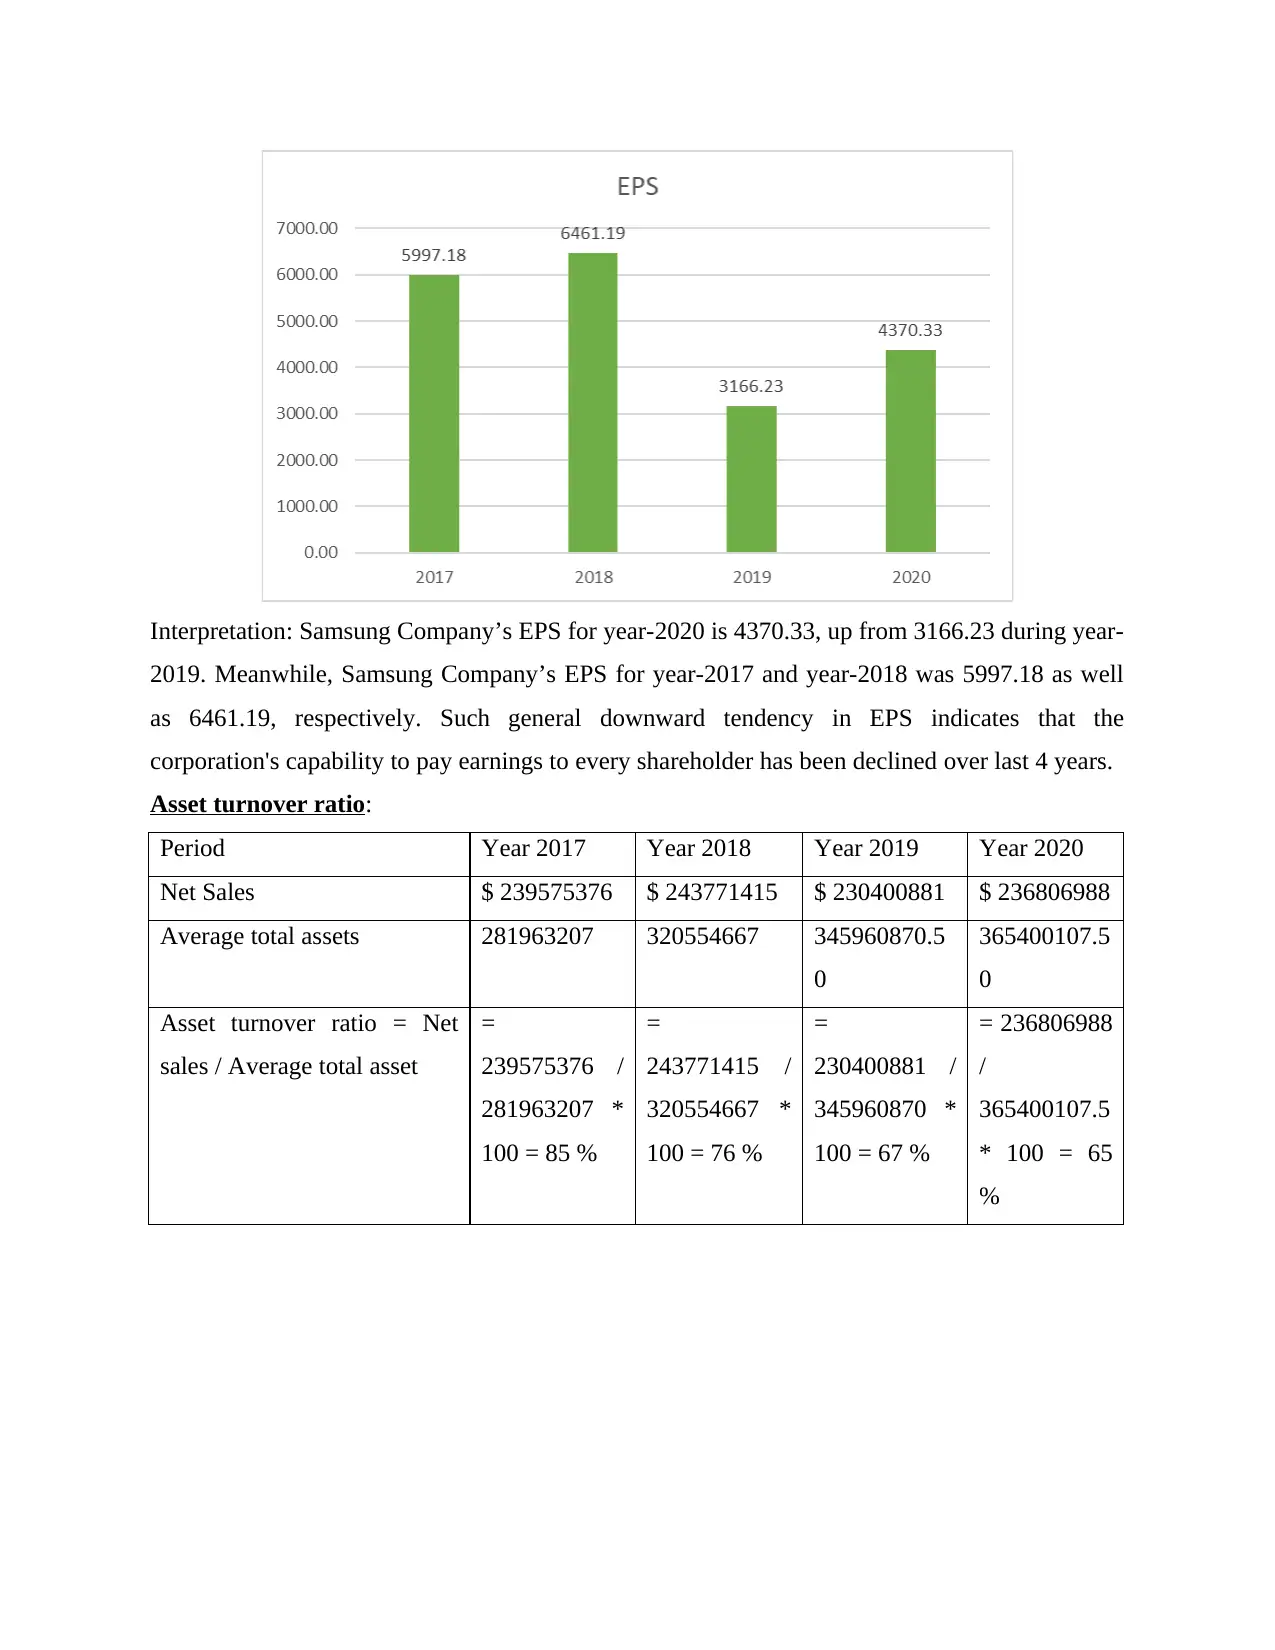
Interpretation: Samsung Company’s EPS for year-2020 is 4370.33, up from 3166.23 during year-
2019. Meanwhile, Samsung Company’s EPS for year-2017 and year-2018 was 5997.18 as well
as 6461.19, respectively. Such general downward tendency in EPS indicates that the
corporation's capability to pay earnings to every shareholder has been declined over last 4 years.
Asset turnover ratio:
Period Year 2017 Year 2018 Year 2019 Year 2020
Net Sales $ 239575376 $ 243771415 $ 230400881 $ 236806988
Average total assets 281963207 320554667 345960870.5
0
365400107.5
0
Asset turnover ratio = Net
sales / Average total asset
=
239575376 /
281963207 *
100 = 85 %
=
243771415 /
320554667 *
100 = 76 %
=
230400881 /
345960870 *
100 = 67 %
= 236806988
/
365400107.5
* 100 = 65
%
⊘ This is a preview!⊘
Do you want full access?
Subscribe today to unlock all pages.
Trusted by 1+ million students worldwide
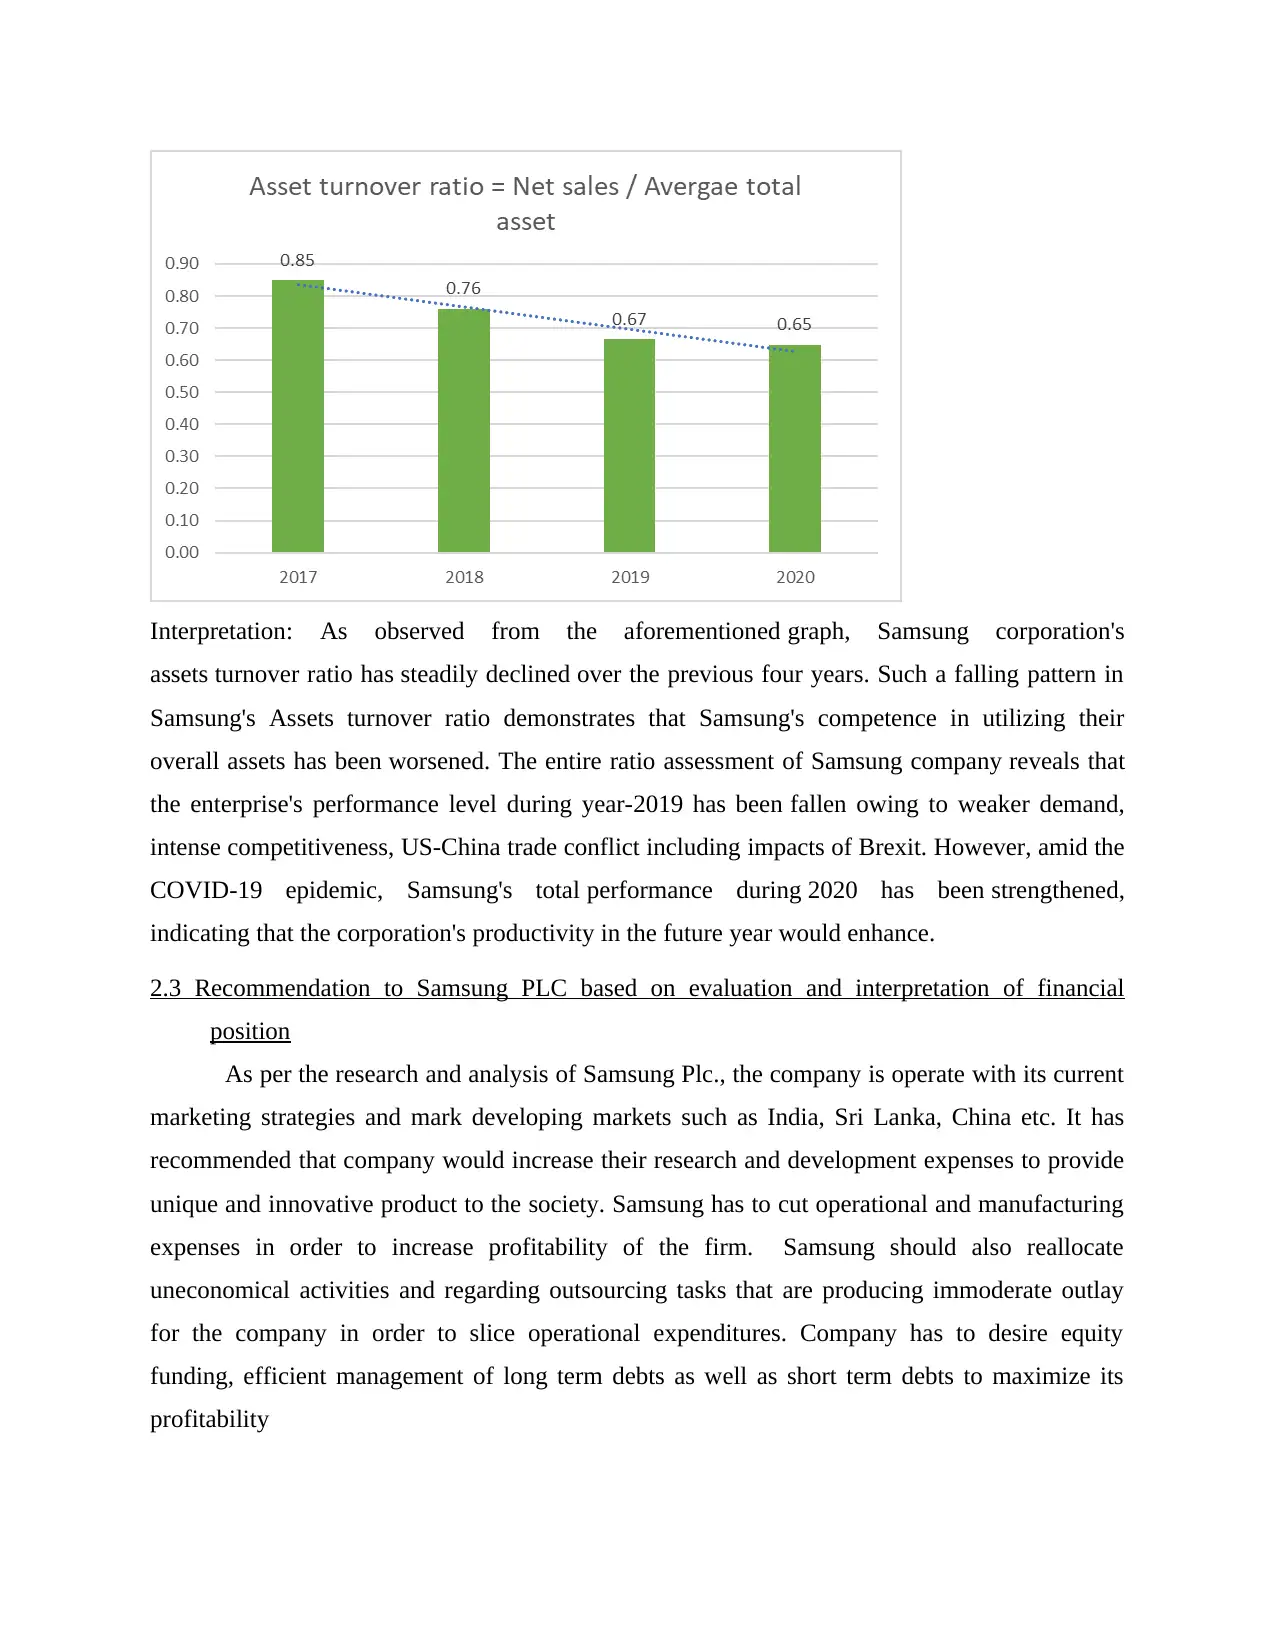
Interpretation: As observed from the aforementioned graph, Samsung corporation's
assets turnover ratio has steadily declined over the previous four years. Such a falling pattern in
Samsung's Assets turnover ratio demonstrates that Samsung's competence in utilizing their
overall assets has been worsened. The entire ratio assessment of Samsung company reveals that
the enterprise's performance level during year-2019 has been fallen owing to weaker demand,
intense competitiveness, US-China trade conflict including impacts of Brexit. However, amid the
COVID-19 epidemic, Samsung's total performance during 2020 has been strengthened,
indicating that the corporation's productivity in the future year would enhance.
2.3 Recommendation to Samsung PLC based on evaluation and interpretation of financial
position
As per the research and analysis of Samsung Plc., the company is operate with its current
marketing strategies and mark developing markets such as India, Sri Lanka, China etc. It has
recommended that company would increase their research and development expenses to provide
unique and innovative product to the society. Samsung has to cut operational and manufacturing
expenses in order to increase profitability of the firm. Samsung should also reallocate
uneconomical activities and regarding outsourcing tasks that are producing immoderate outlay
for the company in order to slice operational expenditures. Company has to desire equity
funding, efficient management of long term debts as well as short term debts to maximize its
profitability
Paraphrase This Document
Need a fresh take? Get an instant paraphrase of this document with our AI Paraphraser
TASK 3 Information Leaflet
3.1 Effect of innovative accounting methods on strategic choices
The creation of financial statements has a significant affect on the strategic decisions taken
by the company, and all these decisions are adjusted in accordance with effect on the financial
data, therefore creative accounting approaches are directly related to this process. The structure
of the organization may occasionally be exposed to hazard as a result of these approaches, which
also have the potential to confuse connected audiences, entity stakeholders, as well as the
investors, the company concern is looking to attract (Iranah and et.al., 2018).
There are also many policies that lack adequate oversight, penalties, and rewards on a
regular basis, but developing accounting systems enables management to spot these weaknesses
in the accounting system as well as sloped reporting, which helps to improve ineffective
decision-making and develop the goals and objectives of the organisation.
Creative accounting aims to protect the interests of businesses by promoting,
strengthening, and enhancing the reputation and goodwill of the organisation.
3.2 Ratio analysis's shortcomings as a tool for strategic decision-making
When financial information is provided for the given set of data, ratio analysis is done. If
financial statements are manipulated, ratio analysis findings will also be manipulated and will
not produce accurate results.
The non-monetary factors in organisations, such as high labour turnover rates, irregular
wage and salary increases, management disputes with labour unions, etc., which also have an
impact on the effectiveness and efficiency of the entity during the accounting period, are not
taken into account by ratio analysis, which only shows what is necessary and it only relates to
monetary performance (Jiang, Jiang and Kim., 2020).
They ignore adjustments made to the entity's prices for its goods and services as a result of
variations in the inflation rate. Additionally, they do not address the company's financial issues
from the accreting period, therefore it can conclude that ratios does not actually address the
issues the company is having.
3.3 The significance of cash flow management when assessing capital spending proposals
When a business has to invest in facilities or equipment, a capital expenditure is made since
these are one-time costs that have an impact on the entity's liquidity because they need a larger
financial expenditure. For this reason, only the management of cash flow is essential to the
business because it helps the enterprise's capital expenditure planning directly. If an entity's
liquidity is less than it should be, it will not be able to contribute to substantial investments, as
shown by the cash flow management (Khanifar and et.al., 2020).
The main objective of cash flow management is to understand and reduce operational costs
so that capital investment projects may be assessed from both within the company and from
outside with other businesses. If cash flow is not correctly managed, the company will fail to
complete any capital expansion projects it plans to undertake. Additionally, excessive spending
will occur, which will have an impact on the entity's profitability. Since cash flow management
is connected to all facets of financial forecasting, including capital expenditures as well, it plays
a crucial part in the investment appraisal process the company wishes to carry out.
3.4 Methods and tools are recommended to help businesses analyse financial data for the aim of
making strategic decisions
Analysts can utilise a variety of methodologies to help them comprehend how an entity's
finances have performed throughout the course of the accounting period. The techniques are
listed below:
Horizontal Analysis: This strategy aids in the execution of long-term company strategy
development and allows companies to compare their financial data, such as earnings or
cost of goods sold, to 2 distinct quarters.
Ratio Analysis: Ratio analysis is the process of comparing the financial statements of two
distinct fiscal years and analysing both positive and negative differences in order to
quickly discuss problems with deviations (Kiani Mavi and Standing., 2018).
Trend Analysis: Trends can be supported by showing gradual fluctuation patterns, and for
such changes, the base year with the earliest year—must be used as a reference. The
management of the firm will respond in accordance with the outcomes of such changes in
the financial statement, which may trend more negatively or positively.
Progress Analysis: The performance of several departments, such as administrative and
operational ones, must be recorded in the financial statements in order for their operating
⊘ This is a preview!⊘
Do you want full access?
Subscribe today to unlock all pages.
Trusted by 1+ million students worldwide
1 out of 20
Related Documents


Your All-in-One AI-Powered Toolkit for Academic Success.
+13062052269
info@desklib.com
Available 24*7 on WhatsApp / Email
![[object Object]](/_next/static/media/star-bottom.7253800d.svg)
Unlock your academic potential
Copyright © 2020–2026 A2Z Services. All Rights Reserved. Developed and managed by ZUCOL.