Financial Decision Making: Investment Appraisal of Roast Limited
VerifiedAdded on 2023/01/16
|14
|4384
|53
Report
AI Summary
This report provides a comprehensive financial analysis of Roast Limited, focusing on financial decision-making and investment appraisal. It begins with an industry review highlighting the growth of the coffee industry in the UK and key players like Costa and Caffe Nero. The report then assesses Roast Limited's business performance by examining the statement of profit and loss, financial position statement, and statement of cash flows for 2017 and 2018. Key metrics such as gross profit ratio, net profit ratio, operating profit ratio, current ratio, quick ratio, and return on capital employed (ROCE) are calculated and analyzed to evaluate the company's financial health. The analysis reveals a strong profitability in 2018, driven by increased net income, although the gross profit margin declined. The financial position statement indicates an increase in assets and liabilities, with a notable rise in long-term lending. While the current and quick ratios were lower in 2018, the ROCE improved. Finally, the cash flow analysis suggests a negative cash flow from operating activities but a positive cash flow from financing activities, resulting in an overall negative cash position. The report concludes with a discussion of the operating cash cycle and its implications for financial management.
FINANCIAL
DECISION MAKING
DECISION MAKING
Paraphrase This Document
Need a fresh take? Get an instant paraphrase of this document with our AI Paraphraser
Table of Contents
EXECUTIVE SUMMARY.............................................................................................................3
MAIN BODY...................................................................................................................................3
Part1: Industry review:...........................................................................................................3
Part 2: Business performance analysis:..................................................................................3
2.1 Assessment of statement of P&L.................................................................................3
2.2 Examination of financial position statement...............................................................5
2.3 Analysis of Statement of cash flows:...........................................................................8
Part 3: Investment appraisals:...............................................................................................11
3.1. a Managerial forecast................................................................................................11
3.1 b Investment appraisal technique...............................................................................11
3.2 Source of finance.......................................................................................................12
REFERENCES..............................................................................................................................14
EXECUTIVE SUMMARY
The document of the feasibility study explains the phase of financial decision making for
the concept. According to the output of the financial firm, the very first section of the
subject report analyzes various types of financial results. In addition to both the expenditure
calculation, different kind of techniques including accounting return rate, net present value and
payback period are used in the second section of the subject report. So it can be proposed to
Starbucks group original conversation which they buy the limited company Roasted. Because the
bulk of their comments had favourable outcomes.
MAIN BODY
Part1: Industry review:
In the present time, it has been determined that coffee industry is increasing year by year
in UK (Nilsson, Nordvall and Isberg, 2016). The main reason for growth in industry is because
of customer getting more attached towards drinks and beverages. There are some specific
analyses of coffee industry in UK that are discussed below:
In year 2018, the overall market share of coffee shops increased by a good percentage i.e.
7.9% which is marked the highest increase for all time.
In UK there are number of coffee shops or even bigger companies which provide
favourable services and product as per the customer requirement. Some of the biggest
companies are Costa limited, Caffe Nero Group etc.
Countries like China and India are considered to be the most suitable nation for these
companies for expansion as people of these nations are not too much attached with
beverages and drinks.
In recent time, it has been also determined that there various issues which are faced by this
industry such as customer are more interested in drinking healthy drinks, alternative available at
lower cost etc.
Part 2: Business performance analysis:
2.1 Assessment of statement of P&L
The report on profit and loss report is a kind of report that includes information on total
profits and losses over a given duration of time. Based on Roast limited business's specified
⊘ This is a preview!⊘
Do you want full access?
Subscribe today to unlock all pages.
Trusted by 1+ million students worldwide
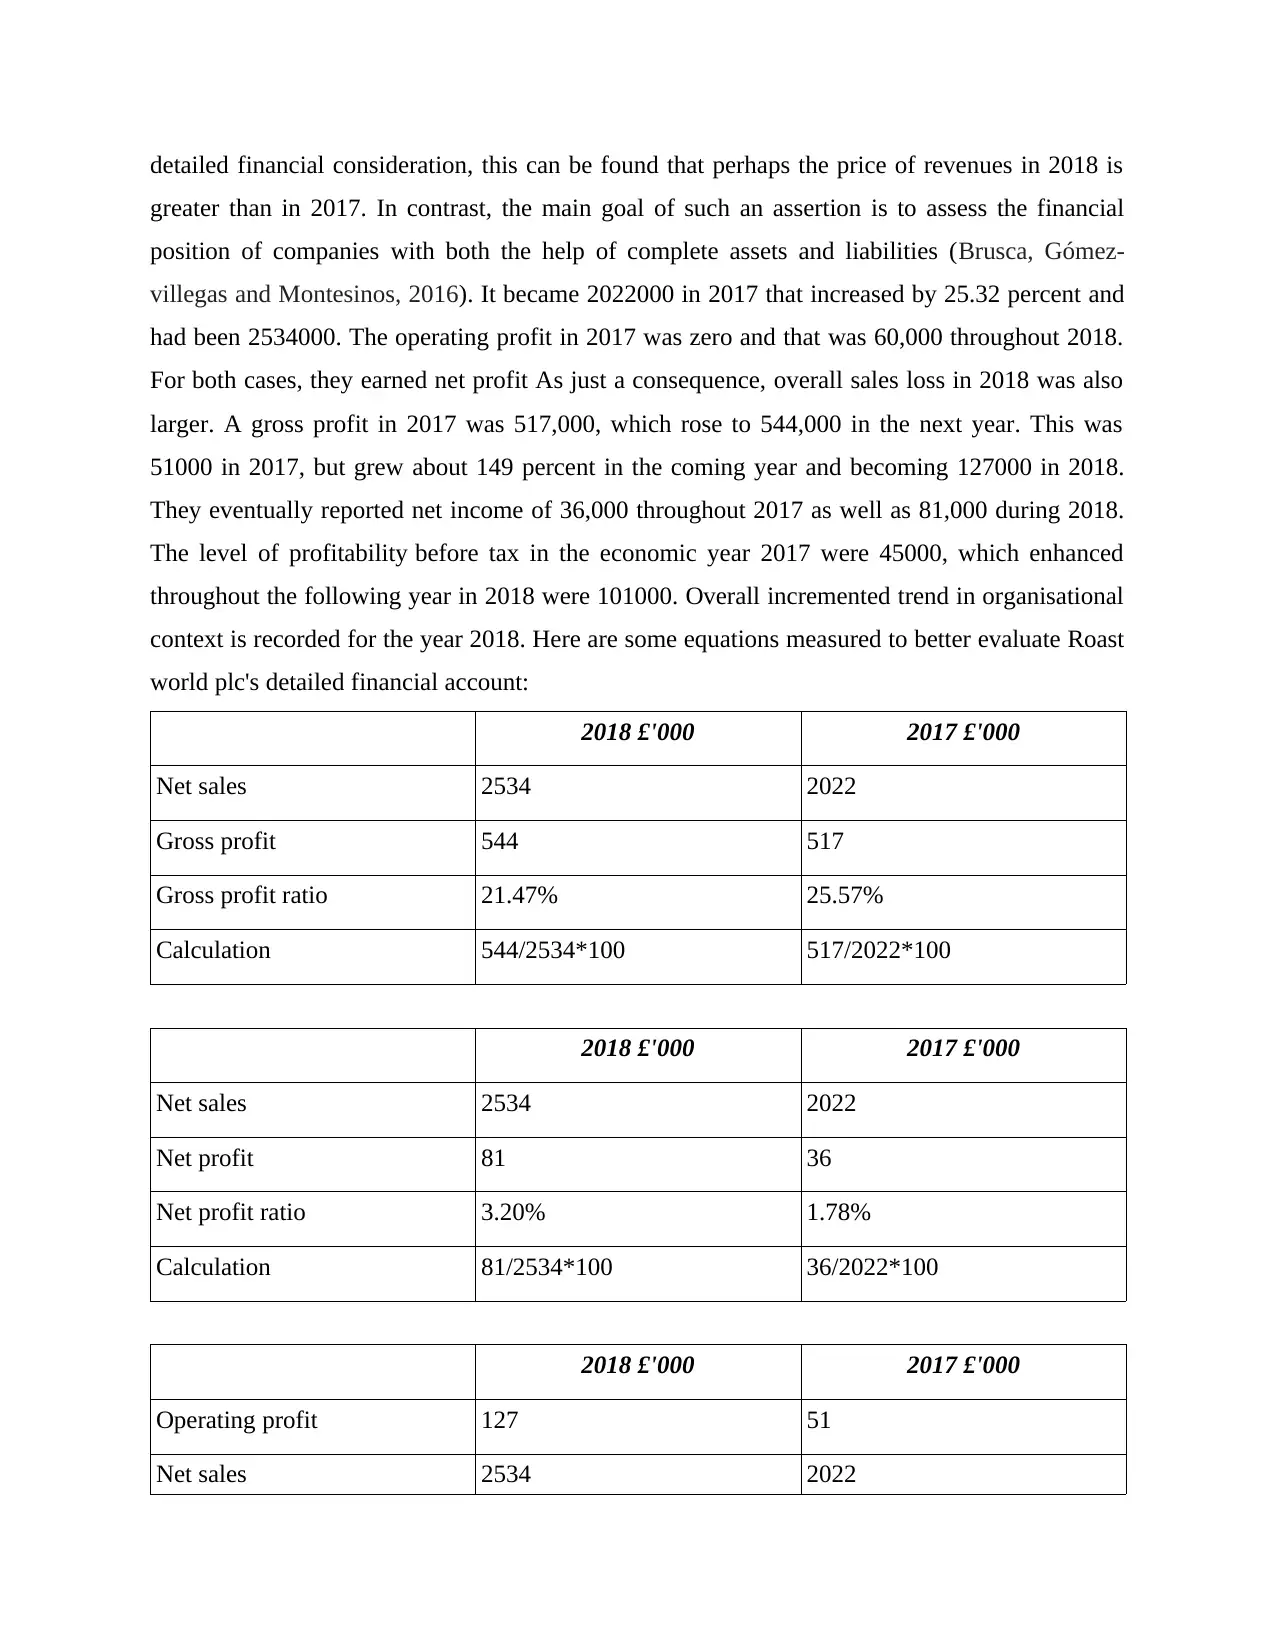
detailed financial consideration, this can be found that perhaps the price of revenues in 2018 is
greater than in 2017. In contrast, the main goal of such an assertion is to assess the financial
position of companies with both the help of complete assets and liabilities (Brusca, Gómez‐
villegas and Montesinos, 2016). It became 2022000 in 2017 that increased by 25.32 percent and
had been 2534000. The operating profit in 2017 was zero and that was 60,000 throughout 2018.
For both cases, they earned net profit As just a consequence, overall sales loss in 2018 was also
larger. A gross profit in 2017 was 517,000, which rose to 544,000 in the next year. This was
51000 in 2017, but grew about 149 percent in the coming year and becoming 127000 in 2018.
They eventually reported net income of 36,000 throughout 2017 as well as 81,000 during 2018.
The level of profitability before tax in the economic year 2017 were 45000, which enhanced
throughout the following year in 2018 were 101000. Overall incremented trend in organisational
context is recorded for the year 2018. Here are some equations measured to better evaluate Roast
world plc's detailed financial account:
2018 £'000 2017 £'000
Net sales 2534 2022
Gross profit 544 517
Gross profit ratio 21.47% 25.57%
Calculation 544/2534*100 517/2022*100
2018 £'000 2017 £'000
Net sales 2534 2022
Net profit 81 36
Net profit ratio 3.20% 1.78%
Calculation 81/2534*100 36/2022*100
2018 £'000 2017 £'000
Operating profit 127 51
Net sales 2534 2022
Paraphrase This Document
Need a fresh take? Get an instant paraphrase of this document with our AI Paraphraser
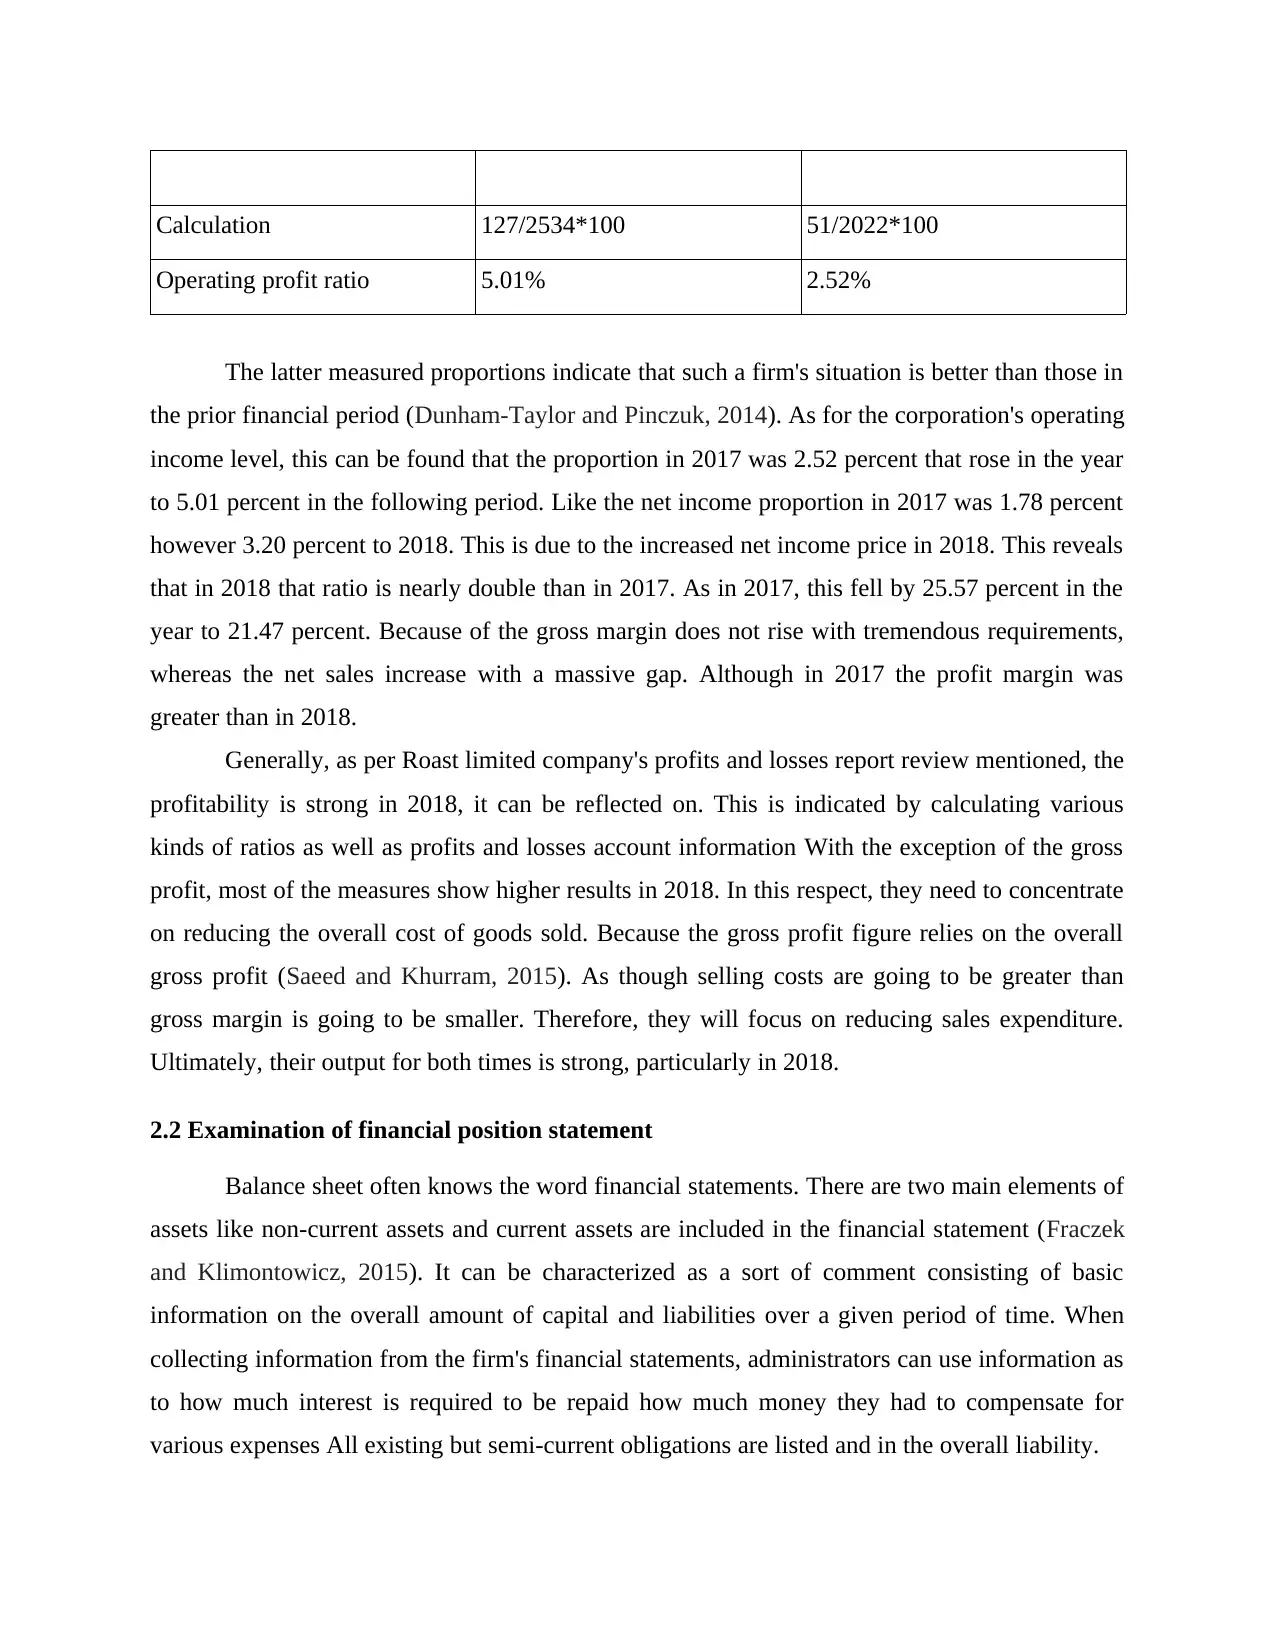
Calculation 127/2534*100 51/2022*100
Operating profit ratio 5.01% 2.52%
The latter measured proportions indicate that such a firm's situation is better than those in
the prior financial period (Dunham-Taylor and Pinczuk, 2014). As for the corporation's operating
income level, this can be found that the proportion in 2017 was 2.52 percent that rose in the year
to 5.01 percent in the following period. Like the net income proportion in 2017 was 1.78 percent
however 3.20 percent to 2018. This is due to the increased net income price in 2018. This reveals
that in 2018 that ratio is nearly double than in 2017. As in 2017, this fell by 25.57 percent in the
year to 21.47 percent. Because of the gross margin does not rise with tremendous requirements,
whereas the net sales increase with a massive gap. Although in 2017 the profit margin was
greater than in 2018.
Generally, as per Roast limited company's profits and losses report review mentioned, the
profitability is strong in 2018, it can be reflected on. This is indicated by calculating various
kinds of ratios as well as profits and losses account information With the exception of the gross
profit, most of the measures show higher results in 2018. In this respect, they need to concentrate
on reducing the overall cost of goods sold. Because the gross profit figure relies on the overall
gross profit (Saeed and Khurram, 2015). As though selling costs are going to be greater than
gross margin is going to be smaller. Therefore, they will focus on reducing sales expenditure.
Ultimately, their output for both times is strong, particularly in 2018.
2.2 Examination of financial position statement
Balance sheet often knows the word financial statements. There are two main elements of
assets like non-current assets and current assets are included in the financial statement (Fraczek
and Klimontowicz, 2015). It can be characterized as a sort of comment consisting of basic
information on the overall amount of capital and liabilities over a given period of time. When
collecting information from the firm's financial statements, administrators can use information as
to how much interest is required to be repaid how much money they had to compensate for
various expenses All existing but semi-current obligations are listed and in the overall liability.
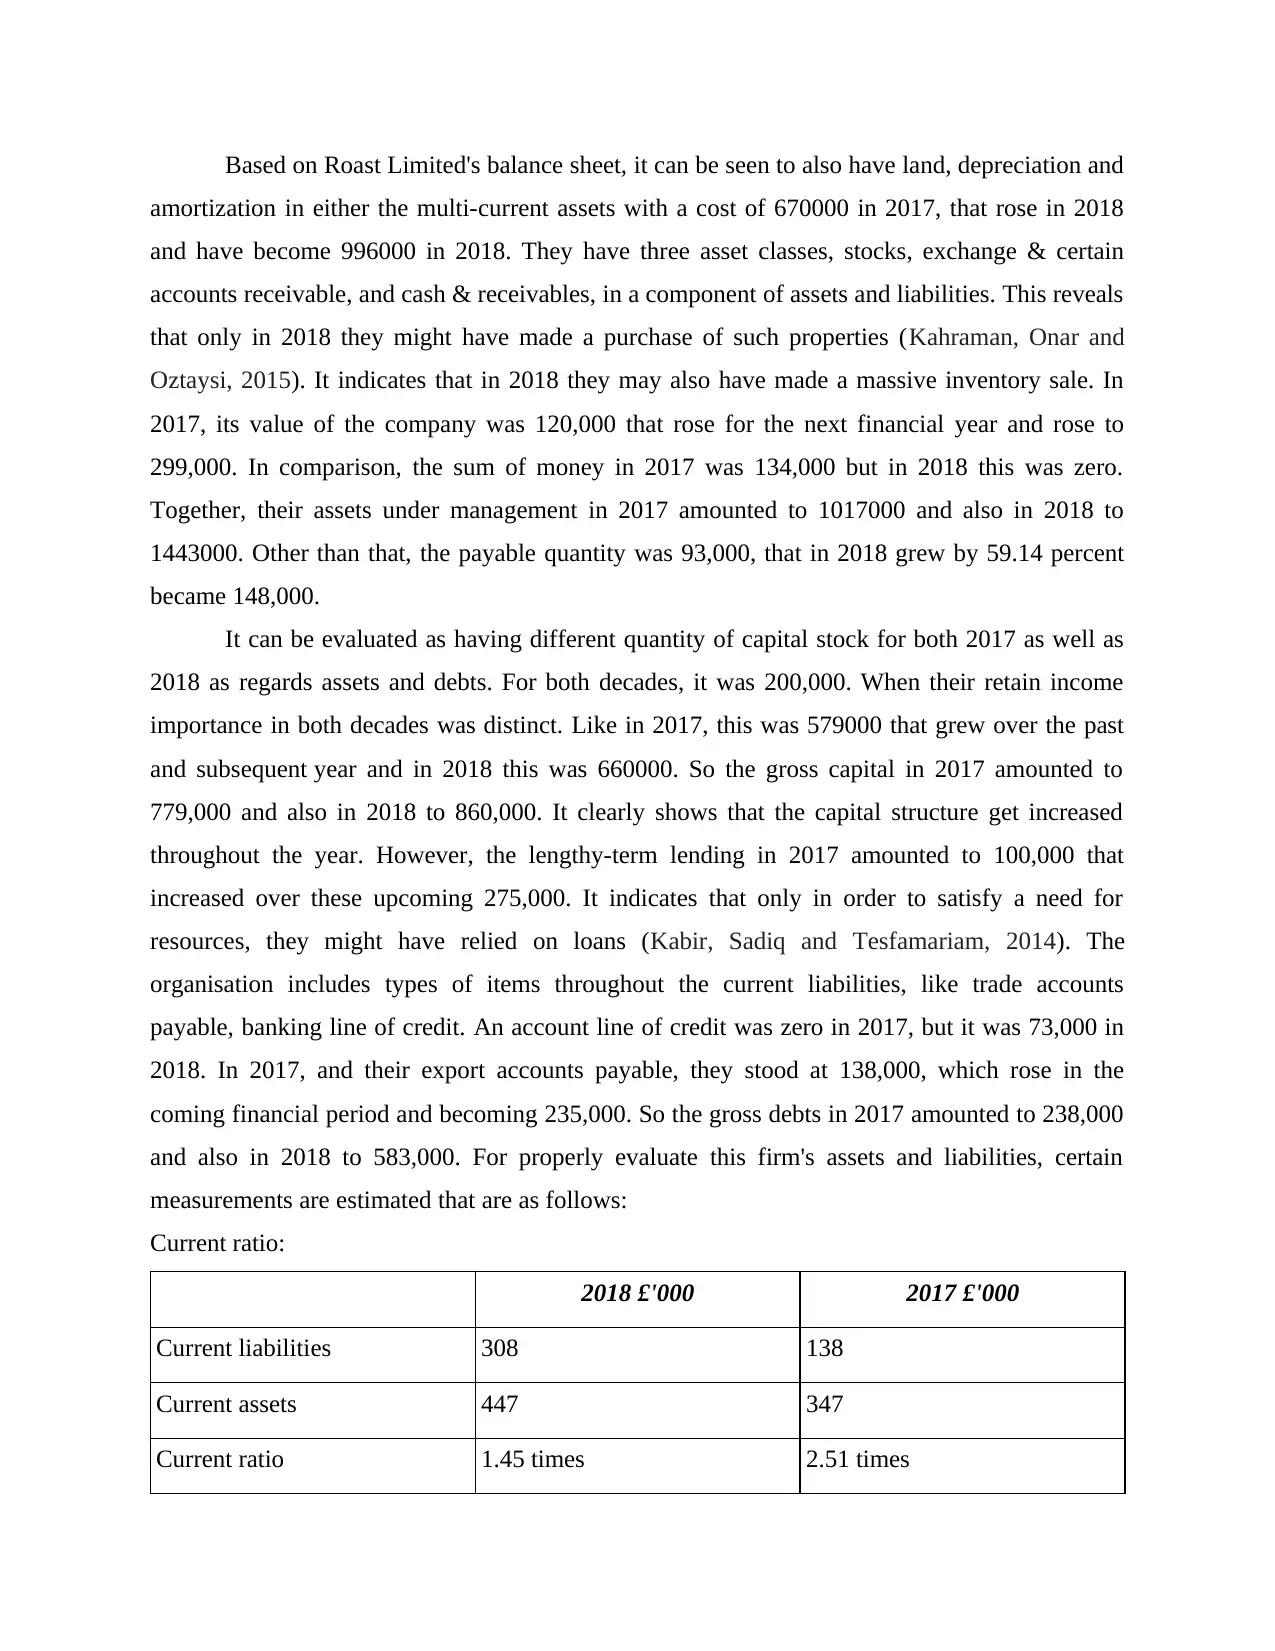
Based on Roast Limited's balance sheet, it can be seen to also have land, depreciation and
amortization in either the multi-current assets with a cost of 670000 in 2017, that rose in 2018
and have become 996000 in 2018. They have three asset classes, stocks, exchange & certain
accounts receivable, and cash & receivables, in a component of assets and liabilities. This reveals
that only in 2018 they might have made a purchase of such properties (Kahraman, Onar and
Oztaysi, 2015). It indicates that in 2018 they may also have made a massive inventory sale. In
2017, its value of the company was 120,000 that rose for the next financial year and rose to
299,000. In comparison, the sum of money in 2017 was 134,000 but in 2018 this was zero.
Together, their assets under management in 2017 amounted to 1017000 and also in 2018 to
1443000. Other than that, the payable quantity was 93,000, that in 2018 grew by 59.14 percent
became 148,000.
It can be evaluated as having different quantity of capital stock for both 2017 as well as
2018 as regards assets and debts. For both decades, it was 200,000. When their retain income
importance in both decades was distinct. Like in 2017, this was 579000 that grew over the past
and subsequent year and in 2018 this was 660000. So the gross capital in 2017 amounted to
779,000 and also in 2018 to 860,000. It clearly shows that the capital structure get increased
throughout the year. However, the lengthy-term lending in 2017 amounted to 100,000 that
increased over these upcoming 275,000. It indicates that only in order to satisfy a need for
resources, they might have relied on loans (Kabir, Sadiq and Tesfamariam, 2014). The
organisation includes types of items throughout the current liabilities, like trade accounts
payable, banking line of credit. An account line of credit was zero in 2017, but it was 73,000 in
2018. In 2017, and their export accounts payable, they stood at 138,000, which rose in the
coming financial period and becoming 235,000. So the gross debts in 2017 amounted to 238,000
and also in 2018 to 583,000. For properly evaluate this firm's assets and liabilities, certain
measurements are estimated that are as follows:
Current ratio:
2018 £'000 2017 £'000
Current liabilities 308 138
Current assets 447 347
Current ratio 1.45 times 2.51 times
⊘ This is a preview!⊘
Do you want full access?
Subscribe today to unlock all pages.
Trusted by 1+ million students worldwide
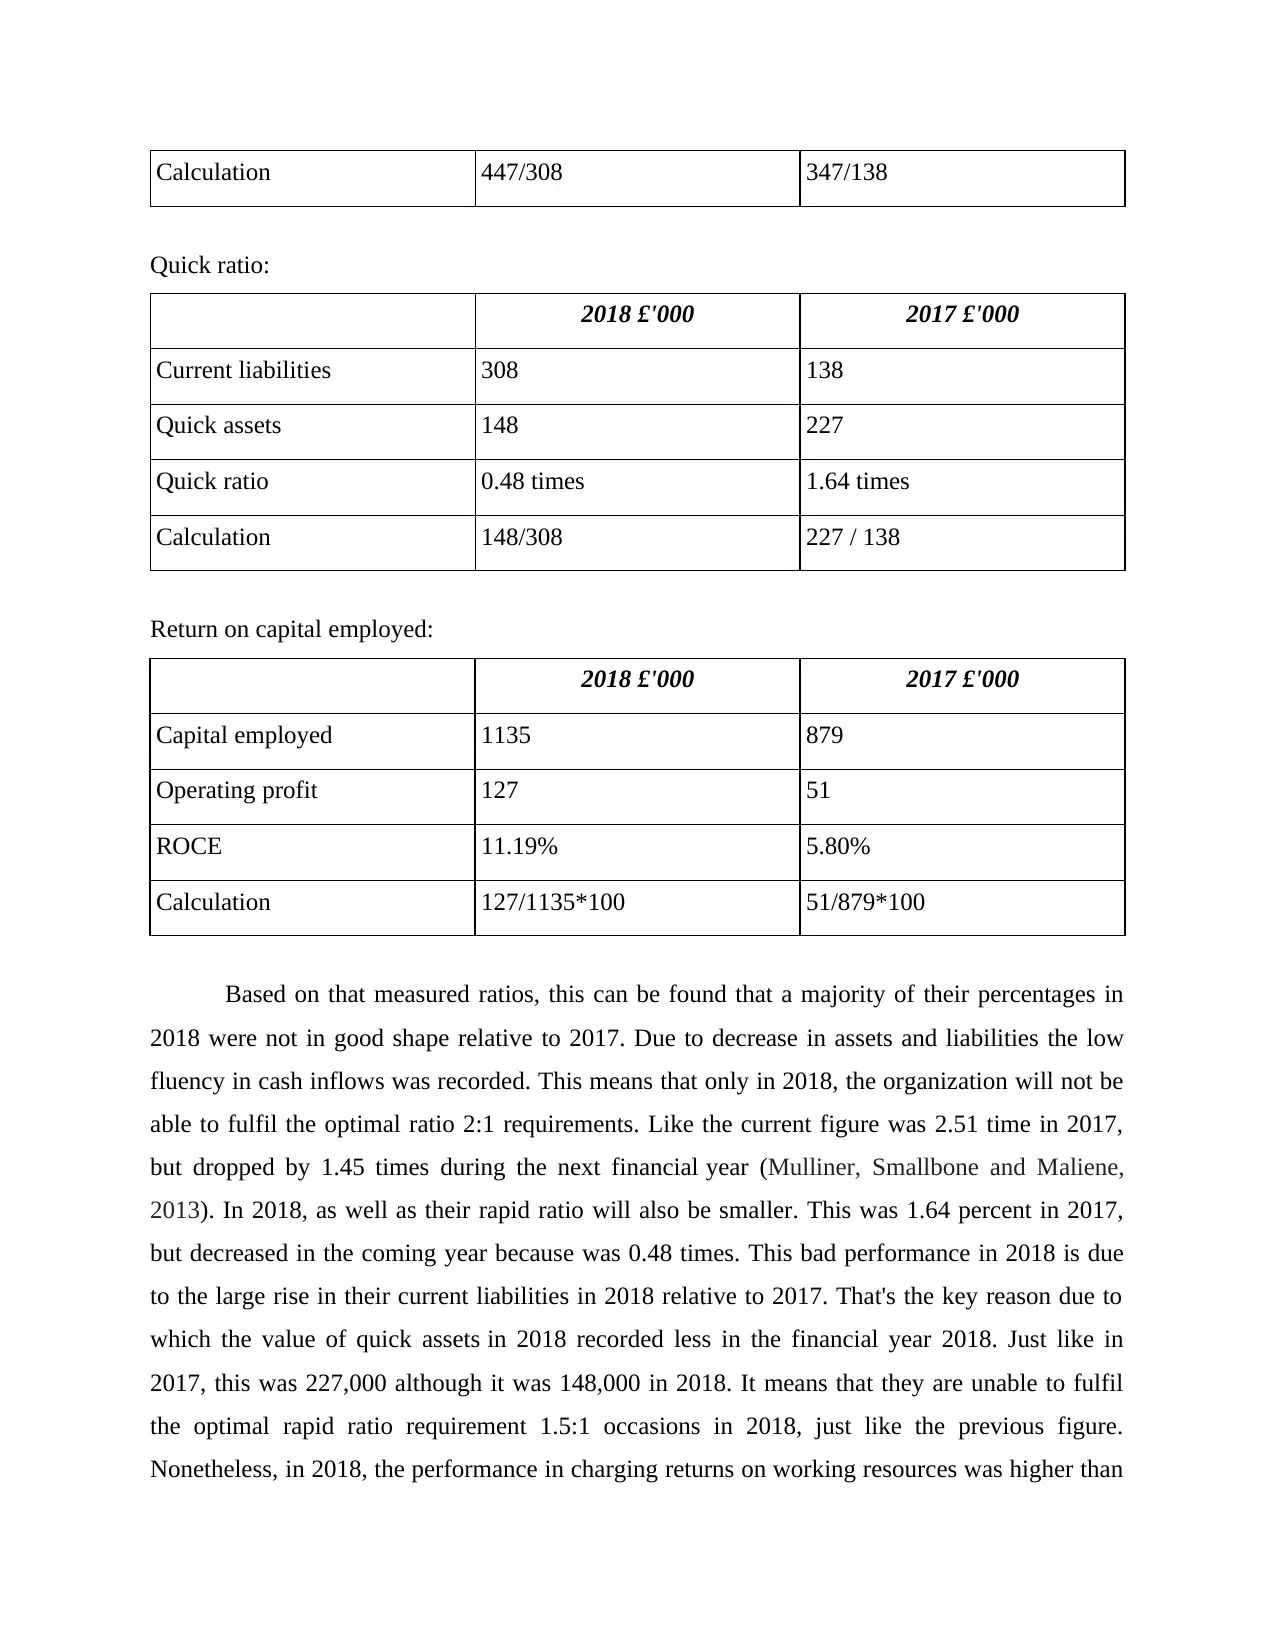
Calculation 447/308 347/138
Quick ratio:
2018 £'000 2017 £'000
Current liabilities 308 138
Quick assets 148 227
Quick ratio 0.48 times 1.64 times
Calculation 148/308 227 / 138
Return on capital employed:
2018 £'000 2017 £'000
Capital employed 1135 879
Operating profit 127 51
ROCE 11.19% 5.80%
Calculation 127/1135*100 51/879*100
Based on that measured ratios, this can be found that a majority of their percentages in
2018 were not in good shape relative to 2017. Due to decrease in assets and liabilities the low
fluency in cash inflows was recorded. This means that only in 2018, the organization will not be
able to fulfil the optimal ratio 2:1 requirements. Like the current figure was 2.51 time in 2017,
but dropped by 1.45 times during the next financial year (Mulliner, Smallbone and Maliene,
2013). In 2018, as well as their rapid ratio will also be smaller. This was 1.64 percent in 2017,
but decreased in the coming year because was 0.48 times. This bad performance in 2018 is due
to the large rise in their current liabilities in 2018 relative to 2017. That's the key reason due to
which the value of quick assets in 2018 recorded less in the financial year 2018. Just like in
2017, this was 227,000 although it was 148,000 in 2018. It means that they are unable to fulfil
the optimal rapid ratio requirement 1.5:1 occasions in 2018, just like the previous figure.
Nonetheless, in 2018, the performance in charging returns on working resources was higher than
Paraphrase This Document
Need a fresh take? Get an instant paraphrase of this document with our AI Paraphraser
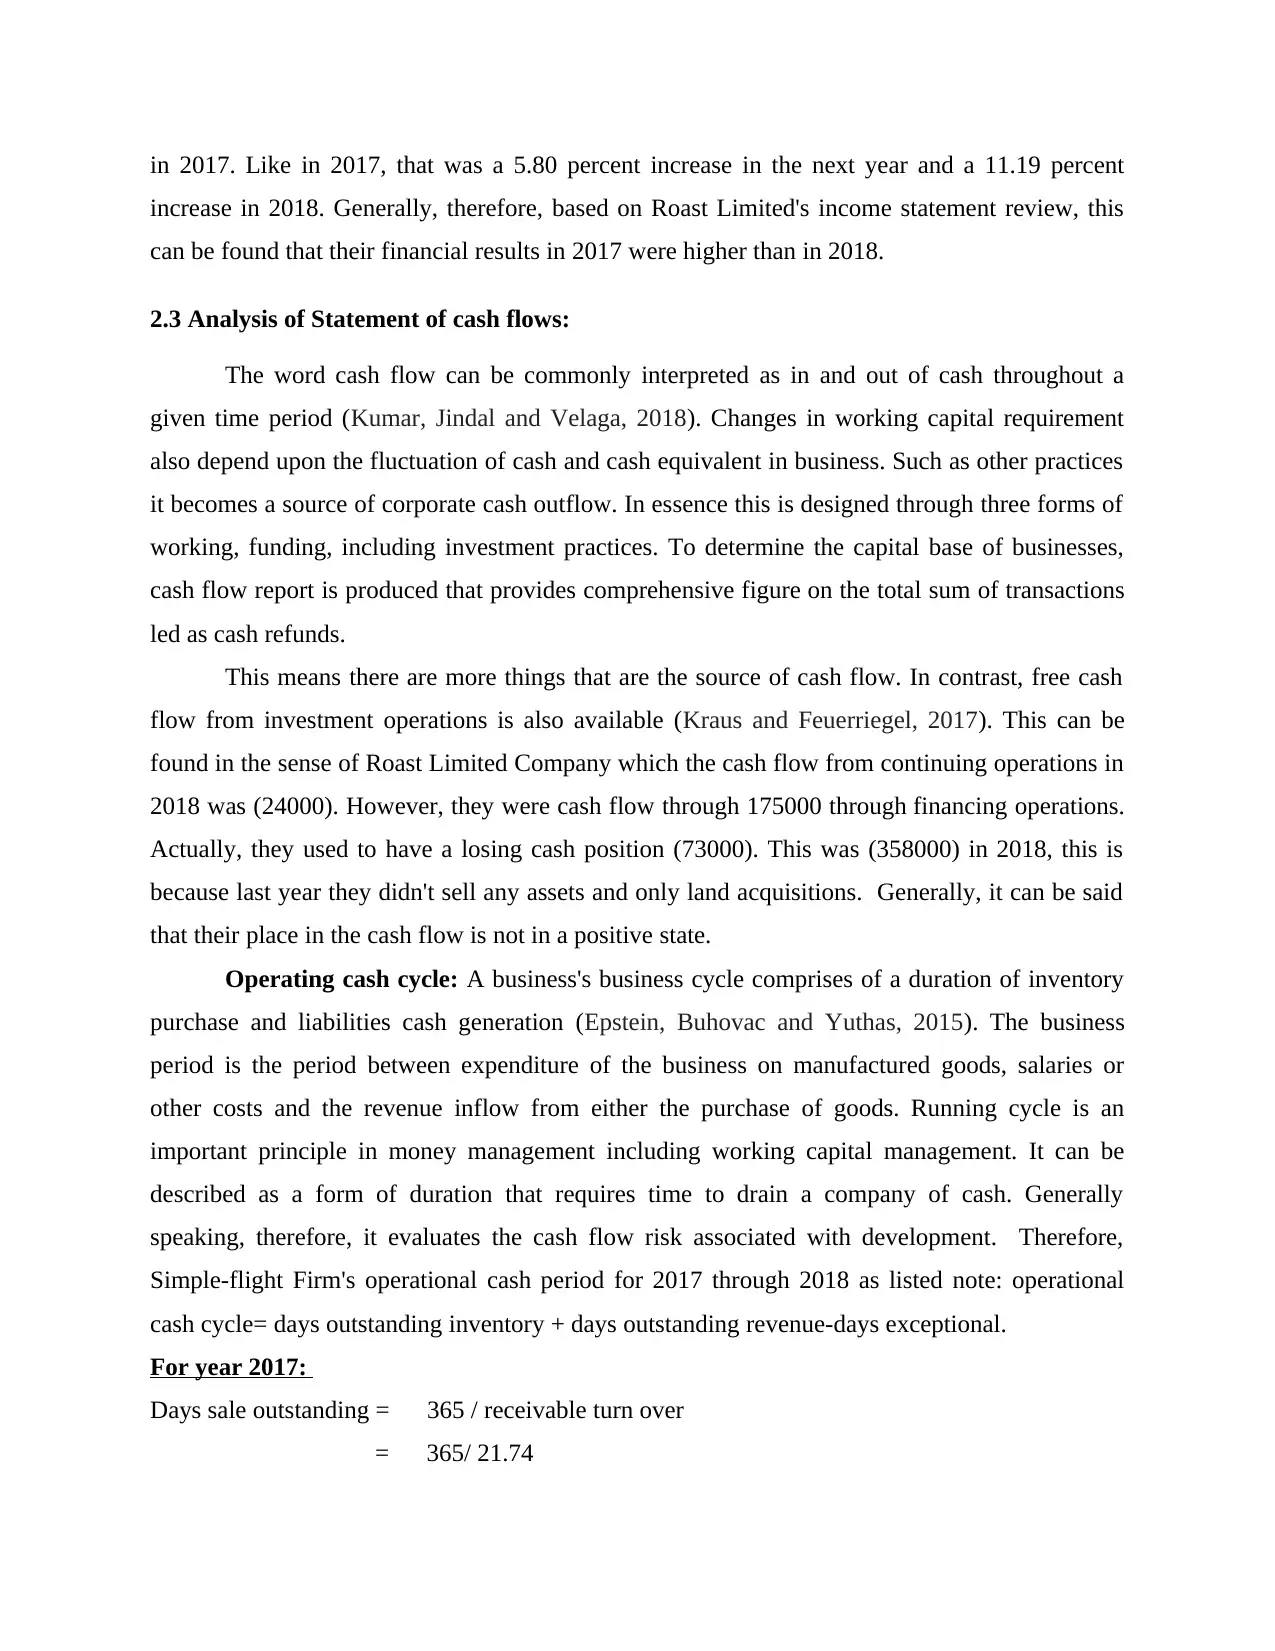
in 2017. Like in 2017, that was a 5.80 percent increase in the next year and a 11.19 percent
increase in 2018. Generally, therefore, based on Roast Limited's income statement review, this
can be found that their financial results in 2017 were higher than in 2018.
2.3 Analysis of Statement of cash flows:
The word cash flow can be commonly interpreted as in and out of cash throughout a
given time period (Kumar, Jindal and Velaga, 2018). Changes in working capital requirement
also depend upon the fluctuation of cash and cash equivalent in business. Such as other practices
it becomes a source of corporate cash outflow. In essence this is designed through three forms of
working, funding, including investment practices. To determine the capital base of businesses,
cash flow report is produced that provides comprehensive figure on the total sum of transactions
led as cash refunds.
This means there are more things that are the source of cash flow. In contrast, free cash
flow from investment operations is also available (Kraus and Feuerriegel, 2017). This can be
found in the sense of Roast Limited Company which the cash flow from continuing operations in
2018 was (24000). However, they were cash flow through 175000 through financing operations.
Actually, they used to have a losing cash position (73000). This was (358000) in 2018, this is
because last year they didn't sell any assets and only land acquisitions. Generally, it can be said
that their place in the cash flow is not in a positive state.
Operating cash cycle: A business's business cycle comprises of a duration of inventory
purchase and liabilities cash generation (Epstein, Buhovac and Yuthas, 2015). The business
period is the period between expenditure of the business on manufactured goods, salaries or
other costs and the revenue inflow from either the purchase of goods. Running cycle is an
important principle in money management including working capital management. It can be
described as a form of duration that requires time to drain a company of cash. Generally
speaking, therefore, it evaluates the cash flow risk associated with development. Therefore,
Simple-flight Firm's operational cash period for 2017 through 2018 as listed note: operational
cash cycle= days outstanding inventory + days outstanding revenue-days exceptional.
For year 2017:
Days sale outstanding = 365 / receivable turn over
= 365/ 21.74
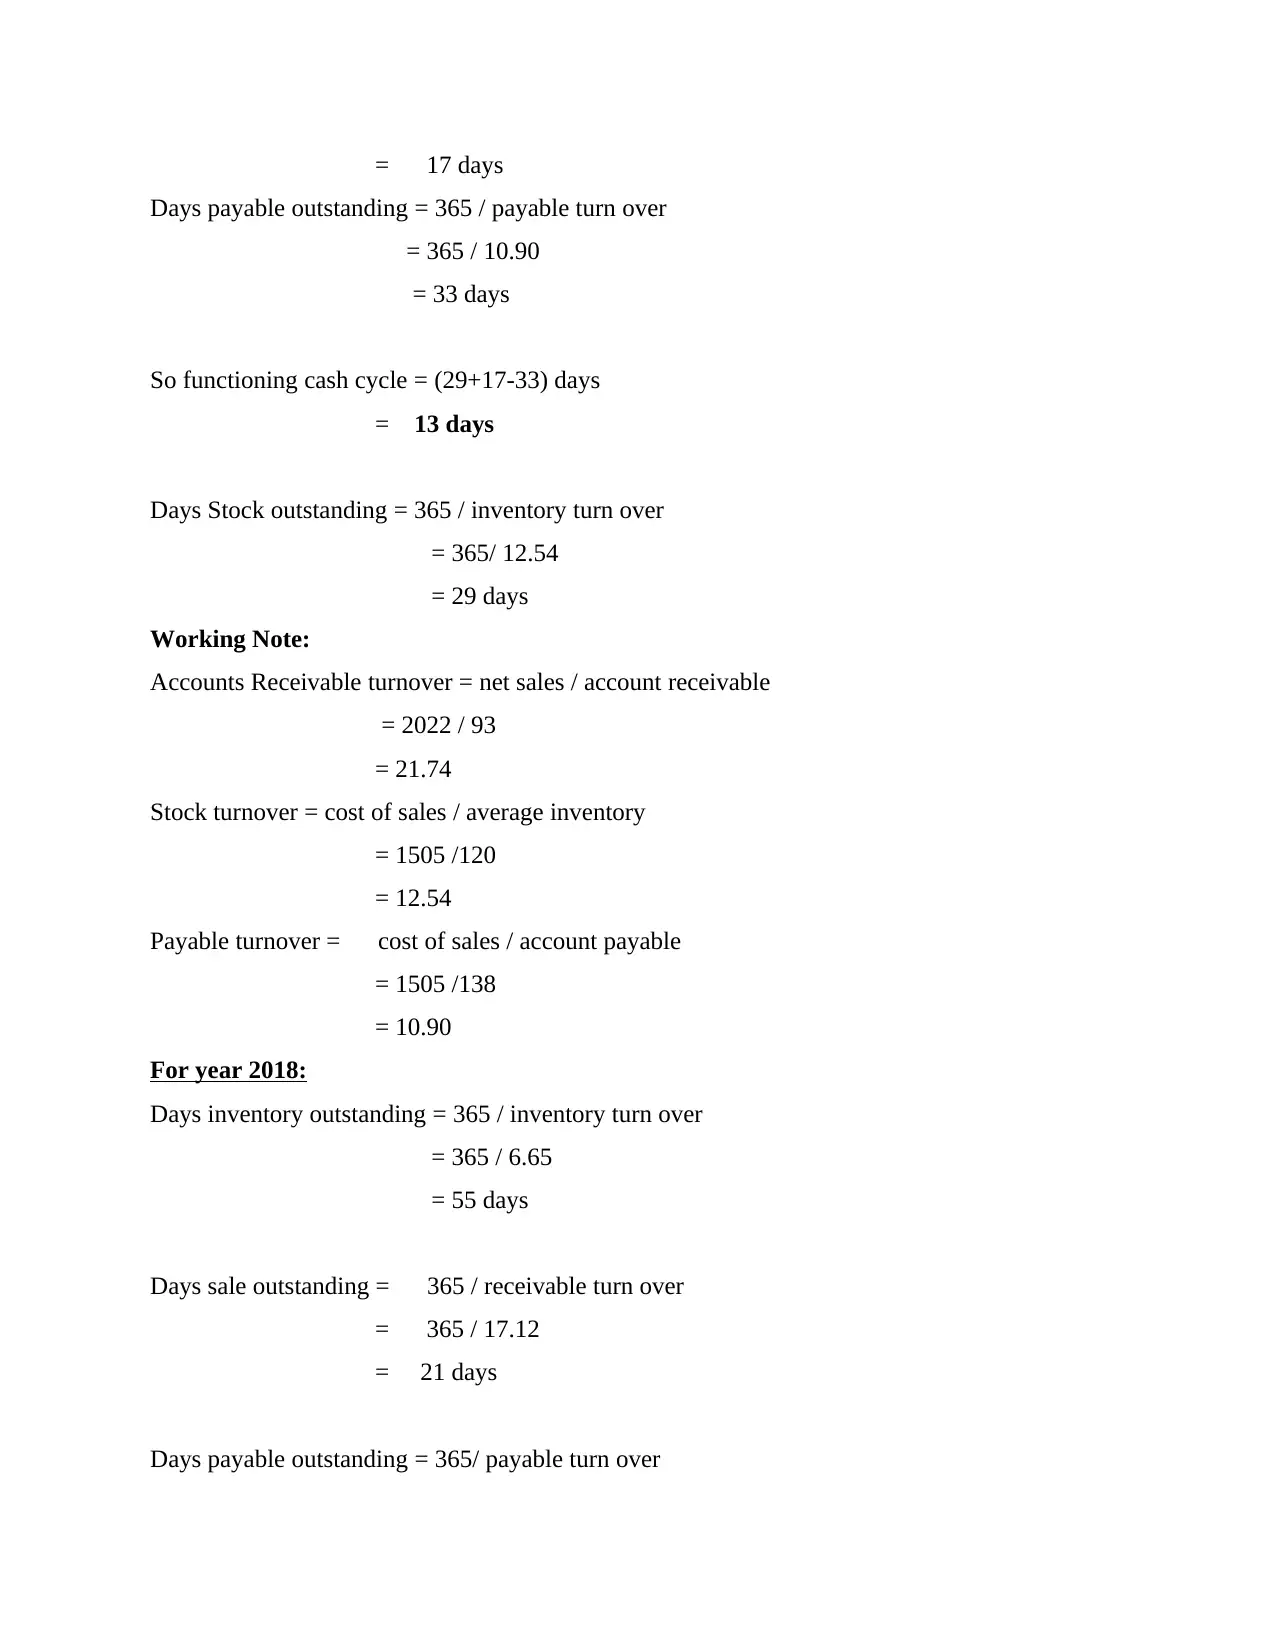
= 17 days
Days payable outstanding = 365 / payable turn over
= 365 / 10.90
= 33 days
So functioning cash cycle = (29+17-33) days
= 13 days
Days Stock outstanding = 365 / inventory turn over
= 365/ 12.54
= 29 days
Working Note:
Accounts Receivable turnover = net sales / account receivable
= 2022 / 93
= 21.74
Stock turnover = cost of sales / average inventory
= 1505 /120
= 12.54
Payable turnover = cost of sales / account payable
= 1505 /138
= 10.90
For year 2018:
Days inventory outstanding = 365 / inventory turn over
= 365 / 6.65
= 55 days
Days sale outstanding = 365 / receivable turn over
= 365 / 17.12
= 21 days
Days payable outstanding = 365/ payable turn over
⊘ This is a preview!⊘
Do you want full access?
Subscribe today to unlock all pages.
Trusted by 1+ million students worldwide
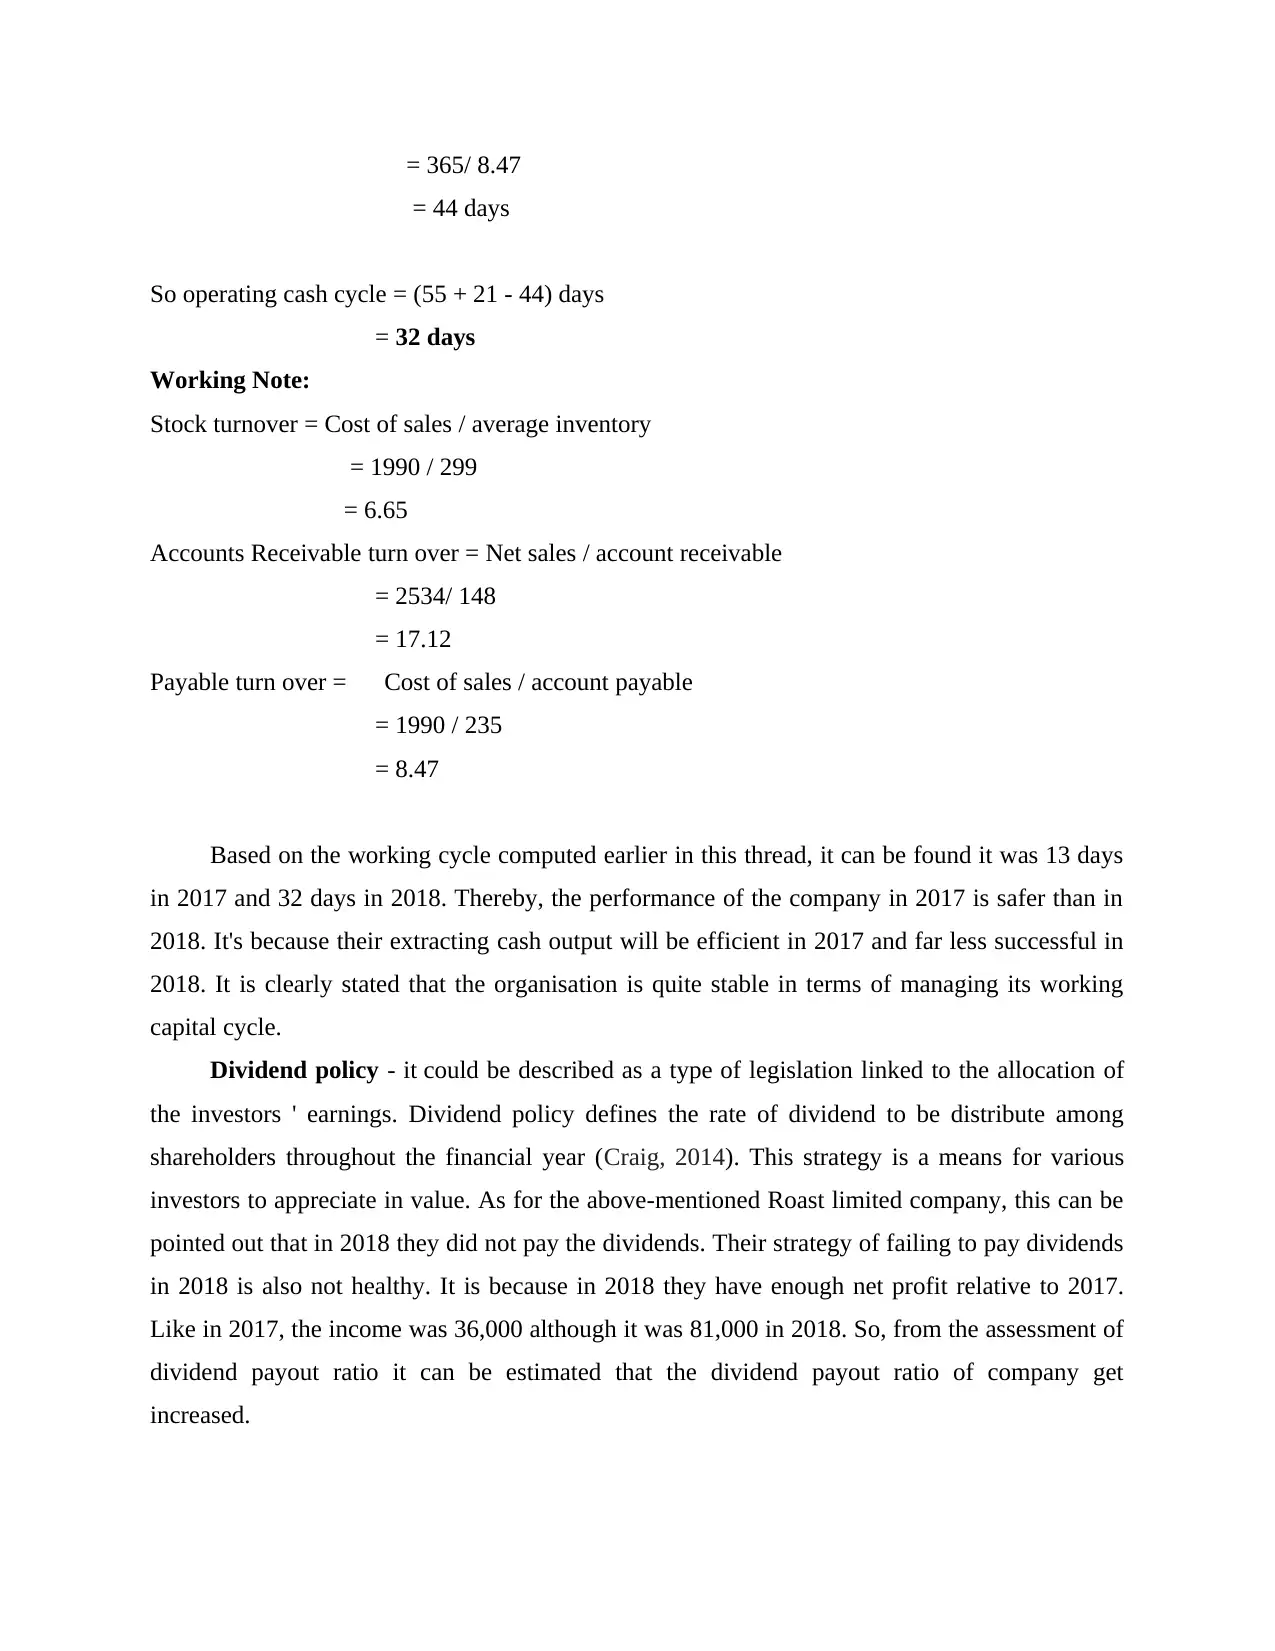
= 365/ 8.47
= 44 days
So operating cash cycle = (55 + 21 - 44) days
= 32 days
Working Note:
Stock turnover = Cost of sales / average inventory
= 1990 / 299
= 6.65
Accounts Receivable turn over = Net sales / account receivable
= 2534/ 148
= 17.12
Payable turn over = Cost of sales / account payable
= 1990 / 235
= 8.47
Based on the working cycle computed earlier in this thread, it can be found it was 13 days
in 2017 and 32 days in 2018. Thereby, the performance of the company in 2017 is safer than in
2018. It's because their extracting cash output will be efficient in 2017 and far less successful in
2018. It is clearly stated that the organisation is quite stable in terms of managing its working
capital cycle.
Dividend policy - it could be described as a type of legislation linked to the allocation of
the investors ' earnings. Dividend policy defines the rate of dividend to be distribute among
shareholders throughout the financial year (Craig, 2014). This strategy is a means for various
investors to appreciate in value. As for the above-mentioned Roast limited company, this can be
pointed out that in 2018 they did not pay the dividends. Their strategy of failing to pay dividends
in 2018 is also not healthy. It is because in 2018 they have enough net profit relative to 2017.
Like in 2017, the income was 36,000 although it was 81,000 in 2018. So, from the assessment of
dividend payout ratio it can be estimated that the dividend payout ratio of company get
increased.
Paraphrase This Document
Need a fresh take? Get an instant paraphrase of this document with our AI Paraphraser
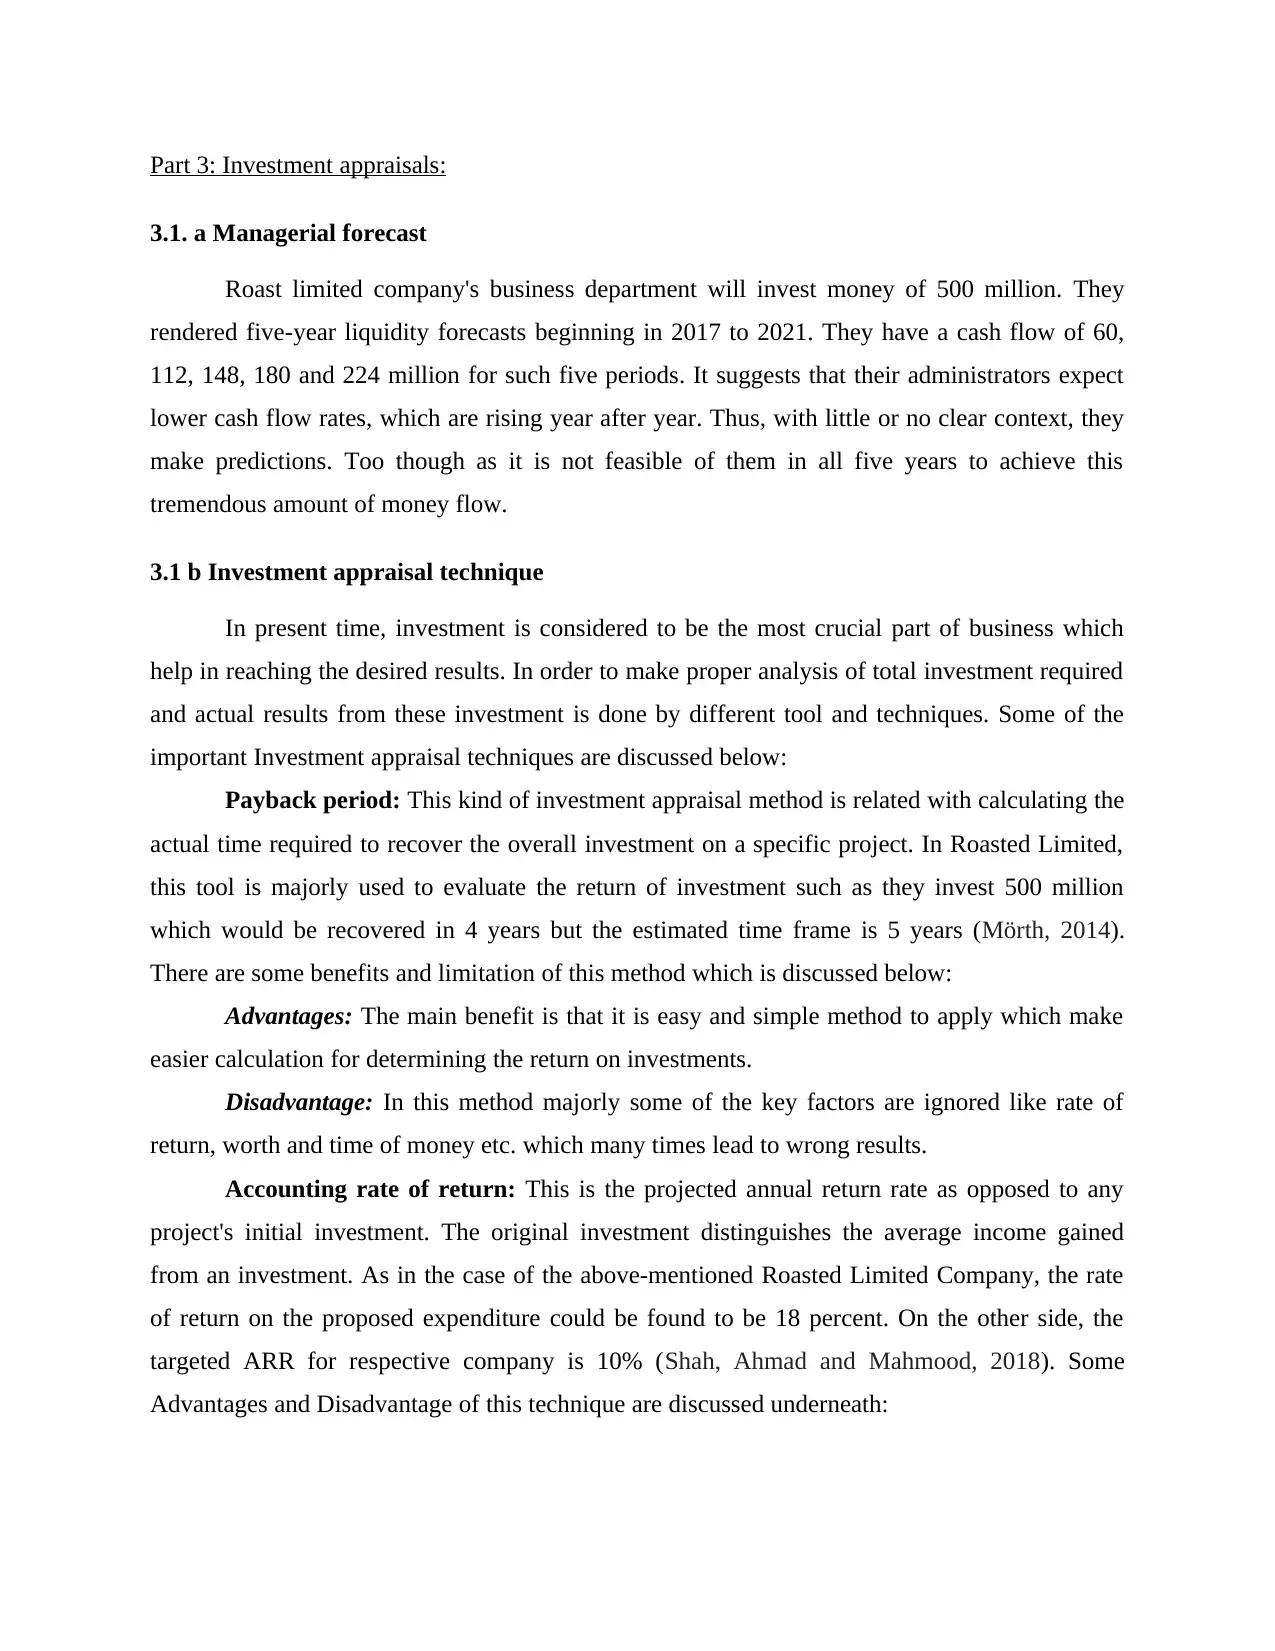
Part 3: Investment appraisals:
3.1. a Managerial forecast
Roast limited company's business department will invest money of 500 million. They
rendered five-year liquidity forecasts beginning in 2017 to 2021. They have a cash flow of 60,
112, 148, 180 and 224 million for such five periods. It suggests that their administrators expect
lower cash flow rates, which are rising year after year. Thus, with little or no clear context, they
make predictions. Too though as it is not feasible of them in all five years to achieve this
tremendous amount of money flow.
3.1 b Investment appraisal technique
In present time, investment is considered to be the most crucial part of business which
help in reaching the desired results. In order to make proper analysis of total investment required
and actual results from these investment is done by different tool and techniques. Some of the
important Investment appraisal techniques are discussed below:
Payback period: This kind of investment appraisal method is related with calculating the
actual time required to recover the overall investment on a specific project. In Roasted Limited,
this tool is majorly used to evaluate the return of investment such as they invest 500 million
which would be recovered in 4 years but the estimated time frame is 5 years (Mörth, 2014).
There are some benefits and limitation of this method which is discussed below:
Advantages: The main benefit is that it is easy and simple method to apply which make
easier calculation for determining the return on investments.
Disadvantage: In this method majorly some of the key factors are ignored like rate of
return, worth and time of money etc. which many times lead to wrong results.
Accounting rate of return: This is the projected annual return rate as opposed to any
project's initial investment. The original investment distinguishes the average income gained
from an investment. As in the case of the above-mentioned Roasted Limited Company, the rate
of return on the proposed expenditure could be found to be 18 percent. On the other side, the
targeted ARR for respective company is 10% (Shah, Ahmad and Mahmood, 2018). Some
Advantages and Disadvantage of this technique are discussed underneath:
Advantages: To determine a clear understanding of more productivity, this approach is
helpful to businesses.
Disadvantage: This strategy, together with the advantages also has disadvantages
because it does not recognize time element. As a consequence, administrators are unable to
communicate their performances.
3.2 Source of finance
There have been a wide variety of economic outlets in the financial sector component
used by businesses to meet a need for financial requirements. They can collect resources from
various types of publications throughout the aspect of the above-mentioned Roasted limited
company. Each one of them has certain drawbacks or advantages. Here are some sources for
finance which are as continues to follow:
Long-term funds -This can be described as a type of source of funds that company has
been accumulating for over a decade. Funding the company's major construction projects or
expanding the firm's activities is the basic principle of lengthy-term finances. Usually, these
resources were used to invest in things that in future years will create efficiencies for the
company. This includes of certain money origin such as:
Equity share - it is one of the primary lengthy-term fund sources for businesses. It
reflects a firm's possession. Finally, by selling ordinary stock shares, the publicly company will
raise money from either the public as or and equity (Shah, Ahmad and Mahmood, 2018). It is
one of the key financial tools commonly used by businesses to raise large amounts of funds. One
of the major benefits of this source of finance is less risk. Whereas the ownership and control
divided among shareholders in the proportion of the share value hold by them. They will receive
financial support through this fund origin in the sense of the above-mentioned Roasted Limited
Company. Below are a few of the constraints and advantages of this financing outlet which are
as follows:
Benefits -There are no specific charges associated with common shares. A share price
can be paid if a company earns sufficient finite profits, however there are no obligation dividend
payouts.
Limitation -There is no legal duty on the Company to create value on shareholdings. The
risk of shareholders missing the dividends is very high.
⊘ This is a preview!⊘
Do you want full access?
Subscribe today to unlock all pages.
Trusted by 1+ million students worldwide
1 out of 14
Related Documents


Your All-in-One AI-Powered Toolkit for Academic Success.
+13062052269
info@desklib.com
Available 24*7 on WhatsApp / Email
![[object Object]](/_next/static/media/star-bottom.7253800d.svg)
Unlock your academic potential
Copyright © 2020–2025 A2Z Services. All Rights Reserved. Developed and managed by ZUCOL.