Financial Decision Making: Ratio Analysis, Interpretation & Report
VerifiedAdded on 2023/06/10
|10
|3343
|280
Report
AI Summary
This report provides a comprehensive analysis of financial decision-making, emphasizing the importance of accounting and finance departments in maintaining a company's financial health. It assesses the role of accounting in decision-making, risk evaluation, and tax preparation, highlighting the significance of accurate financial records for business success. The report also explores various funding options available to small and medium-sized businesses, including owner investments, angel investors, and bank lending. Furthermore, it includes a detailed calculation and interpretation of financial ratios, such as gross profitability, operational income, return on capital employed, current ratio, acid test ratio, stock turnover days, debtor collecting period, and creditor payment period, using data from 2018 and 2019. The analysis provides insights into the company's financial performance and areas for improvement. This document is available on Desklib, a platform offering a wide range of study tools and solved assignments for students.

FINANCIAL
DECISION MAKING
DECISION MAKING
Paraphrase This Document
Need a fresh take? Get an instant paraphrase of this document with our AI Paraphraser
Contents
FINANCIAL DECISION MAKING..................................................................................................1
Contents...........................................................................................................................................2
INTRODUCTION...........................................................................................................................3
TASK 1............................................................................................................................................3
Assessment of the concept...........................................................................................................3
TASK 2............................................................................................................................................6
A. Calculation of ratios:...............................................................................................................6
B. The Comprehension of Ratios.................................................................................................7
CONCLUSION................................................................................................................................9
REFERENCES..............................................................................................................................10
INTRODUCTION
Fiscal decision-making is critical since it aids in taking selections based on available cash.
Without steady working capital, there can be no industry (Adiandari and Sumintono, 2021)(Altan
and Karasu, 2019). It really is the most important indicator in business, and it's used both
internally and externally. The accounting and finance department is responsible for ensuring that
the company's money are treated properly and preserved in order to support all of the business's
operational activities. A company's success depends on periodic income and spending tracking,
compliance to legislation and requirements, and the delivery of verifiable financial figures to
investors, management, and officials.
TASK 1
Assessment of the concept
If a company wants to stay afloat, it must keep accurate and up-to-date financial records.
Here are certain more reasons why a small or medium-sized business requires an accounting and
fiscal department, as well as their responsibilities.
Accountancy might also help a company maintain its employees on a level where they
are ready and capable to serve the company at their best. Reconciling monetary data and
preparing monetary statements on a periodic basis. Dishonesty will be recognised early,
before it had a big impact on the company (Blue, 2017).
It aids in the procedure of decision-making. The organisation will have to evaluate the
data, particularly fiscal data, to comprehend and interpret these sorts of enquiries.
Accounting can help you avoid common business blunders such as:
Plateauing
Consuming up more assets than what is required
Inadequate finances
Can investigate alternate strategies using genuine statistics information as before making
any major changes, the company would probably completed a risk evaluation for the
minor company. It will have been feasible to analyse whether taking that kind of a chance
is beneficial to the company.
Helps in the assessment of a business's success as the financial records contain
information about the company's operating and financial health. As a result, they enable
⊘ This is a preview!⊘
Do you want full access?
Subscribe today to unlock all pages.
Trusted by 1+ million students worldwide
the company in better comprehending its fiscal situation. Maintaining accurate and up-to-
date paperwork in connection to tracking expenses, operational revenue, and predicted
debts allows one to compare current data to prior accounting records and adjust planning
accordingly (Brescia, 2019).
It supports the estimates stated on the taxable refund as micro business tax filing is
avoided by many business owners, particularly those who don't understand how to begin.
Considering those considerations, it is clear that accounting is critical to any business.
Obtaining financial papers is the first step in finalising a taxes rebate. The business would
be unlikely to submit the taxes rebate if it lacks the necessary papers (such as financial
record).
Accounting keeps the company responsible as a small business owner knows the
importance of demonstrating rather than talking. Accounting and the finance department
are in charge of this. Individual investors are made accountable for the company's
success. Accounting records reveal information on the company's development and
success.
It aids in the preparation of future planning and forecasting as the accounting and
financial department is crucial for establishing and executing forecasts based on the
financial information.
It helps in making Filing Financial Statements Easier as every company's financial
statement must be presented with the Articles of Registration. Publicly listed companies
should file both direct and deferred taxation filings with the Revenue Taxes Authority.
All of these situations necessitate accounting (Gerrans. and Heaney, 2019).
Comments
Individual engagement and redundancy will be possible thanks to a cloud computing
solutions that can be accessible from anywhere.
If the accounting department is good, enable clients to take advantage of the firm by
providing to purchase extra products or participate in innovative technologies.
Keep ones portion of the agreement and refuse to offer any extended operations until all
past-due amounts are paid.
The importance of early reconciliation cannot be overstated.
Setting and adhering to benchmark rules is essential.
Paraphrase This Document
Need a fresh take? Get an instant paraphrase of this document with our AI Paraphraser
As a consequence, it has had an impact on the division, management, and other
mechanisms that rely upon that.
Whenever a small company gets registered on the financial exchange, its ability to produce
capital increases. A firm's application for a finance system accreditation can be considered at any
time. Many small and medium-sized businesses (SMEs) will almost certainly not be unable to
meet this goal (Höchtl, Parycek and Schöllhammer, 2016).
Small and mid-sized businesses have such a variety of options whenever it relates to funding.
A range of financial options are available to these companies. The drawbacks on either end may
limit their usefulness. The elaborated are some of the most important elements and associated
weaknesses. After that, the financing of crowd sourcing and marketing networks is studied in
further depth.
Investors related to the owner of a minor or medium-sized business may be prepared to
accept a lesser rate of return than that of the majority of other investors. Some people's ability to
raise finances under their own or with the support of family and co-workers is limited.
Business founders are the firm's backers, who are wealthy people willing to take a risk and invest
in small businesses. Because these people are so rare, they are very picky about the enterprises
into that they can put their money. Because of their extensive network and financial knowledge,
angel investors can very well be extremely beneficial to small and medium-sized firms (Hua,
Huang and Zheng, 2019).
Activities are credited to the account as whenever it comes to accepting credits for products
provided by third parties, a small business is no different than anyone else. If the supplier has
classified your organisation as a high-risk smaller business, extending repayment schedule may
be difficult. For the time being, the strategy is only marginally useful because it could not be
employed in the big scheme of things.
Companies can use refinancing and discounting billing to recover payments from the value
of existing trade receivables, allowing them to raise capital. This form of financing seems to be
more expensive than cash advanced, and it is typically only available for a certain time. Another
of the key benefits of these kinds of finance options is that an expanding smaller and medium-
sized business, on either end, will be likely to get more cash from a supplier or billing retailing
location. Costs are factored and bill discounting are two finance solutions which might emerge
when a business grows (Kostini and Raharja, 2019).
Banking lending funding, as entities, may be willing to accept both short-term bank debt and
long-term loans backed by large assets like real estate and equipment. Medium-term capital for
smaller and medium-sized businesses (SMEs) is more tough to obtain by because lenders are
much more cautious. A significant percentage of successful mortgages are sufficient to correct
for a single negative credit. As a consequence, small and medium-sized businesses typically use
short-term financing, such as an overdraft, to fund medium- and long-term projects. However,
this drops below of our goals and should be disregarded. The "length gap" is the disparity
between a company's assets and liabilities in terms of competency. A small business owner-
manager will have to place his or her individual belongings on the brink to receive a loan from a
financial institution (Li, Crook and Andreeva, 2017).
TASK 2
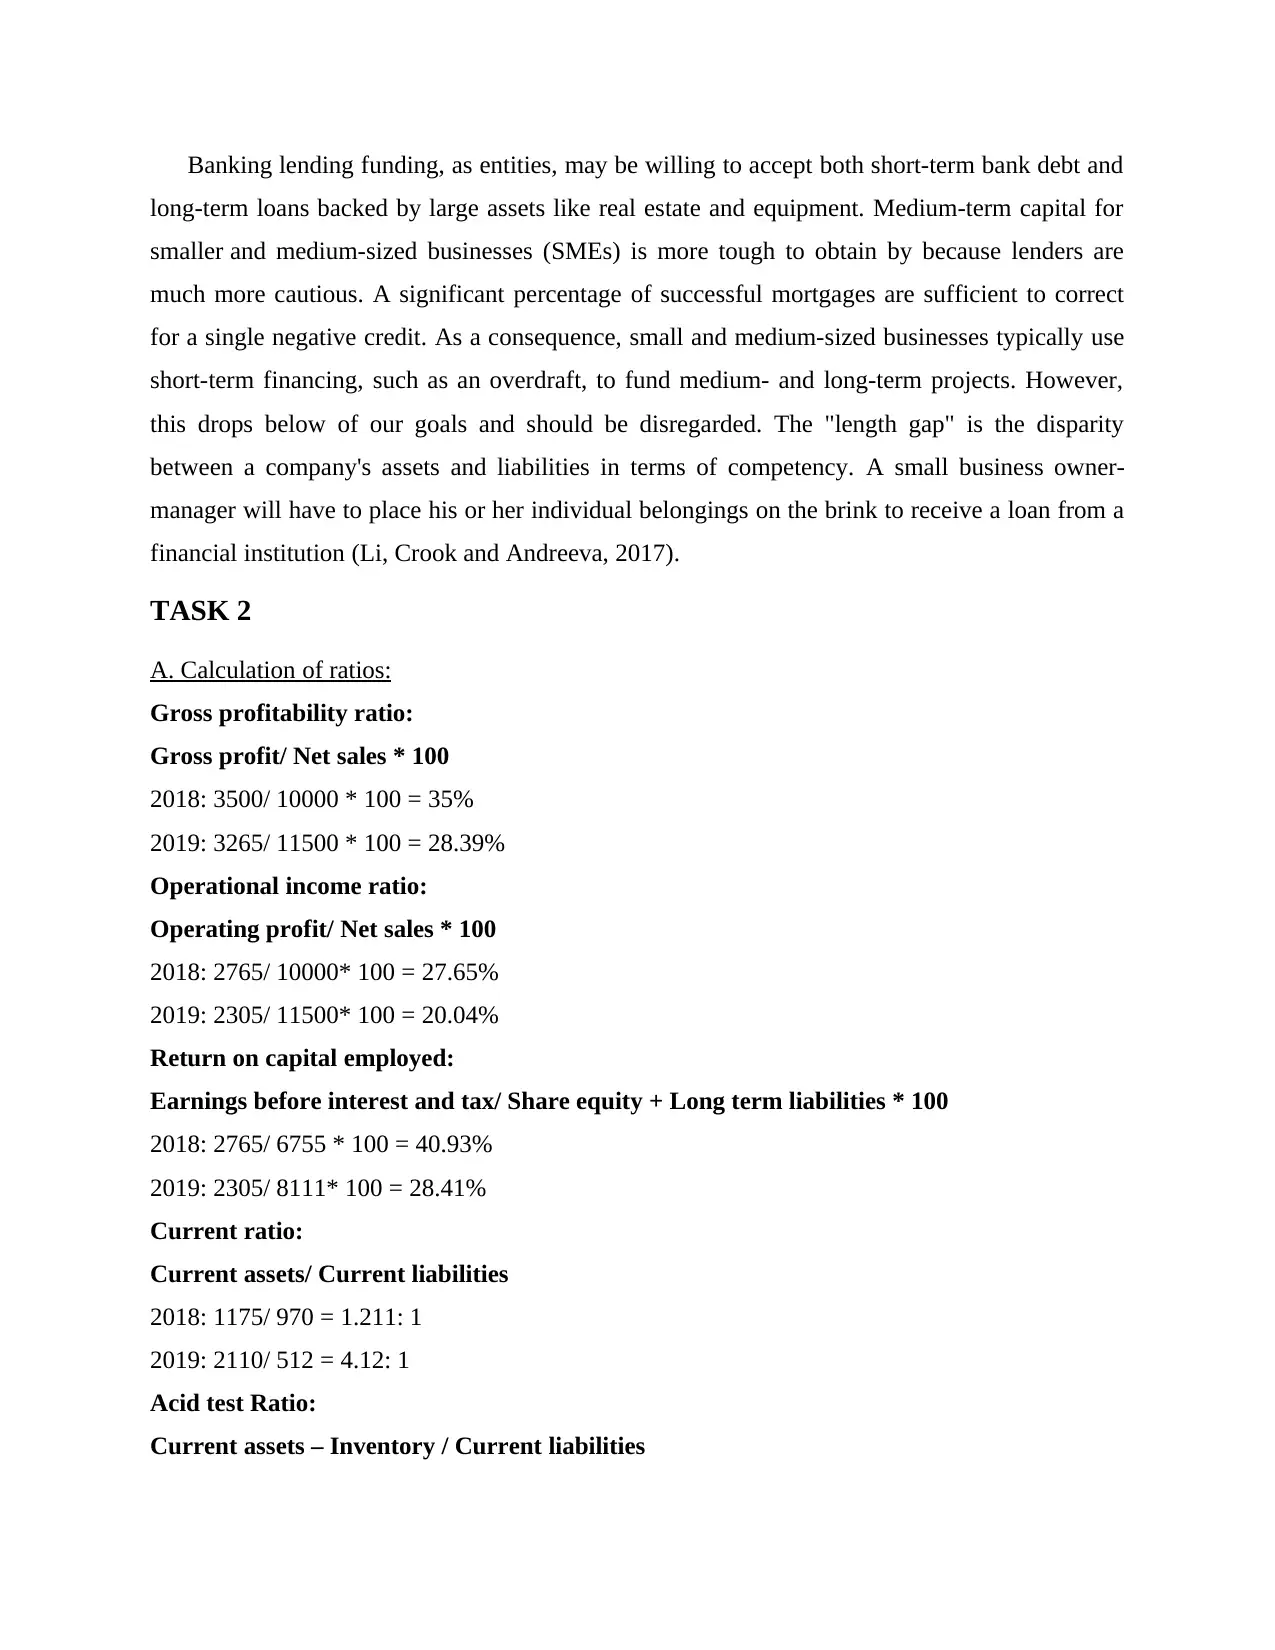
A. Calculation of ratios:
Gross profitability ratio:
Gross profit/ Net sales * 100
2018: 3500/ 10000 * 100 = 35%
2019: 3265/ 11500 * 100 = 28.39%
Operational income ratio:
Operating profit/ Net sales * 100
2018: 2765/ 10000* 100 = 27.65%
2019: 2305/ 11500* 100 = 20.04%
Return on capital employed:
Earnings before interest and tax/ Share equity + Long term liabilities * 100
2018: 2765/ 6755 * 100 = 40.93%
2019: 2305/ 8111* 100 = 28.41%
Current ratio:
Current assets/ Current liabilities
2018: 1175/ 970 = 1.211: 1
2019: 2110/ 512 = 4.12: 1
Acid test Ratio:
Current assets – Inventory / Current liabilities
long-term loans backed by large assets like real estate and equipment. Medium-term capital for
smaller and medium-sized businesses (SMEs) is more tough to obtain by because lenders are
much more cautious. A significant percentage of successful mortgages are sufficient to correct
for a single negative credit. As a consequence, small and medium-sized businesses typically use
short-term financing, such as an overdraft, to fund medium- and long-term projects. However,
this drops below of our goals and should be disregarded. The "length gap" is the disparity
between a company's assets and liabilities in terms of competency. A small business owner-
manager will have to place his or her individual belongings on the brink to receive a loan from a
financial institution (Li, Crook and Andreeva, 2017).
TASK 2
A. Calculation of ratios:
Gross profitability ratio:
Gross profit/ Net sales * 100
2018: 3500/ 10000 * 100 = 35%
2019: 3265/ 11500 * 100 = 28.39%
Operational income ratio:
Operating profit/ Net sales * 100
2018: 2765/ 10000* 100 = 27.65%
2019: 2305/ 11500* 100 = 20.04%
Return on capital employed:
Earnings before interest and tax/ Share equity + Long term liabilities * 100
2018: 2765/ 6755 * 100 = 40.93%
2019: 2305/ 8111* 100 = 28.41%
Current ratio:
Current assets/ Current liabilities
2018: 1175/ 970 = 1.211: 1
2019: 2110/ 512 = 4.12: 1
Acid test Ratio:
Current assets – Inventory / Current liabilities
⊘ This is a preview!⊘
Do you want full access?
Subscribe today to unlock all pages.
Trusted by 1+ million students worldwide
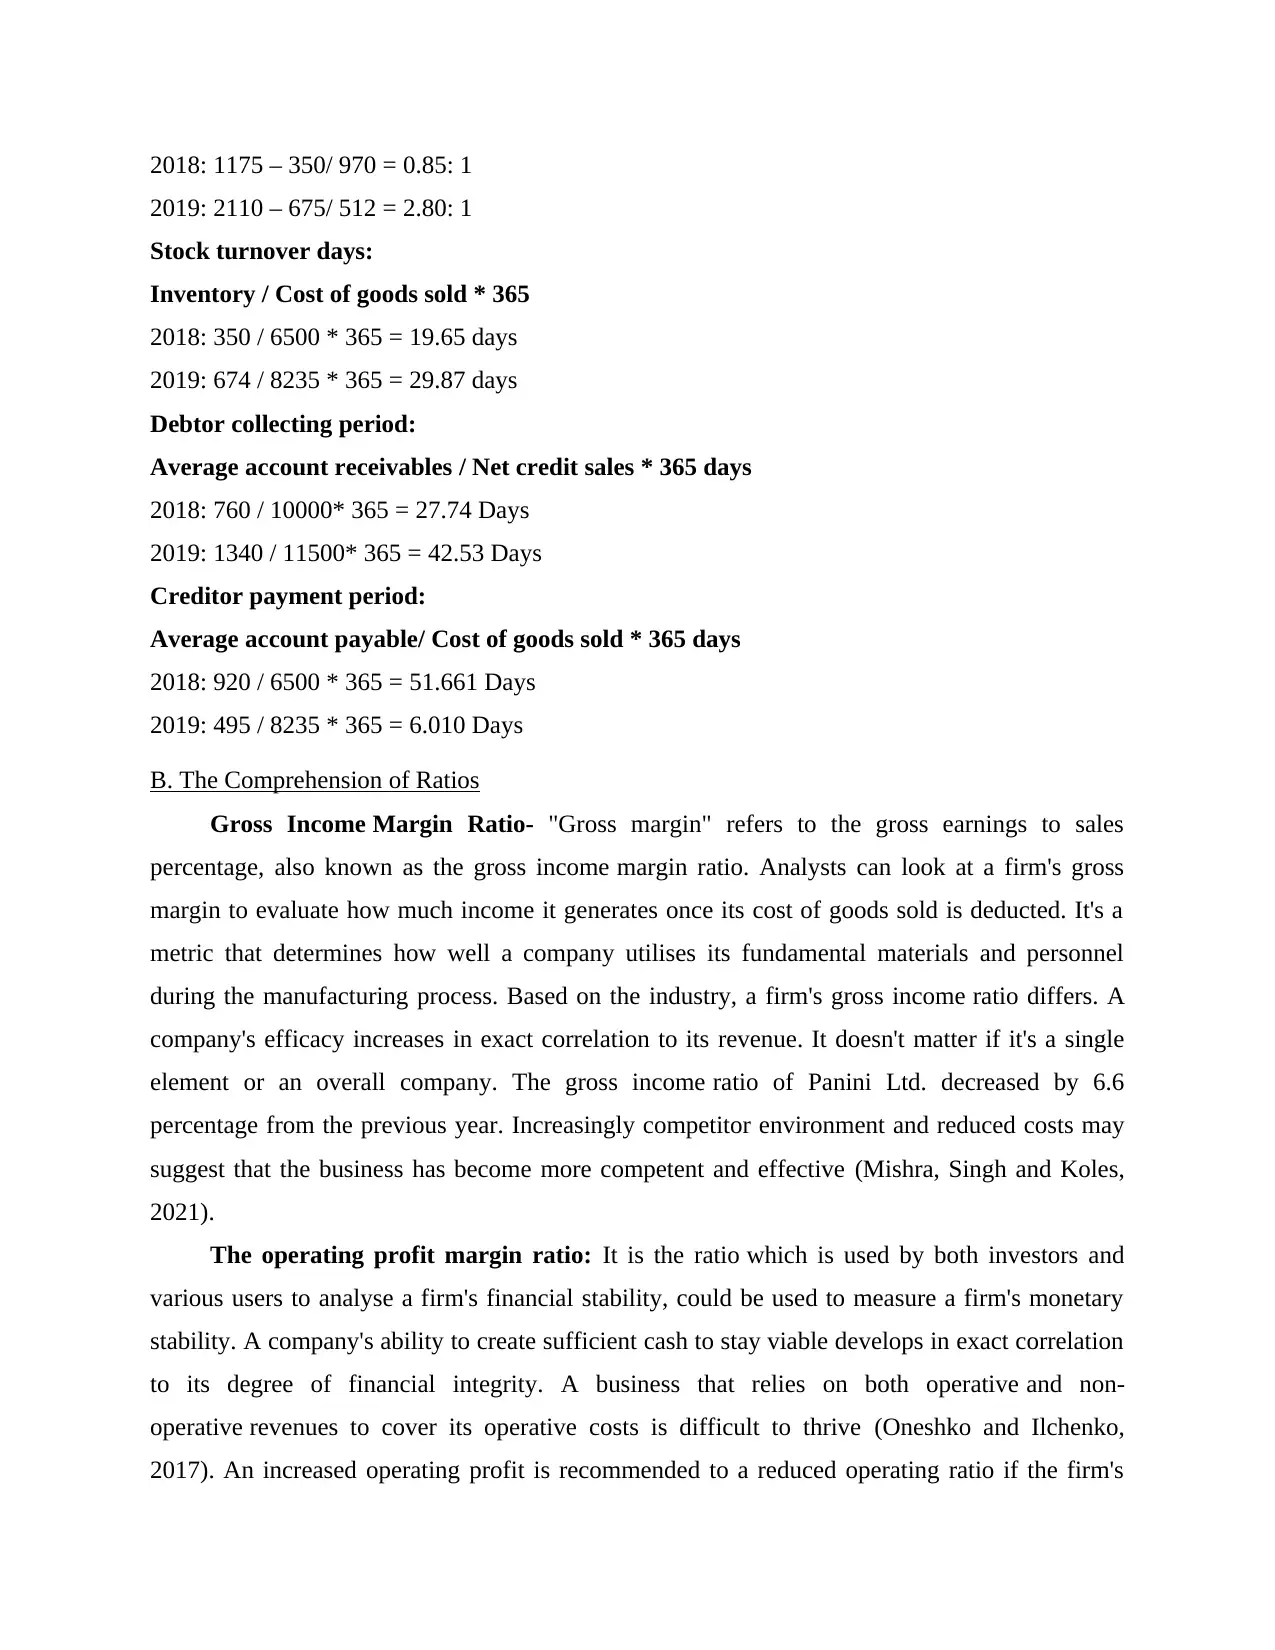
2018: 1175 – 350/ 970 = 0.85: 1
2019: 2110 – 675/ 512 = 2.80: 1
Stock turnover days:
Inventory / Cost of goods sold * 365
2018: 350 / 6500 * 365 = 19.65 days
2019: 674 / 8235 * 365 = 29.87 days
Debtor collecting period:
Average account receivables / Net credit sales * 365 days
2018: 760 / 10000* 365 = 27.74 Days
2019: 1340 / 11500* 365 = 42.53 Days
Creditor payment period:
Average account payable/ Cost of goods sold * 365 days
2018: 920 / 6500 * 365 = 51.661 Days
2019: 495 / 8235 * 365 = 6.010 Days
B. The Comprehension of Ratios
Gross Income Margin Ratio- "Gross margin" refers to the gross earnings to sales
percentage, also known as the gross income margin ratio. Analysts can look at a firm's gross
margin to evaluate how much income it generates once its cost of goods sold is deducted. It's a
metric that determines how well a company utilises its fundamental materials and personnel
during the manufacturing process. Based on the industry, a firm's gross income ratio differs. A
company's efficacy increases in exact correlation to its revenue. It doesn't matter if it's a single
element or an overall company. The gross income ratio of Panini Ltd. decreased by 6.6
percentage from the previous year. Increasingly competitor environment and reduced costs may
suggest that the business has become more competent and effective (Mishra, Singh and Koles,
2021).
The operating profit margin ratio: It is the ratio which is used by both investors and
various users to analyse a firm's financial stability, could be used to measure a firm's monetary
stability. A company's ability to create sufficient cash to stay viable develops in exact correlation
to its degree of financial integrity. A business that relies on both operative and non-
operative revenues to cover its operative costs is difficult to thrive (Oneshko and Ilchenko,
2017). An increased operating profit is recommended to a reduced operating ratio if the firm's
Paraphrase This Document
Need a fresh take? Get an instant paraphrase of this document with our AI Paraphraser
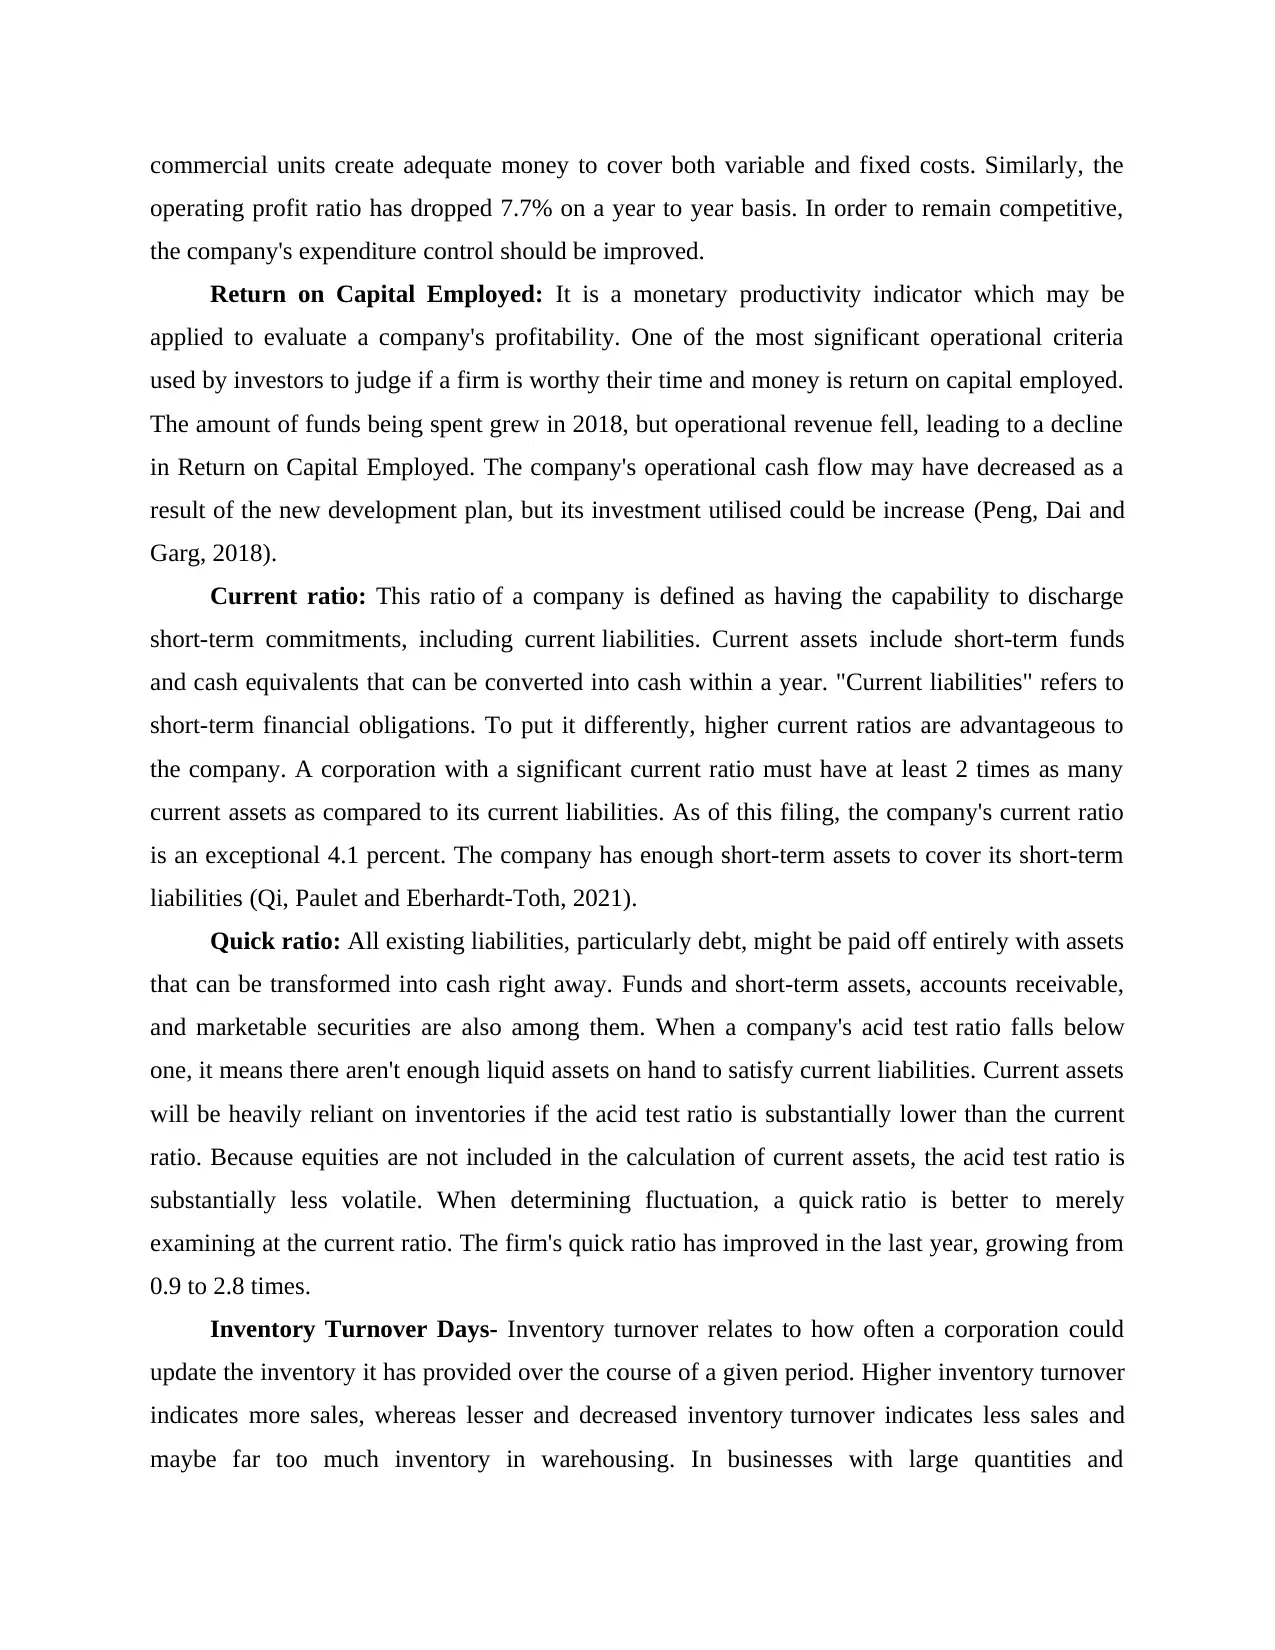
commercial units create adequate money to cover both variable and fixed costs. Similarly, the
operating profit ratio has dropped 7.7% on a year to year basis. In order to remain competitive,
the company's expenditure control should be improved.
Return on Capital Employed: It is a monetary productivity indicator which may be
applied to evaluate a company's profitability. One of the most significant operational criteria
used by investors to judge if a firm is worthy their time and money is return on capital employed.
The amount of funds being spent grew in 2018, but operational revenue fell, leading to a decline
in Return on Capital Employed. The company's operational cash flow may have decreased as a
result of the new development plan, but its investment utilised could be increase (Peng, Dai and
Garg, 2018).
Current ratio: This ratio of a company is defined as having the capability to discharge
short-term commitments, including current liabilities. Current assets include short-term funds
and cash equivalents that can be converted into cash within a year. "Current liabilities" refers to
short-term financial obligations. To put it differently, higher current ratios are advantageous to
the company. A corporation with a significant current ratio must have at least 2 times as many
current assets as compared to its current liabilities. As of this filing, the company's current ratio
is an exceptional 4.1 percent. The company has enough short-term assets to cover its short-term
liabilities (Qi, Paulet and Eberhardt-Toth, 2021).
Quick ratio: All existing liabilities, particularly debt, might be paid off entirely with assets
that can be transformed into cash right away. Funds and short-term assets, accounts receivable,
and marketable securities are also among them. When a company's acid test ratio falls below
one, it means there aren't enough liquid assets on hand to satisfy current liabilities. Current assets
will be heavily reliant on inventories if the acid test ratio is substantially lower than the current
ratio. Because equities are not included in the calculation of current assets, the acid test ratio is
substantially less volatile. When determining fluctuation, a quick ratio is better to merely
examining at the current ratio. The firm's quick ratio has improved in the last year, growing from
0.9 to 2.8 times.
Inventory Turnover Days- Inventory turnover relates to how often a corporation could
update the inventory it has provided over the course of a given period. Higher inventory turnover
indicates more sales, whereas lesser and decreased inventory turnover indicates less sales and
maybe far too much inventory in warehousing. In businesses with large quantities and
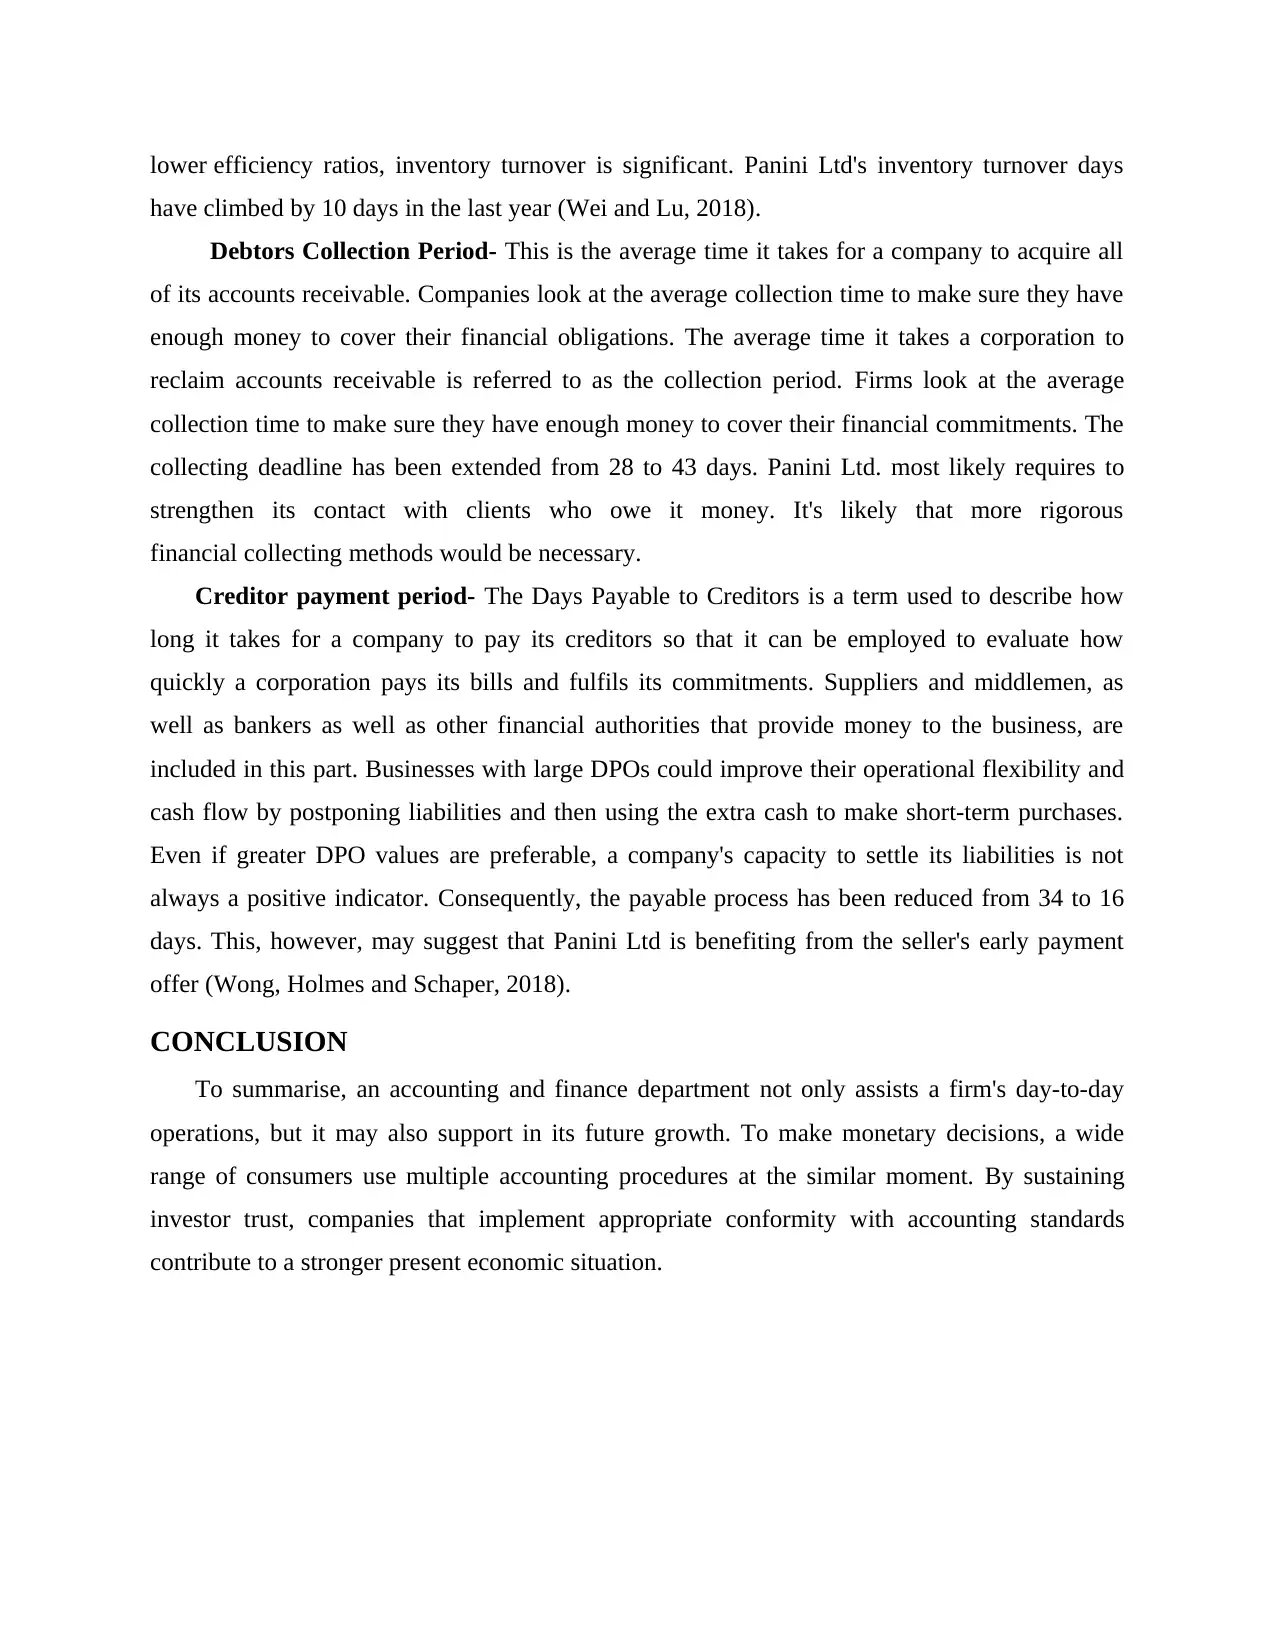
lower efficiency ratios, inventory turnover is significant. Panini Ltd's inventory turnover days
have climbed by 10 days in the last year (Wei and Lu, 2018).
Debtors Collection Period- This is the average time it takes for a company to acquire all
of its accounts receivable. Companies look at the average collection time to make sure they have
enough money to cover their financial obligations. The average time it takes a corporation to
reclaim accounts receivable is referred to as the collection period. Firms look at the average
collection time to make sure they have enough money to cover their financial commitments. The
collecting deadline has been extended from 28 to 43 days. Panini Ltd. most likely requires to
strengthen its contact with clients who owe it money. It's likely that more rigorous
financial collecting methods would be necessary.
Creditor payment period- The Days Payable to Creditors is a term used to describe how
long it takes for a company to pay its creditors so that it can be employed to evaluate how
quickly a corporation pays its bills and fulfils its commitments. Suppliers and middlemen, as
well as bankers as well as other financial authorities that provide money to the business, are
included in this part. Businesses with large DPOs could improve their operational flexibility and
cash flow by postponing liabilities and then using the extra cash to make short-term purchases.
Even if greater DPO values are preferable, a company's capacity to settle its liabilities is not
always a positive indicator. Consequently, the payable process has been reduced from 34 to 16
days. This, however, may suggest that Panini Ltd is benefiting from the seller's early payment
offer (Wong, Holmes and Schaper, 2018).
CONCLUSION
To summarise, an accounting and finance department not only assists a firm's day-to-day
operations, but it may also support in its future growth. To make monetary decisions, a wide
range of consumers use multiple accounting procedures at the similar moment. By sustaining
investor trust, companies that implement appropriate conformity with accounting standards
contribute to a stronger present economic situation.
⊘ This is a preview!⊘
Do you want full access?
Subscribe today to unlock all pages.
Trusted by 1+ million students worldwide
REFERENCES
Books and journals
Adiandari, A. M. and Sumintono, B., 2021. Developing a Scale of Financial Attitudes in
Emergency Fund Ownership Decision Making. Jurnal Manajemen. 25(1). pp.141-159.
Altan, A. and Karasu, S., 2019. The effect of kernel values in support vector machine to
forecasting performance of financial time series. The Journal of Cognitive Systems,
4(1), pp.17-21.
Blue, L., 2017. There are serious problems with the concept of ‘financial literacy’. The
Conversation, pp.1-3.
Brescia, V., 2019. The popular financial reporting: new accounting tool for Italian
municipalities. FrancoAngeli.
Gerrans, P. and Heaney, R., 2019. The impact of undergraduate personal finance education on
individual financial literacy, attitudes and intentions. Accounting & Finance, 59(1),
pp.177-217.
Höchtl, J., Parycek, P. and Schöllhammer, R., 2016. Big data in the policy cycle: Policy decision
making in the digital era. Journal of Organizational Computing and Electronic
Commerce, 26(1-2), pp.147-169.
Hua, X., Huang, Y. and Zheng, Y., 2019. Current practices, new insights, and emerging trends of
financial technologies. Industrial Management & Data Systems.
Kostini, N. and Raharja, S. U. J., 2019. Financial strategy of small and medium businesses on the
creative industry in Bandung, Indonesia. International Journal of Economic Policy in
Emerging Economies. 12(2). pp.130-139.
Li, Z., Crook, J. and Andreeva, G., 2017. Dynamic prediction of financial distress using
Malmquist DEA. Expert Systems with Applications. 80. pp.94-106.
Mishra, R., Singh, R. K. and Koles, B., 2021. Consumer decision‐making in Omnichannel
retailing: Literature review and future research agenda. International Journal of
Consumer Studies. 45(2). pp.147-174.
Oneshko, S. and Ilchenko, S., 2017. Financial monitoring of the port industry companies on the
basis of risk-oriented approach. Investment management and financial innovations,
(14,№ 1 (contin.)), pp.191-199.
Peng, X., Dai, J. and Garg, H., 2018. Exponential operation and aggregation operator for q‐rung
orthopair fuzzy set and their decision‐making method with a new score function.
International Journal of Intelligent Systems, 33(11), pp.2255-2282.
Qi, J., Paulet, E. and Eberhardt-Toth, E., 2021. Chinese bank managers’ perceptions of barriers
to the implementation of green credit in corporate loan decision-making. Post-
Communist Economies. pp.1-17.
Wei, G. and Lu, M., 2018. Pythagorean fuzzy Maclaurin symmetric mean operators in multiple
attribute decision making. International Journal of Intelligent Systems, 33(5), pp.1043-
1070.
Wong, A., Holmes, S. and Schaper, M.T., 2018. How do small business owners actually make
their financial decisions? Understanding SME financial behaviour using a case-based
approach. Small Enterprise Research, 25(1), pp.36-51.
1 out of 10
Related Documents


Your All-in-One AI-Powered Toolkit for Academic Success.
+13062052269
info@desklib.com
Available 24*7 on WhatsApp / Email
![[object Object]](/_next/static/media/star-bottom.7253800d.svg)
Unlock your academic potential
Copyright © 2020–2026 A2Z Services. All Rights Reserved. Developed and managed by ZUCOL.