[SOLVED] Financial Analysis of Harvey Homes Plc.
VerifiedAdded on 2020/09/03
|23
|5220
|56
AI Summary
The assignment involves a comprehensive financial analysis of Harvey Homes Plc., including calculation of key ratios such as debt ratio, quick ratio, current ratio, days inventory outstanding (DIO), days sales outstanding (DSO), and days payable outstanding (DPO). It also compares the company's gross profit and net sales, operating profits and revenue, cash conversion cycle, and cash flow from operating, investing, and financing activities. The analysis provides a detailed understanding of the company's financial performance and position.
Contribute Materials
Your contribution can guide someone’s learning journey. Share your
documents today.

FINANCIAL DECISION
MAKING
MAKING
Secure Best Marks with AI Grader
Need help grading? Try our AI Grader for instant feedback on your assignments.
Table of Contents
EXECUTIVE SUMMARY.............................................................................................................1
PART 1............................................................................................................................................1
Analysing the statement of profit or loss................................................................................1
Financial position analysis.....................................................................................................5
Analysis of cash flow statement.............................................................................................9
Market Segment Analysis.....................................................................................................10
PART 2: INVESTMENT APPRAISAL........................................................................................12
Management forecast ...........................................................................................................12
Techniques of investment appraisal ....................................................................................12
Payback period ................................................................................................................12
Accounting/Average rate of return (ARR) .....................................................................13
Net present value..................................................................................................................13
Non-financial factors ...........................................................................................................14
APPENDIX....................................................................................................................................18
Illustration Index
Illustration 1: Comparison of gross profit and net sales..................................................................2
Illustration 2: Comparison of operating profits and revenue..........................................................3
Illustration 3: Comparison of operating profits and capital employed............................................4
Illustration 4: Current ratio of Harvey Homes Plc...........................................................................6
Illustration 5: Quick ratio of Harvey Homes Plc.............................................................................7
Illustration 6: Debt ratio of the Harvey Homes Plc.........................................................................8
Illustration 7: Cash flow from operating, investing and financing activities...................................9
Illustration 8: Comparison of Cash Conversion Cycle..................................................................10
Illustration 9: Comparison of the company's different segments..................................................11
Index of Tables
Table 1: Ratio analysis for profit and loss statement.....................................................................18
Table 2: Calculation of Capital employed.....................................................................................18
Table 3: Cash flow from operating, investing and financing activities.........................................19
Table 4: Calculation of DIO, DSO and DPO.................................................................................19
EXECUTIVE SUMMARY
Analysing the financial statements of the entity helps in better decision making. It is
helpful in comparative analysis of sales, profits, assets etc (Allen, Larson and Sloan, 2013).
Harvey homes is a company which is involved in creating quality homes. Ratio analysis
technique have been used to analyse the financial statement of the company. Capital
budgeting technique have been used to assess that whether the project will prove to be
profitable for the company or not. The key findings suggest that current ratio of the company
is on higher side as compared to the ideal one which shows that the entity is not optimally
utilizing its resources available with it. Further, it has taken long term loan for 150 million in
order to meet its expenses as Harvey is not generating much operating cash in order to meet
out its needs. Midlands in not generating high revenues where the entity is advised to
improve its product mix and marketing strategy for better profits in near future. Moreover,
some financial and non-financial factors have been discussed which the enterprise should
consider while expanding in other country.
PART 1
Analysing the statement of profit or loss
Gross margin ratio
1
Secure Best Marks with AI Grader
Need help grading? Try our AI Grader for instant feedback on your assignments.
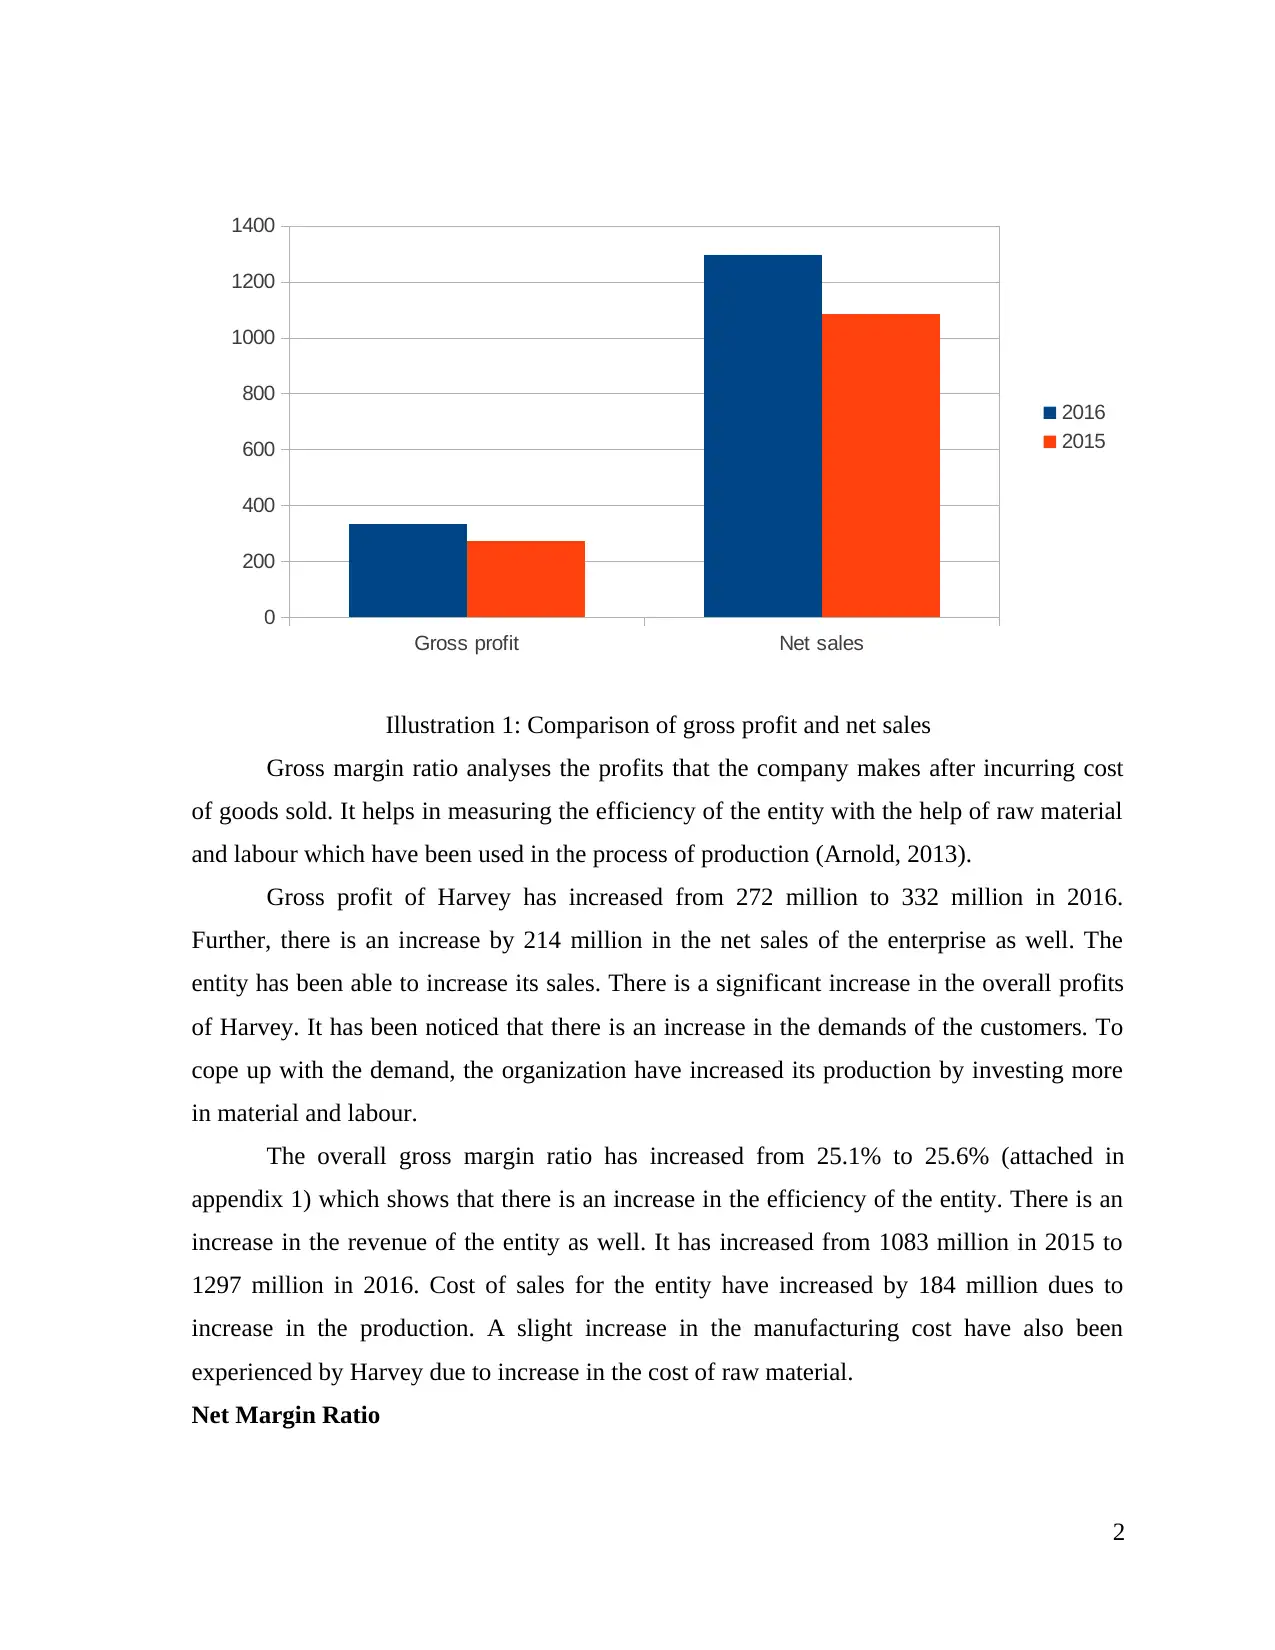
Gross margin ratio analyses the profits that the company makes after incurring cost
of goods sold. It helps in measuring the efficiency of the entity with the help of raw material
and labour which have been used in the process of production (Arnold, 2013).
Gross profit of Harvey has increased from 272 million to 332 million in 2016.
Further, there is an increase by 214 million in the net sales of the enterprise as well. The
entity has been able to increase its sales. There is a significant increase in the overall profits
of Harvey. It has been noticed that there is an increase in the demands of the customers. To
cope up with the demand, the organization have increased its production by investing more
in material and labour.
The overall gross margin ratio has increased from 25.1% to 25.6% (attached in
appendix 1) which shows that there is an increase in the efficiency of the entity. There is an
increase in the revenue of the entity as well. It has increased from 1083 million in 2015 to
1297 million in 2016. Cost of sales for the entity have increased by 184 million dues to
increase in the production. A slight increase in the manufacturing cost have also been
experienced by Harvey due to increase in the cost of raw material.
Net Margin Ratio
2
Gross profit Net sales
0
200
400
600
800
1000
1200
1400
2016
2015
Illustration 1: Comparison of gross profit and net sales
Operating profits Revenue
0
200
400
600
800
1000
1200
1400
2016
2015
Illustration 2: Comparison of operating profits and revenue
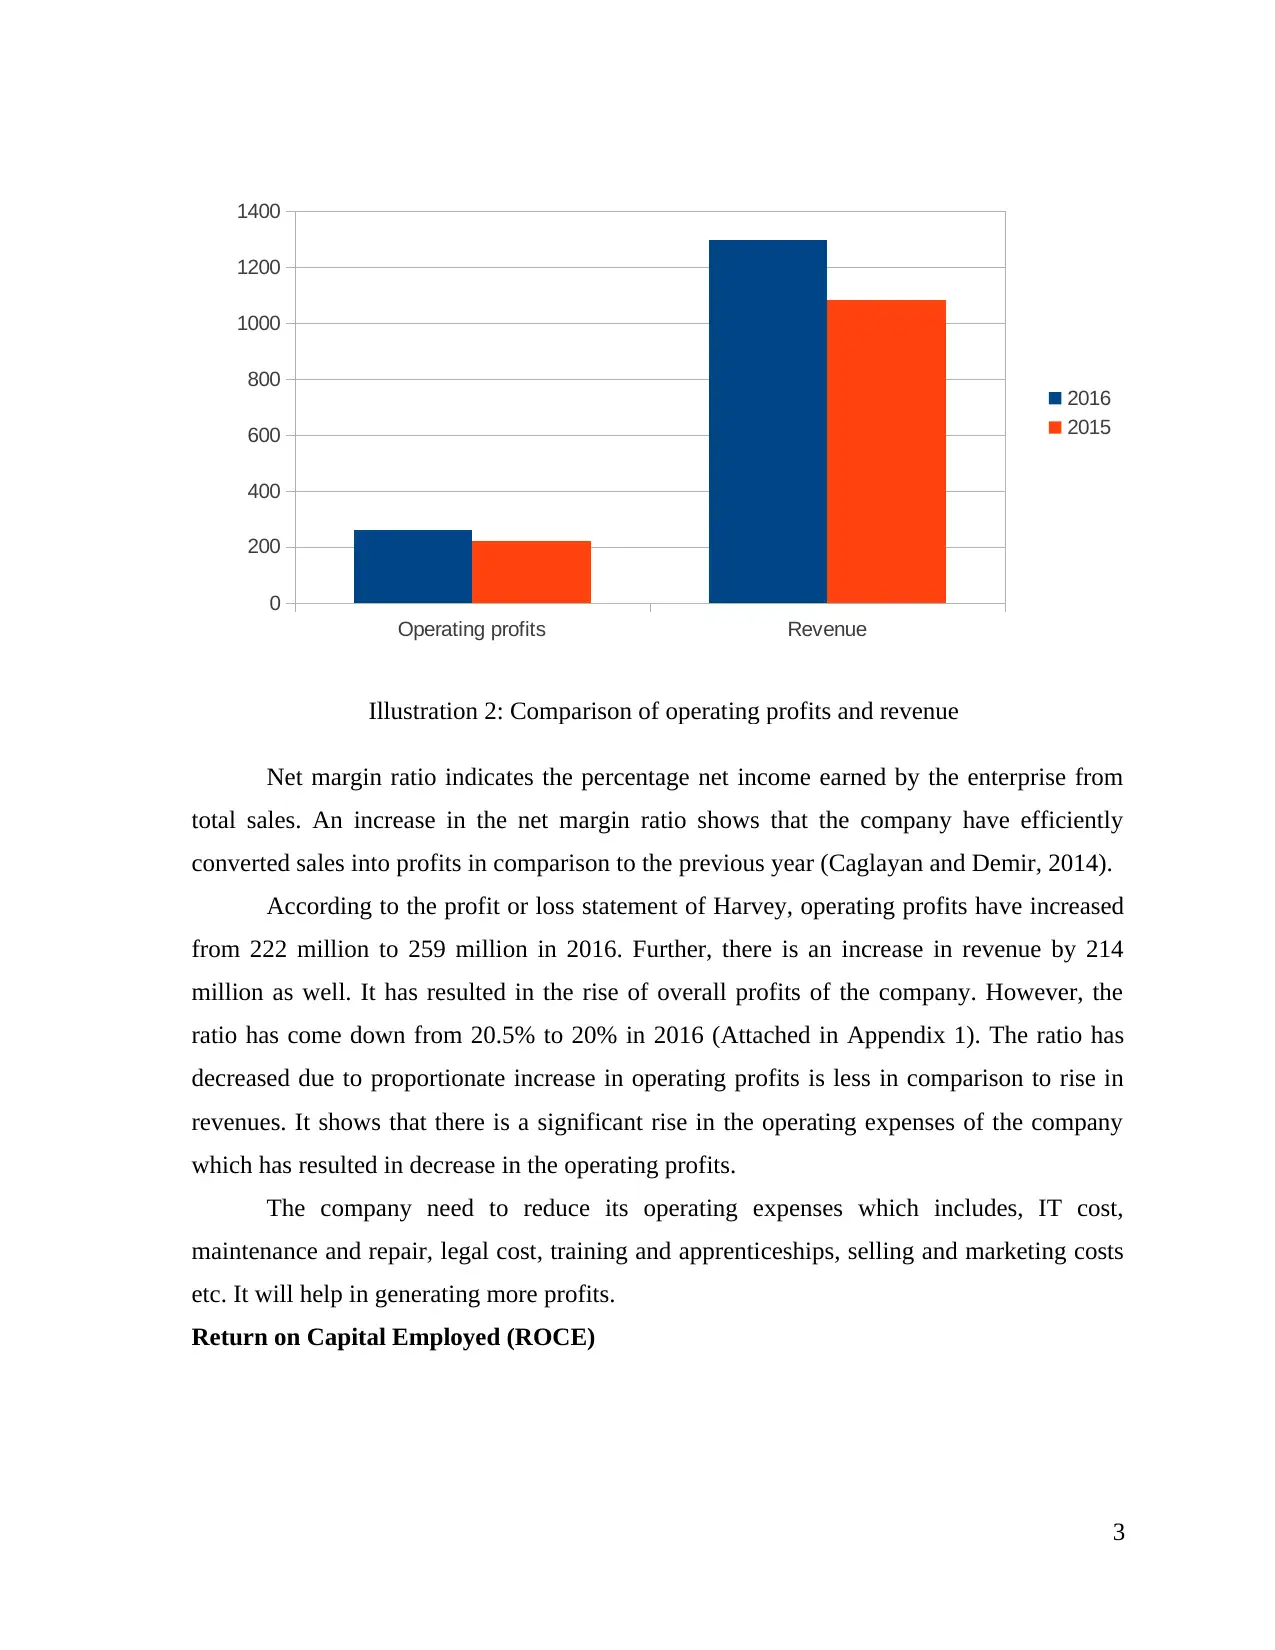
Net margin ratio indicates the percentage net income earned by the enterprise from
total sales. An increase in the net margin ratio shows that the company have efficiently
converted sales into profits in comparison to the previous year (Caglayan and Demir, 2014).
According to the profit or loss statement of Harvey, operating profits have increased
from 222 million to 259 million in 2016. Further, there is an increase in revenue by 214
million as well. It has resulted in the rise of overall profits of the company. However, the
ratio has come down from 20.5% to 20% in 2016 (Attached in Appendix 1). The ratio has
decreased due to proportionate increase in operating profits is less in comparison to rise in
revenues. It shows that there is a significant rise in the operating expenses of the company
which has resulted in decrease in the operating profits.
The company need to reduce its operating expenses which includes, IT cost,
maintenance and repair, legal cost, training and apprenticeships, selling and marketing costs
etc. It will help in generating more profits.
Return on Capital Employed (ROCE)
3
0
200
400
600
800
1000
1200
1400
2016
2015
Illustration 2: Comparison of operating profits and revenue
Net margin ratio indicates the percentage net income earned by the enterprise from
total sales. An increase in the net margin ratio shows that the company have efficiently
converted sales into profits in comparison to the previous year (Caglayan and Demir, 2014).
According to the profit or loss statement of Harvey, operating profits have increased
from 222 million to 259 million in 2016. Further, there is an increase in revenue by 214
million as well. It has resulted in the rise of overall profits of the company. However, the
ratio has come down from 20.5% to 20% in 2016 (Attached in Appendix 1). The ratio has
decreased due to proportionate increase in operating profits is less in comparison to rise in
revenues. It shows that there is a significant rise in the operating expenses of the company
which has resulted in decrease in the operating profits.
The company need to reduce its operating expenses which includes, IT cost,
maintenance and repair, legal cost, training and apprenticeships, selling and marketing costs
etc. It will help in generating more profits.
Return on Capital Employed (ROCE)
3
Operating profits Capital employed
0
200
400
600
800
1000
1200
1400
1600
2016
2015
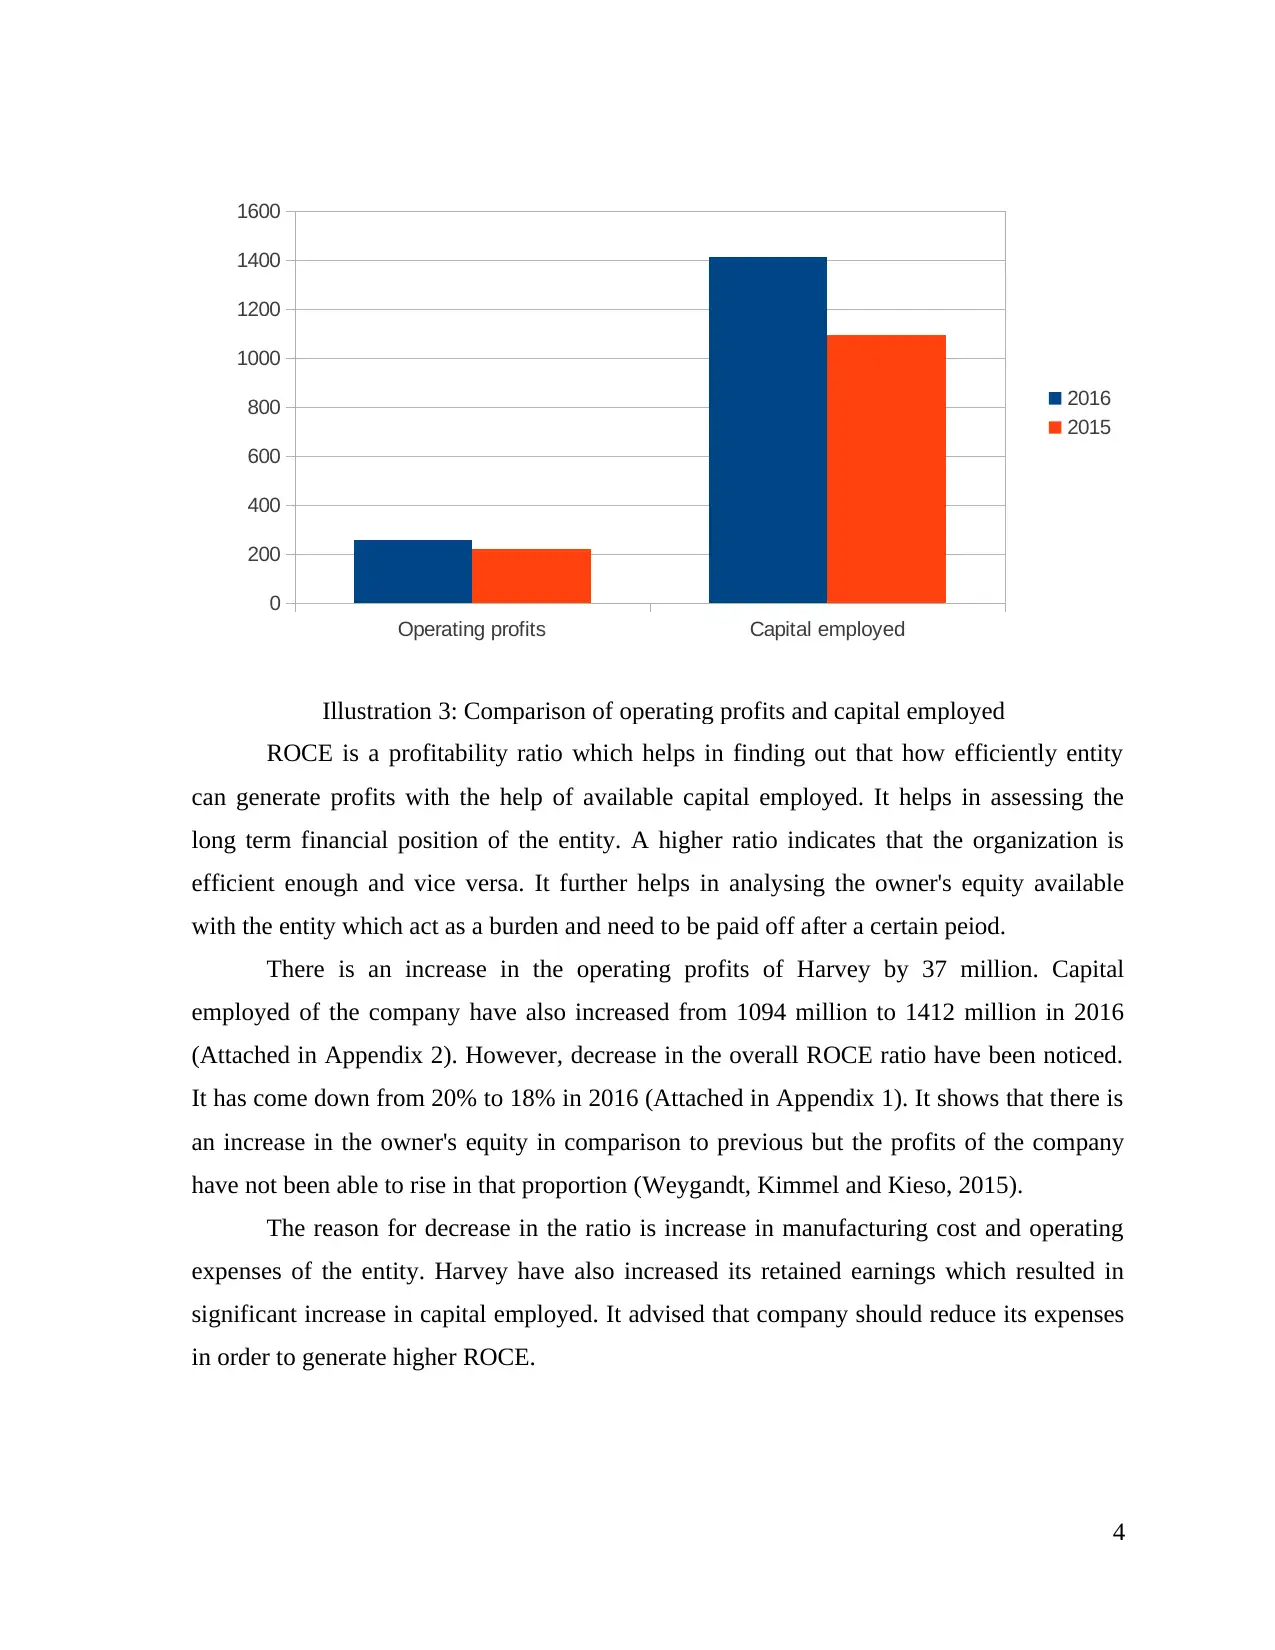
Illustration 3: Comparison of operating profits and capital employed
ROCE is a profitability ratio which helps in finding out that how efficiently entity
can generate profits with the help of available capital employed. It helps in assessing the
long term financial position of the entity. A higher ratio indicates that the organization is
efficient enough and vice versa. It further helps in analysing the owner's equity available
with the entity which act as a burden and need to be paid off after a certain peiod.
There is an increase in the operating profits of Harvey by 37 million. Capital
employed of the company have also increased from 1094 million to 1412 million in 2016
(Attached in Appendix 2). However, decrease in the overall ROCE ratio have been noticed.
It has come down from 20% to 18% in 2016 (Attached in Appendix 1). It shows that there is
an increase in the owner's equity in comparison to previous but the profits of the company
have not been able to rise in that proportion (Weygandt, Kimmel and Kieso, 2015).
The reason for decrease in the ratio is increase in manufacturing cost and operating
expenses of the entity. Harvey have also increased its retained earnings which resulted in
significant increase in capital employed. It advised that company should reduce its expenses
in order to generate higher ROCE.
4
0
200
400
600
800
1000
1200
1400
1600
2016
2015
Illustration 3: Comparison of operating profits and capital employed
ROCE is a profitability ratio which helps in finding out that how efficiently entity
can generate profits with the help of available capital employed. It helps in assessing the
long term financial position of the entity. A higher ratio indicates that the organization is
efficient enough and vice versa. It further helps in analysing the owner's equity available
with the entity which act as a burden and need to be paid off after a certain peiod.
There is an increase in the operating profits of Harvey by 37 million. Capital
employed of the company have also increased from 1094 million to 1412 million in 2016
(Attached in Appendix 2). However, decrease in the overall ROCE ratio have been noticed.
It has come down from 20% to 18% in 2016 (Attached in Appendix 1). It shows that there is
an increase in the owner's equity in comparison to previous but the profits of the company
have not been able to rise in that proportion (Weygandt, Kimmel and Kieso, 2015).
The reason for decrease in the ratio is increase in manufacturing cost and operating
expenses of the entity. Harvey have also increased its retained earnings which resulted in
significant increase in capital employed. It advised that company should reduce its expenses
in order to generate higher ROCE.
4
Paraphrase This Document
Need a fresh take? Get an instant paraphrase of this document with our AI Paraphraser
Financial position analysis
The financial position of the company is calculated of the basis of their assets and
liabilities as well as it also includes shareholders equity. To understand the value if the
venture, different investor looks at the organisation's financial position. It can be analysed by
evaluating the different financial ratio of the company. It is the mathematical comparison of
the financial statement categories and accounts. It helps the company's different stakeholders
such as their creditors, shareholders, investors, customers, suppliers as well as it helps the
organisation manage their company internally that how the business is performing and where
it need improvements. Financial ratios are the tool which is used to find the business
standing and if it is compared to past years, the firm can able to know that they are at the
growing stage or not (Caglayan and Demir, 2014). Different financial ratios are as follows:
Liquidity ratio
It helps the organisation to find that they are able to pay their both current liabilities
and their long-term liabilities which has further become the current liabilities. These ratios
communicate the cash level of the venture and how they can turn their recentre assets to pay
of their liabilities. It shows the ability of the organisation to easily convert their assets into
cash. It includes different ratio, that are as follows:
Current ratio: It shows the ability of the company to pay the current liabilities from their
current assets. Quick assets are that which is converted into cash within the 90 working days
such as cash, cash equivalents, marketable securities and short run investments. Formula for
calculating the current ratio is current assets by current liabilities.
Current ratio of Harvey Homes Plc
For 2015
1500+ 39+ 56/ 60+ 471+ 19 = 1595/500 = 3.19 :1
For 2016
1808+36+135/ 44+566+24 = 1979/634 = 2.9 :1
5
1 2
2.75
2.8
2.85
2.9
2.95
3
3.05
3.1
3.15
Current ratio
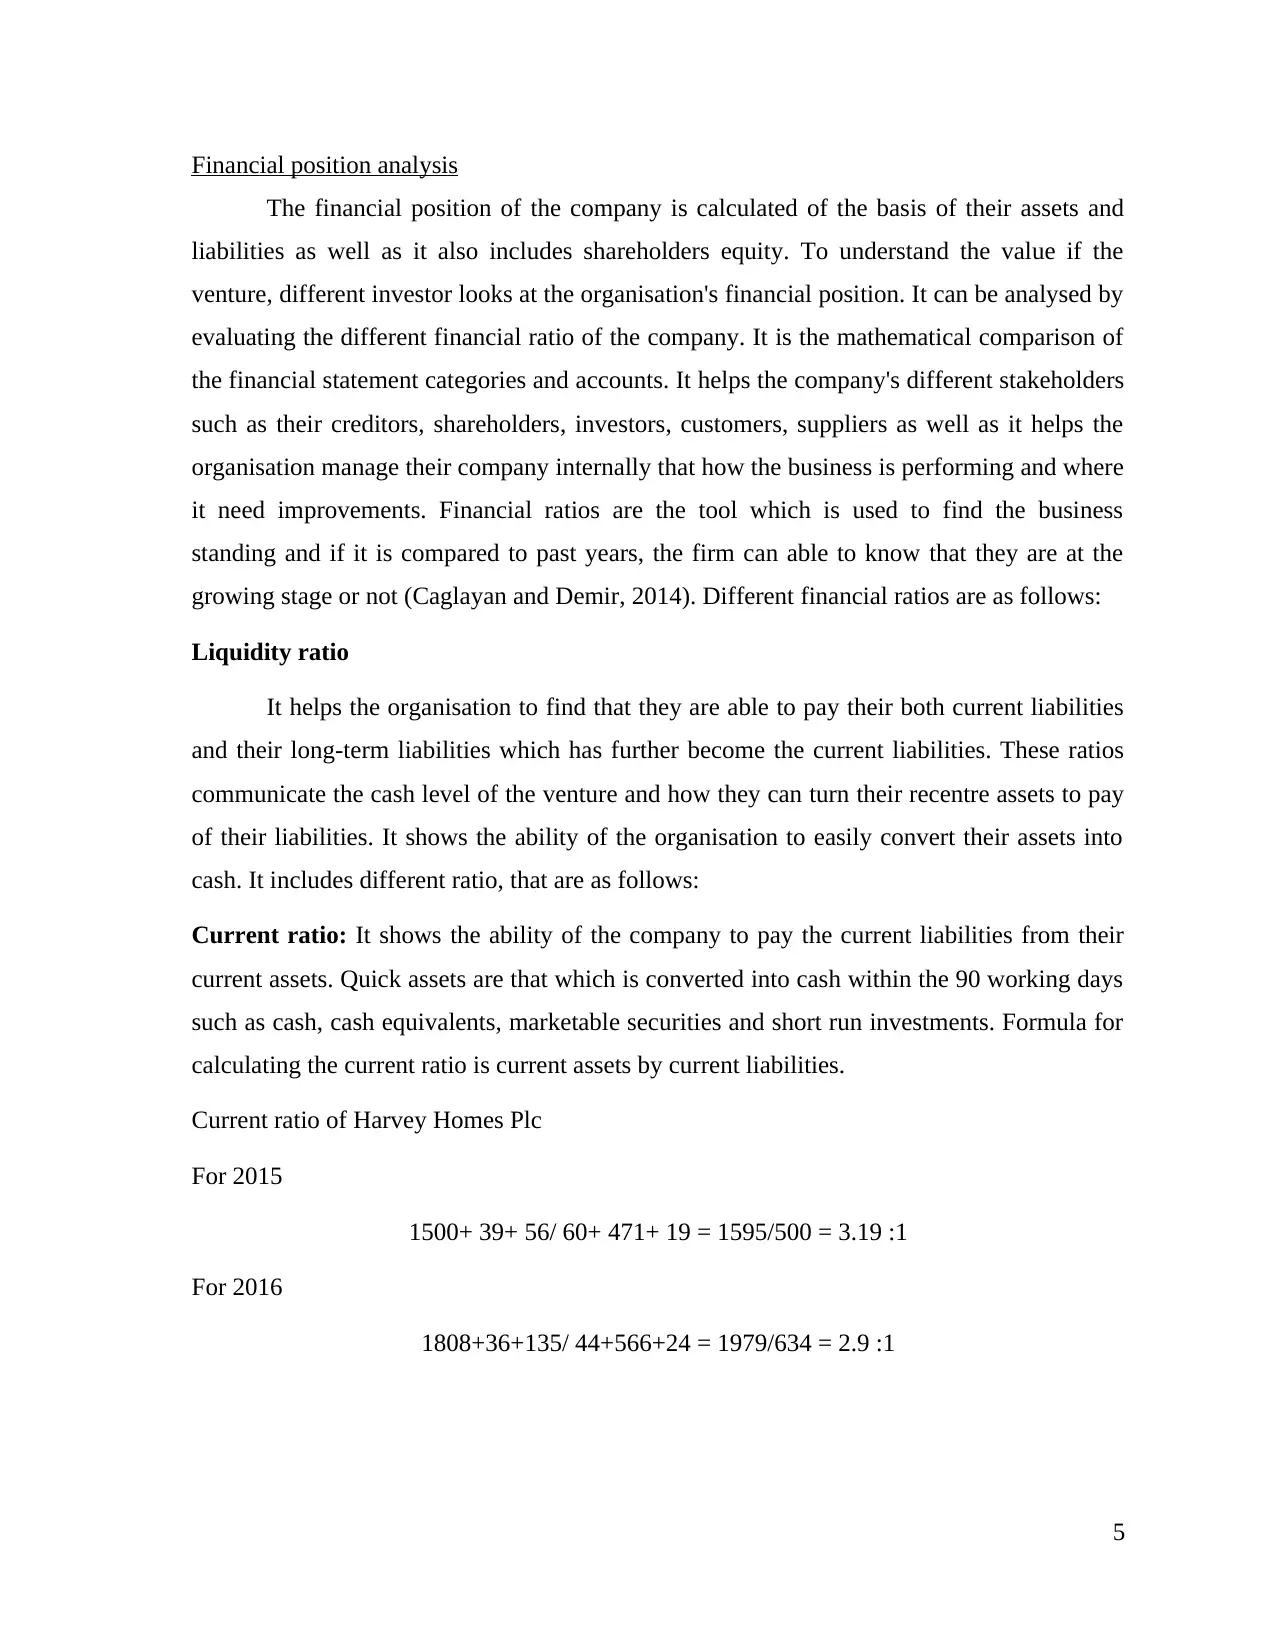
Illustration 4: Current ratio of Harvey Homes Plc
The ideal ratio for the current ratio is 2: 1 and in case of the Harvey Homes Plc in
2015 it was 3.19 :1 and in 2016, it is 3.12 :1 which state that it has been reduces. As their
current assets in 2015 were 1595 and liabilities was 500 whereas the current assets have been
increase in 2016 up to 1979 which is good sign for the organisation but with that their
liabilities have also increased that is 634. So, they need to pay their liabilities with the help
of assets. Al over the company's liquidity is sound and more than its ideal ratio. 1 denotes the
year 2015 and two denotes the year 2016 (Weygandt, Kimmel and Kieso, 2015).
Quick ratio: In the current ratio, there is one drawback that is inventory is included many
times so that is difficult to liquidate frequently that may have uncertain liquidation values.
So, the quick ratio is the alternative of that drawback. The formula to calculate is current
assets minus inventory divided by current liabilities
For 2015
1595-1500/ 550= 0.26: 1
For 2016
1,979-1,808/634=0.17: 1
6
2.75
2.8
2.85
2.9
2.95
3
3.05
3.1
3.15
Current ratio
Illustration 4: Current ratio of Harvey Homes Plc
The ideal ratio for the current ratio is 2: 1 and in case of the Harvey Homes Plc in
2015 it was 3.19 :1 and in 2016, it is 3.12 :1 which state that it has been reduces. As their
current assets in 2015 were 1595 and liabilities was 500 whereas the current assets have been
increase in 2016 up to 1979 which is good sign for the organisation but with that their
liabilities have also increased that is 634. So, they need to pay their liabilities with the help
of assets. Al over the company's liquidity is sound and more than its ideal ratio. 1 denotes the
year 2015 and two denotes the year 2016 (Weygandt, Kimmel and Kieso, 2015).
Quick ratio: In the current ratio, there is one drawback that is inventory is included many
times so that is difficult to liquidate frequently that may have uncertain liquidation values.
So, the quick ratio is the alternative of that drawback. The formula to calculate is current
assets minus inventory divided by current liabilities
For 2015
1595-1500/ 550= 0.26: 1
For 2016
1,979-1,808/634=0.17: 1
6
1 2
0
0.05
0.1
0.15
0.2
0.25
0.3
Quick ratio
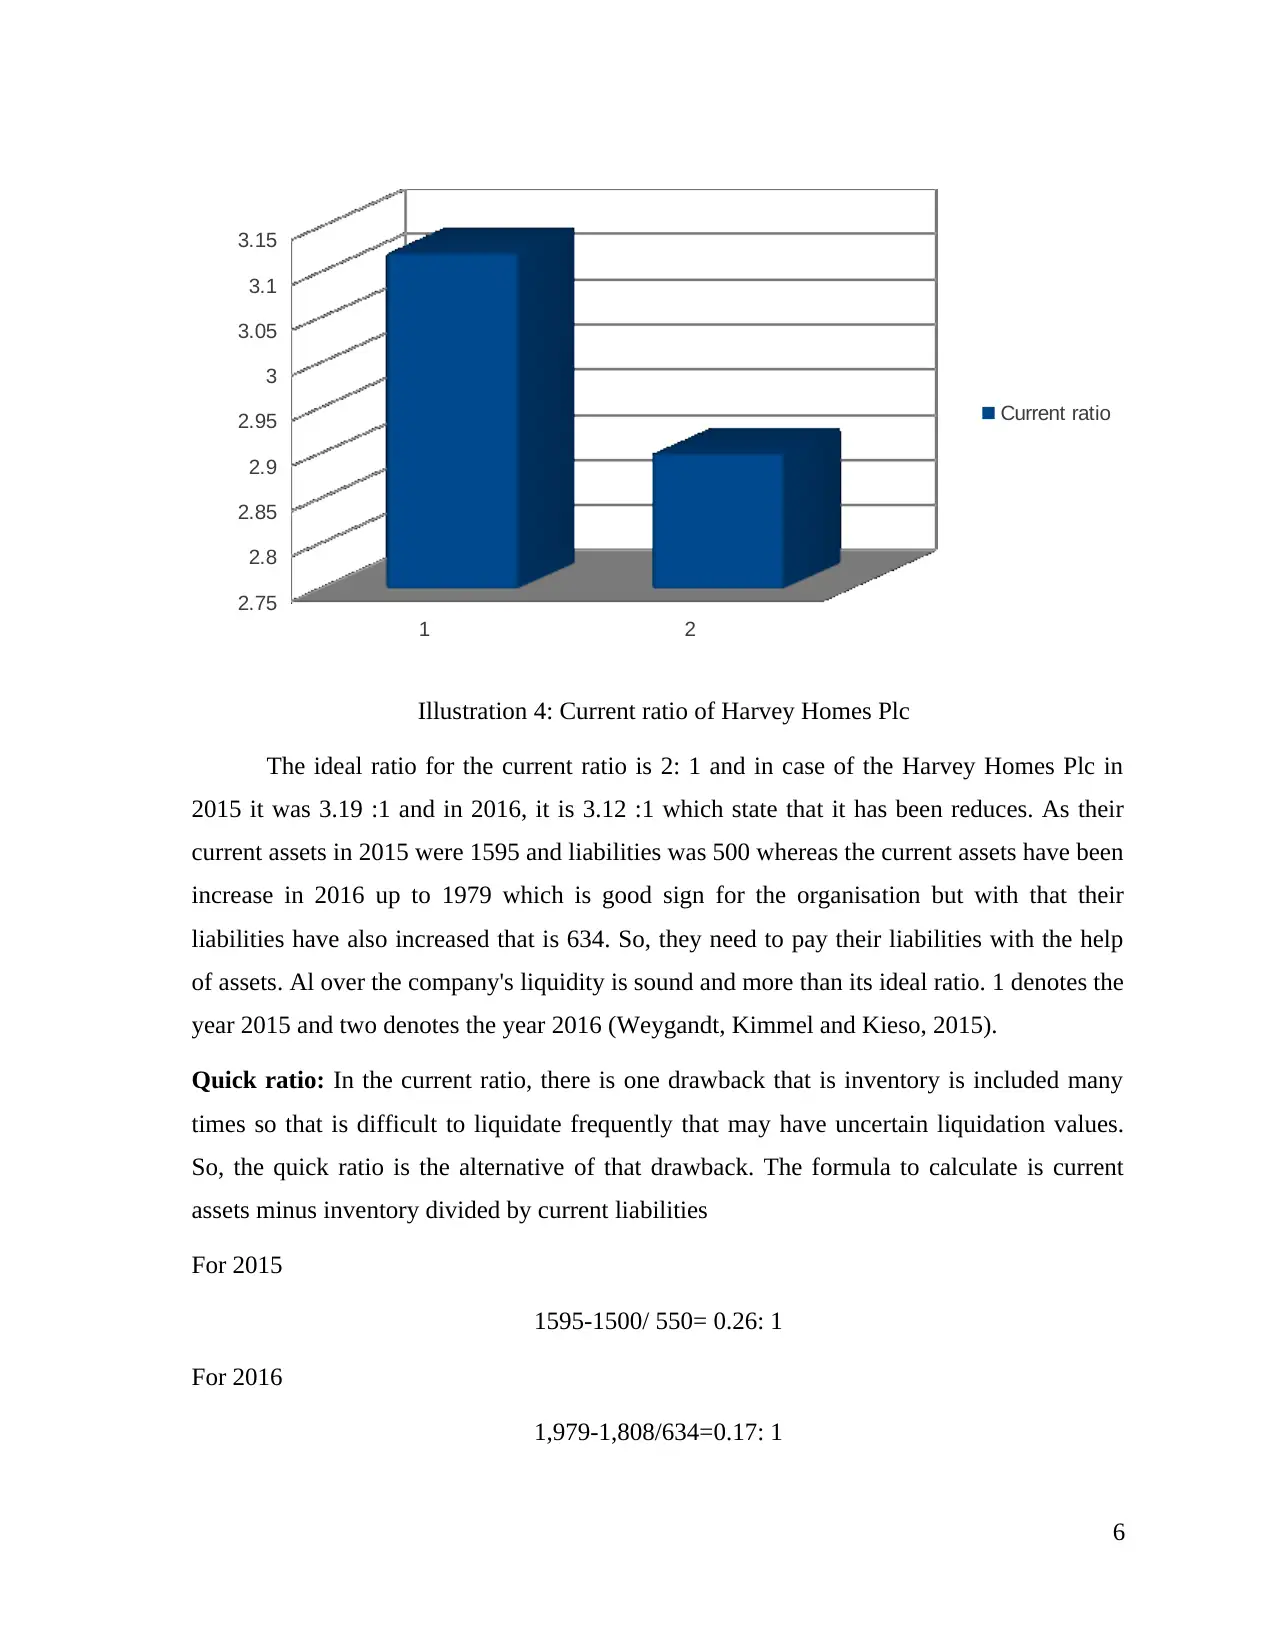
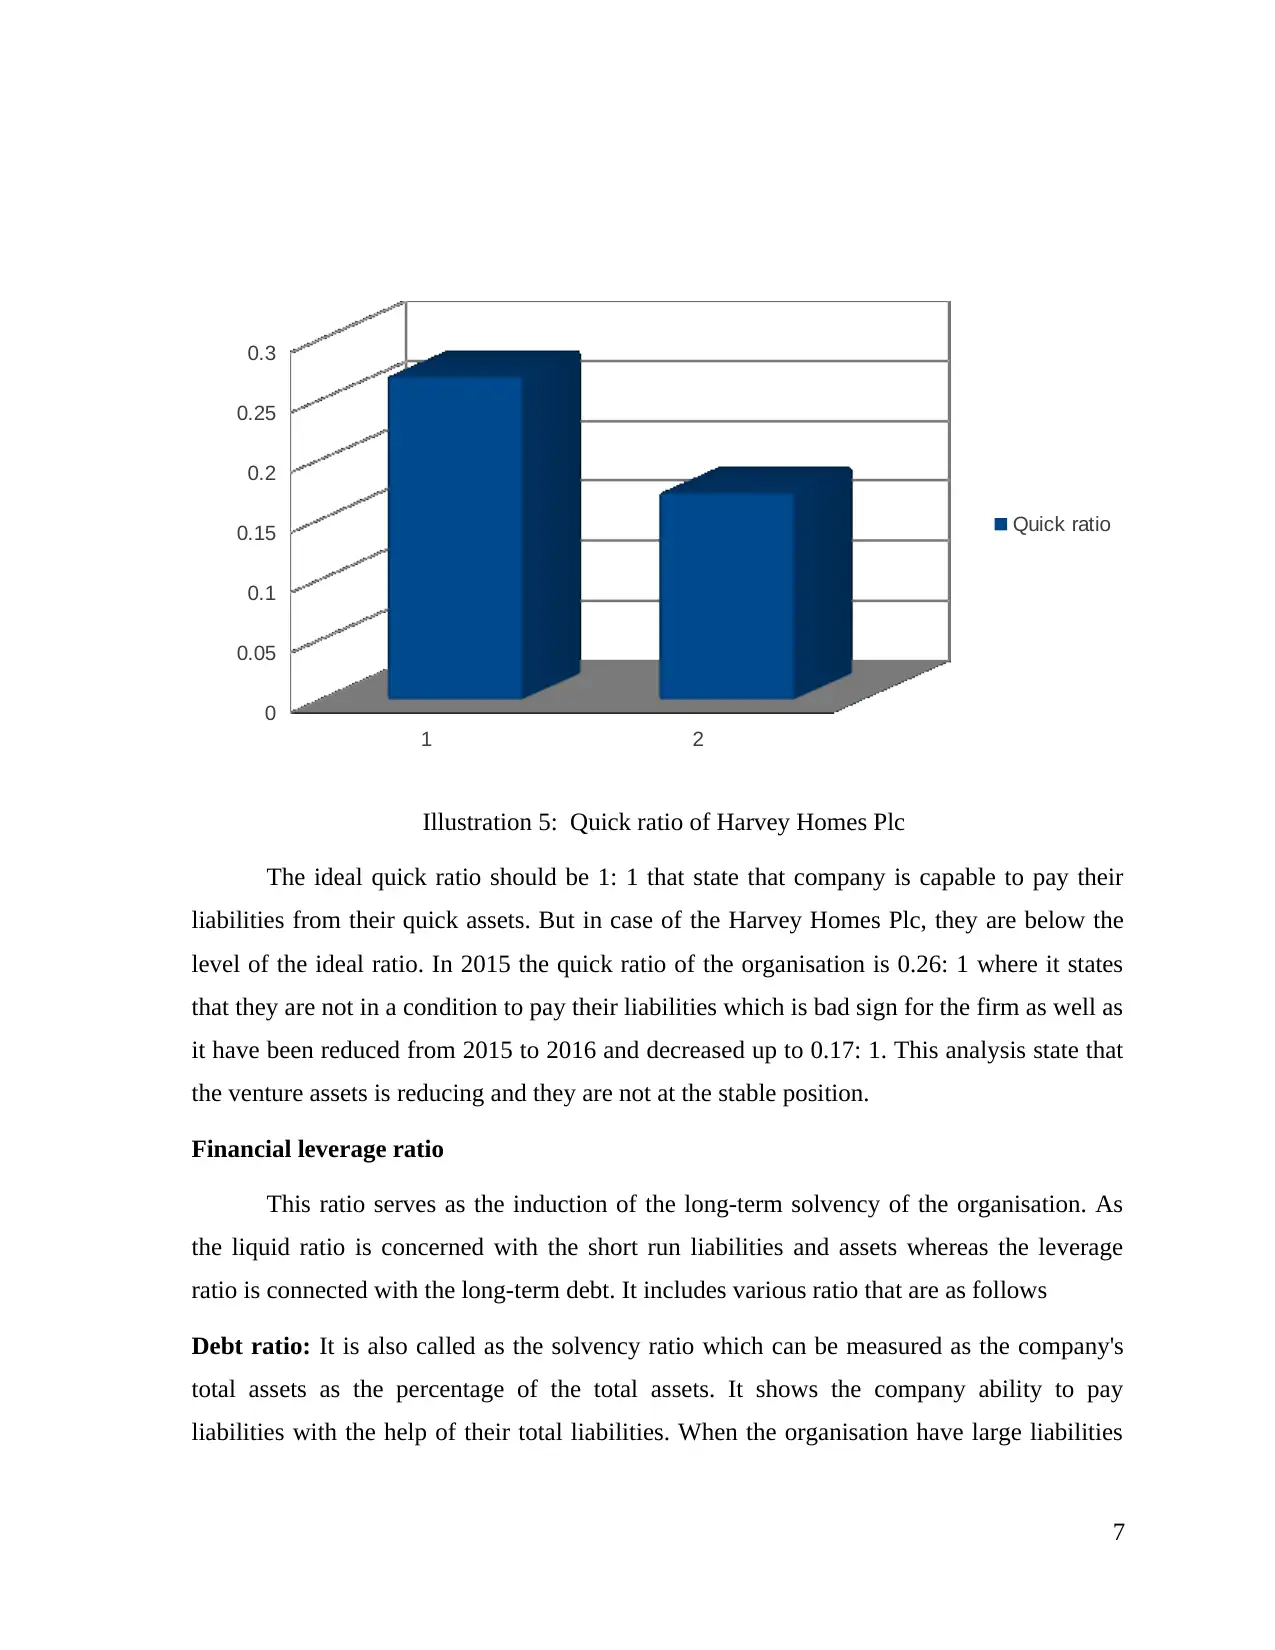
Illustration 5: Quick ratio of Harvey Homes Plc
The ideal quick ratio should be 1: 1 that state that company is capable to pay their
liabilities from their quick assets. But in case of the Harvey Homes Plc, they are below the
level of the ideal ratio. In 2015 the quick ratio of the organisation is 0.26: 1 where it states
that they are not in a condition to pay their liabilities which is bad sign for the firm as well as
it have been reduced from 2015 to 2016 and decreased up to 0.17: 1. This analysis state that
the venture assets is reducing and they are not at the stable position.
Financial leverage ratio
This ratio serves as the induction of the long-term solvency of the organisation. As
the liquid ratio is concerned with the short run liabilities and assets whereas the leverage
ratio is connected with the long-term debt. It includes various ratio that are as follows
Debt ratio: It is also called as the solvency ratio which can be measured as the company's
total assets as the percentage of the total assets. It shows the company ability to pay
liabilities with the help of their total liabilities. When the organisation have large liabilities
7
0
0.05
0.1
0.15
0.2
0.25
0.3
Quick ratio
Illustration 5: Quick ratio of Harvey Homes Plc
The ideal quick ratio should be 1: 1 that state that company is capable to pay their
liabilities from their quick assets. But in case of the Harvey Homes Plc, they are below the
level of the ideal ratio. In 2015 the quick ratio of the organisation is 0.26: 1 where it states
that they are not in a condition to pay their liabilities which is bad sign for the firm as well as
it have been reduced from 2015 to 2016 and decreased up to 0.17: 1. This analysis state that
the venture assets is reducing and they are not at the stable position.
Financial leverage ratio
This ratio serves as the induction of the long-term solvency of the organisation. As
the liquid ratio is concerned with the short run liabilities and assets whereas the leverage
ratio is connected with the long-term debt. It includes various ratio that are as follows
Debt ratio: It is also called as the solvency ratio which can be measured as the company's
total assets as the percentage of the total assets. It shows the company ability to pay
liabilities with the help of their total liabilities. When the organisation have large liabilities
7
Secure Best Marks with AI Grader
Need help grading? Try our AI Grader for instant feedback on your assignments.
over their assets that states that the company is at risk stage, it is calculated as the total debt/
total liabilities (Arnold, 2013).
Debt ratio of the Harvey Homes Plc
2015
1,644/795= 2.06: 1
2016
2046 /1,029= 1.98: 1
1 2
1.94
1.96
1.98
2
2.02
2.04
2.06
2.08
Debt ratio
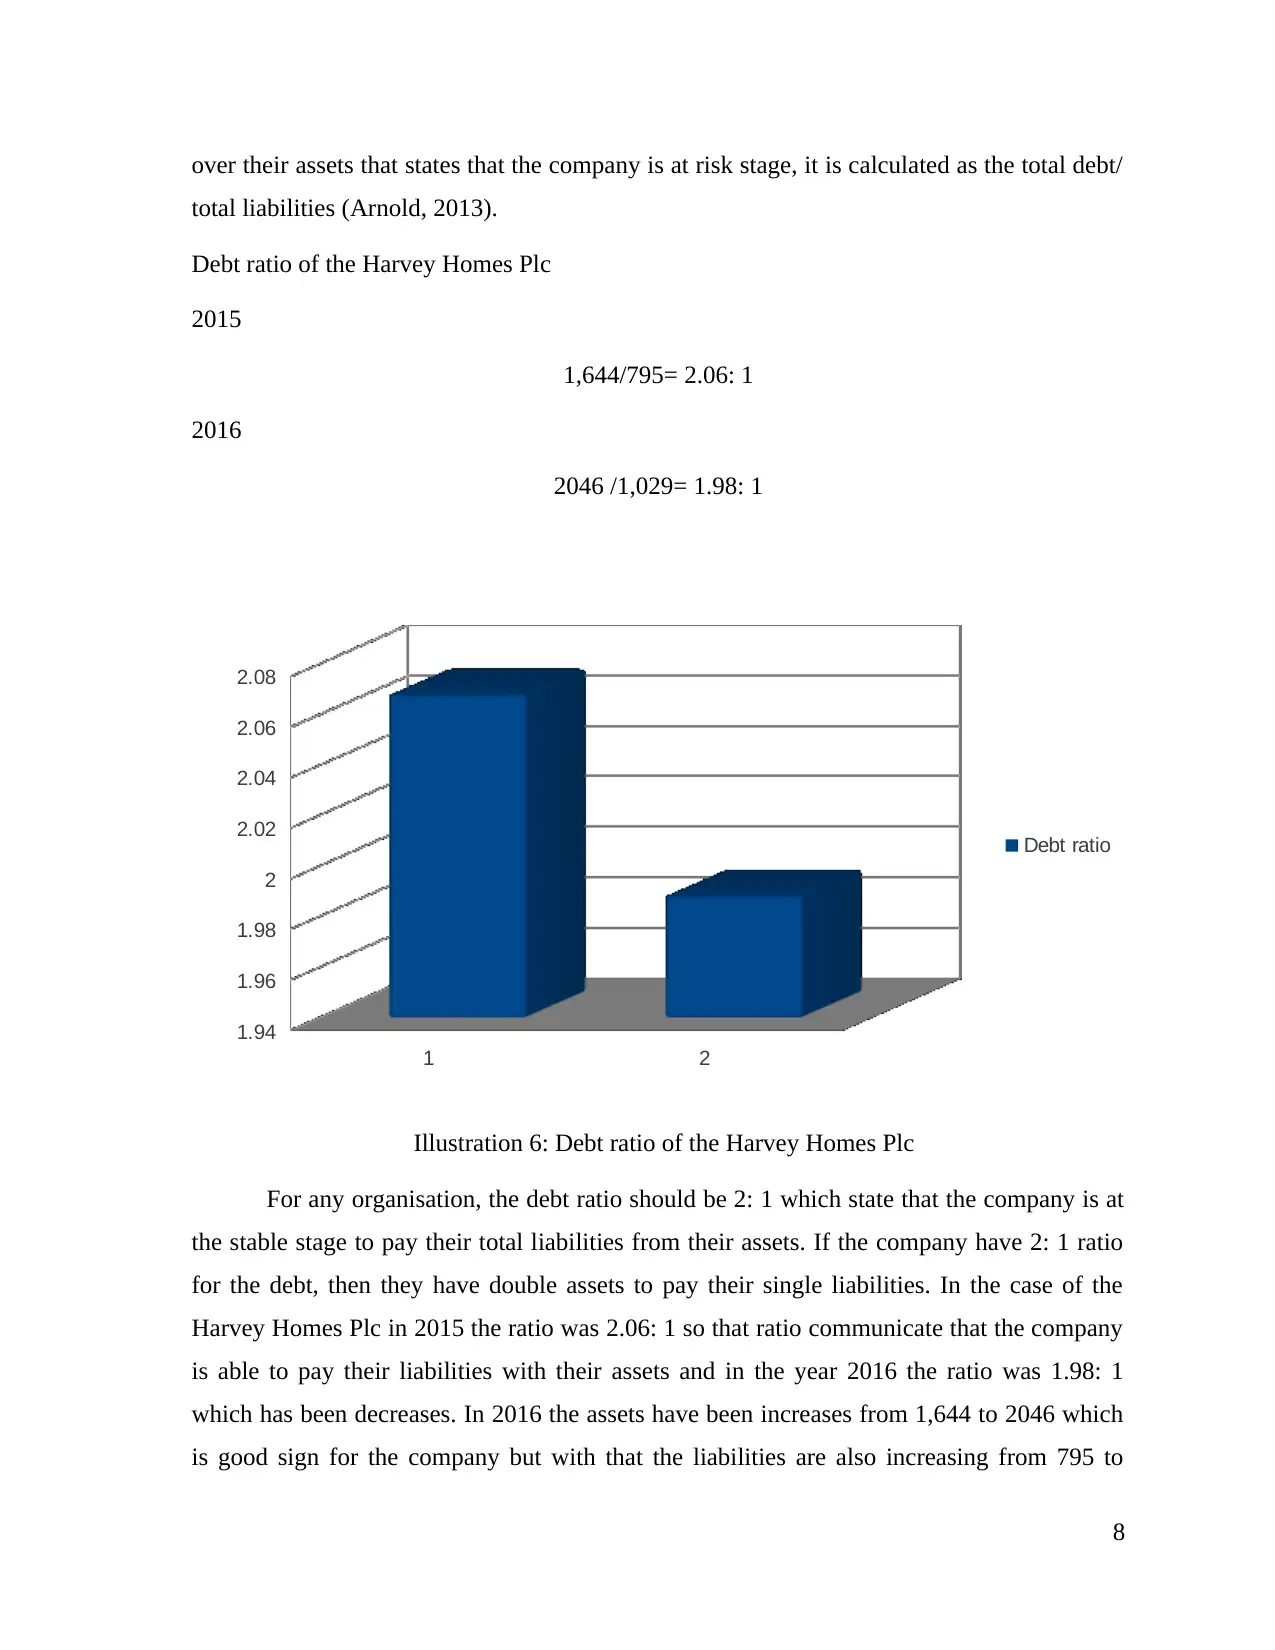
Illustration 6: Debt ratio of the Harvey Homes Plc
For any organisation, the debt ratio should be 2: 1 which state that the company is at
the stable stage to pay their total liabilities from their assets. If the company have 2: 1 ratio
for the debt, then they have double assets to pay their single liabilities. In the case of the
Harvey Homes Plc in 2015 the ratio was 2.06: 1 so that ratio communicate that the company
is able to pay their liabilities with their assets and in the year 2016 the ratio was 1.98: 1
which has been decreases. In 2016 the assets have been increases from 1,644 to 2046 which
is good sign for the company but with that the liabilities are also increasing from 795 to
8
total liabilities (Arnold, 2013).
Debt ratio of the Harvey Homes Plc
2015
1,644/795= 2.06: 1
2016
2046 /1,029= 1.98: 1
1 2
1.94
1.96
1.98
2
2.02
2.04
2.06
2.08
Debt ratio
Illustration 6: Debt ratio of the Harvey Homes Plc
For any organisation, the debt ratio should be 2: 1 which state that the company is at
the stable stage to pay their total liabilities from their assets. If the company have 2: 1 ratio
for the debt, then they have double assets to pay their single liabilities. In the case of the
Harvey Homes Plc in 2015 the ratio was 2.06: 1 so that ratio communicate that the company
is able to pay their liabilities with their assets and in the year 2016 the ratio was 1.98: 1
which has been decreases. In 2016 the assets have been increases from 1,644 to 2046 which
is good sign for the company but with that the liabilities are also increasing from 795 to
8
1,029. So, they need to make that organisation such sound that the can able to increase their
assets so that they can able to pay increasing liabilities.
Analysis of cash flow statement
Cash flow from operating activities
Cash flow from investing activities
Cash flow from financing activities
-50
0
50
100
150
200
Cash flows
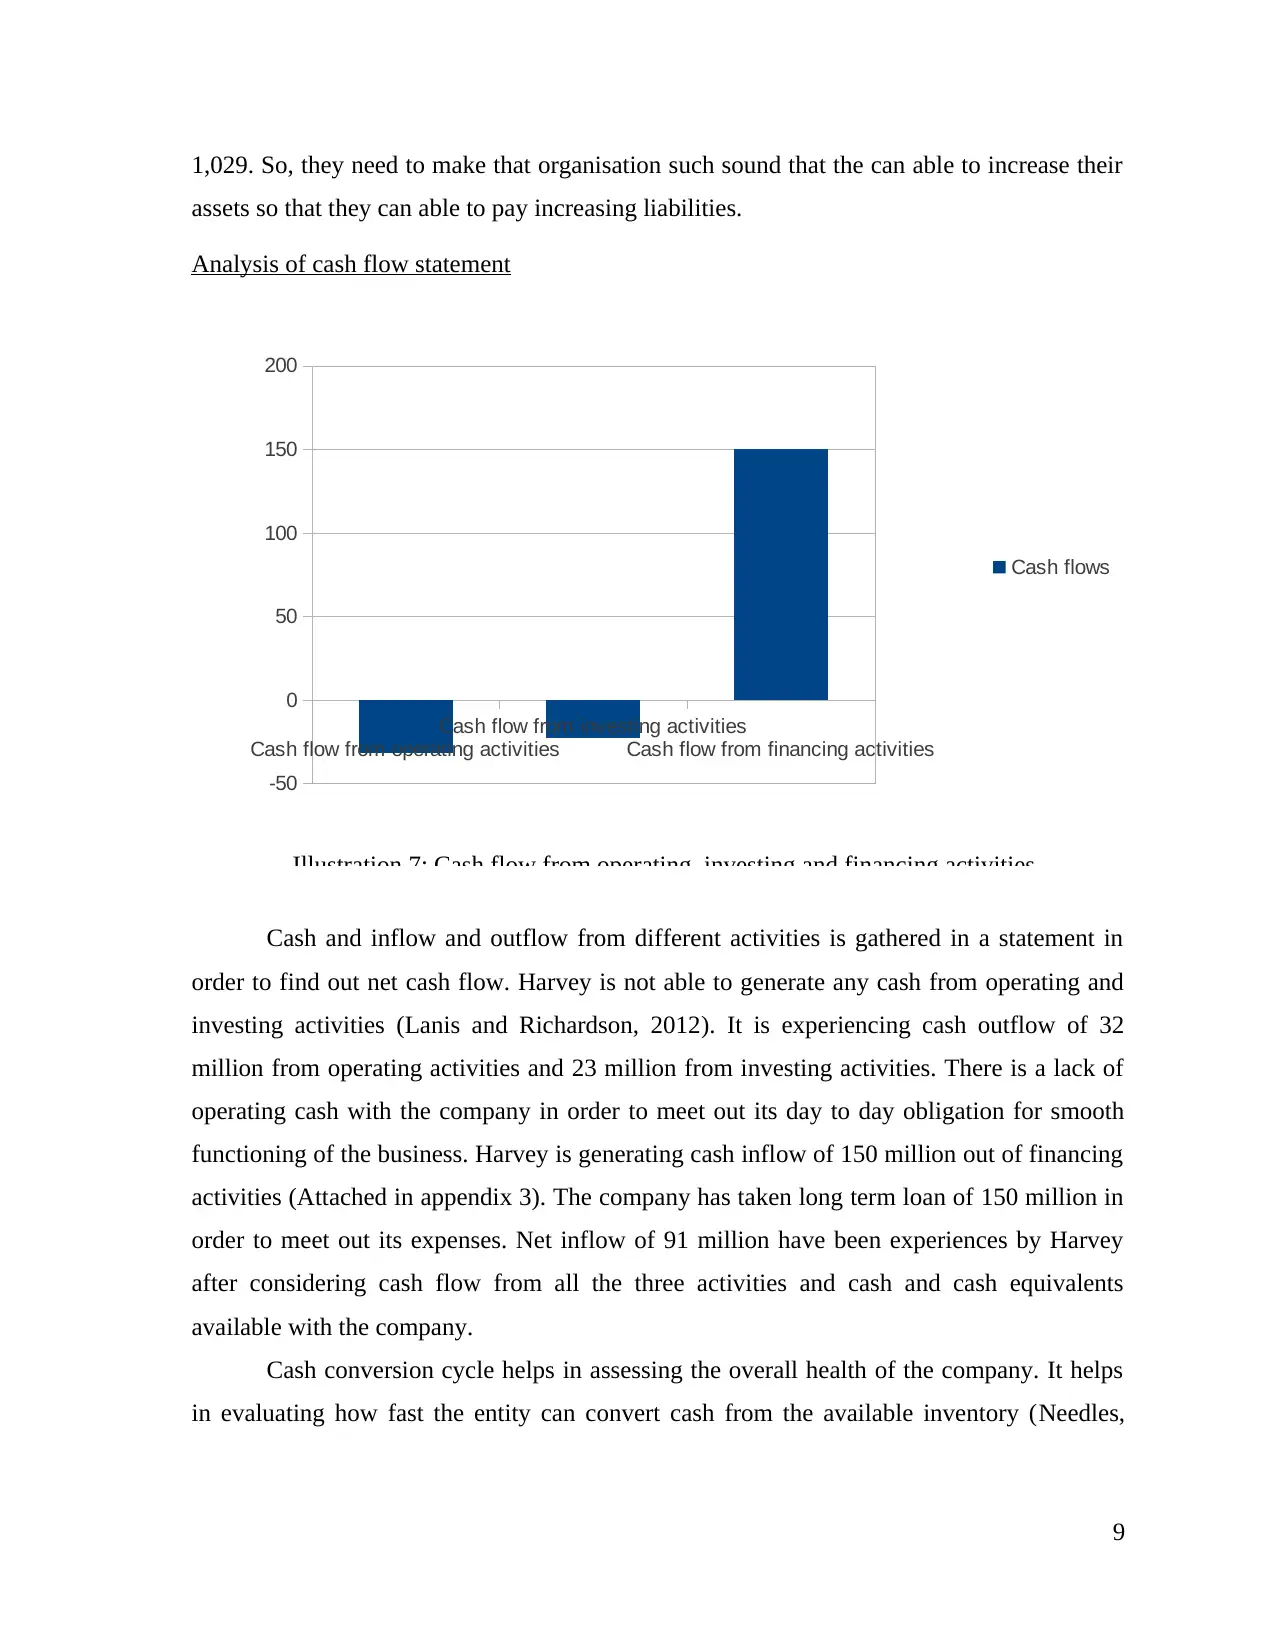
Illustration 7: Cash flow from operating, investing and financing activities
Cash and inflow and outflow from different activities is gathered in a statement in
order to find out net cash flow. Harvey is not able to generate any cash from operating and
investing activities (Lanis and Richardson, 2012). It is experiencing cash outflow of 32
million from operating activities and 23 million from investing activities. There is a lack of
operating cash with the company in order to meet out its day to day obligation for smooth
functioning of the business. Harvey is generating cash inflow of 150 million out of financing
activities (Attached in appendix 3). The company has taken long term loan of 150 million in
order to meet out its expenses. Net inflow of 91 million have been experiences by Harvey
after considering cash flow from all the three activities and cash and cash equivalents
available with the company.
Cash conversion cycle helps in assessing the overall health of the company. It helps
in evaluating how fast the entity can convert cash from the available inventory (Needles,
9
assets so that they can able to pay increasing liabilities.
Analysis of cash flow statement
Cash flow from operating activities
Cash flow from investing activities
Cash flow from financing activities
-50
0
50
100
150
200
Cash flows
Illustration 7: Cash flow from operating, investing and financing activities
Cash and inflow and outflow from different activities is gathered in a statement in
order to find out net cash flow. Harvey is not able to generate any cash from operating and
investing activities (Lanis and Richardson, 2012). It is experiencing cash outflow of 32
million from operating activities and 23 million from investing activities. There is a lack of
operating cash with the company in order to meet out its day to day obligation for smooth
functioning of the business. Harvey is generating cash inflow of 150 million out of financing
activities (Attached in appendix 3). The company has taken long term loan of 150 million in
order to meet out its expenses. Net inflow of 91 million have been experiences by Harvey
after considering cash flow from all the three activities and cash and cash equivalents
available with the company.
Cash conversion cycle helps in assessing the overall health of the company. It helps
in evaluating how fast the entity can convert cash from the available inventory (Needles,
9
Powers and Crosson, 2013). The formula used to calculate cash conversion cycle is as
follows:
Cash conversion cycle = Days inventory outstanding + Days sales outstanding - Days
payable outstanding
Cash conversion cycle
473
474
475
476
477
478
479
480
481
482
2016
2015
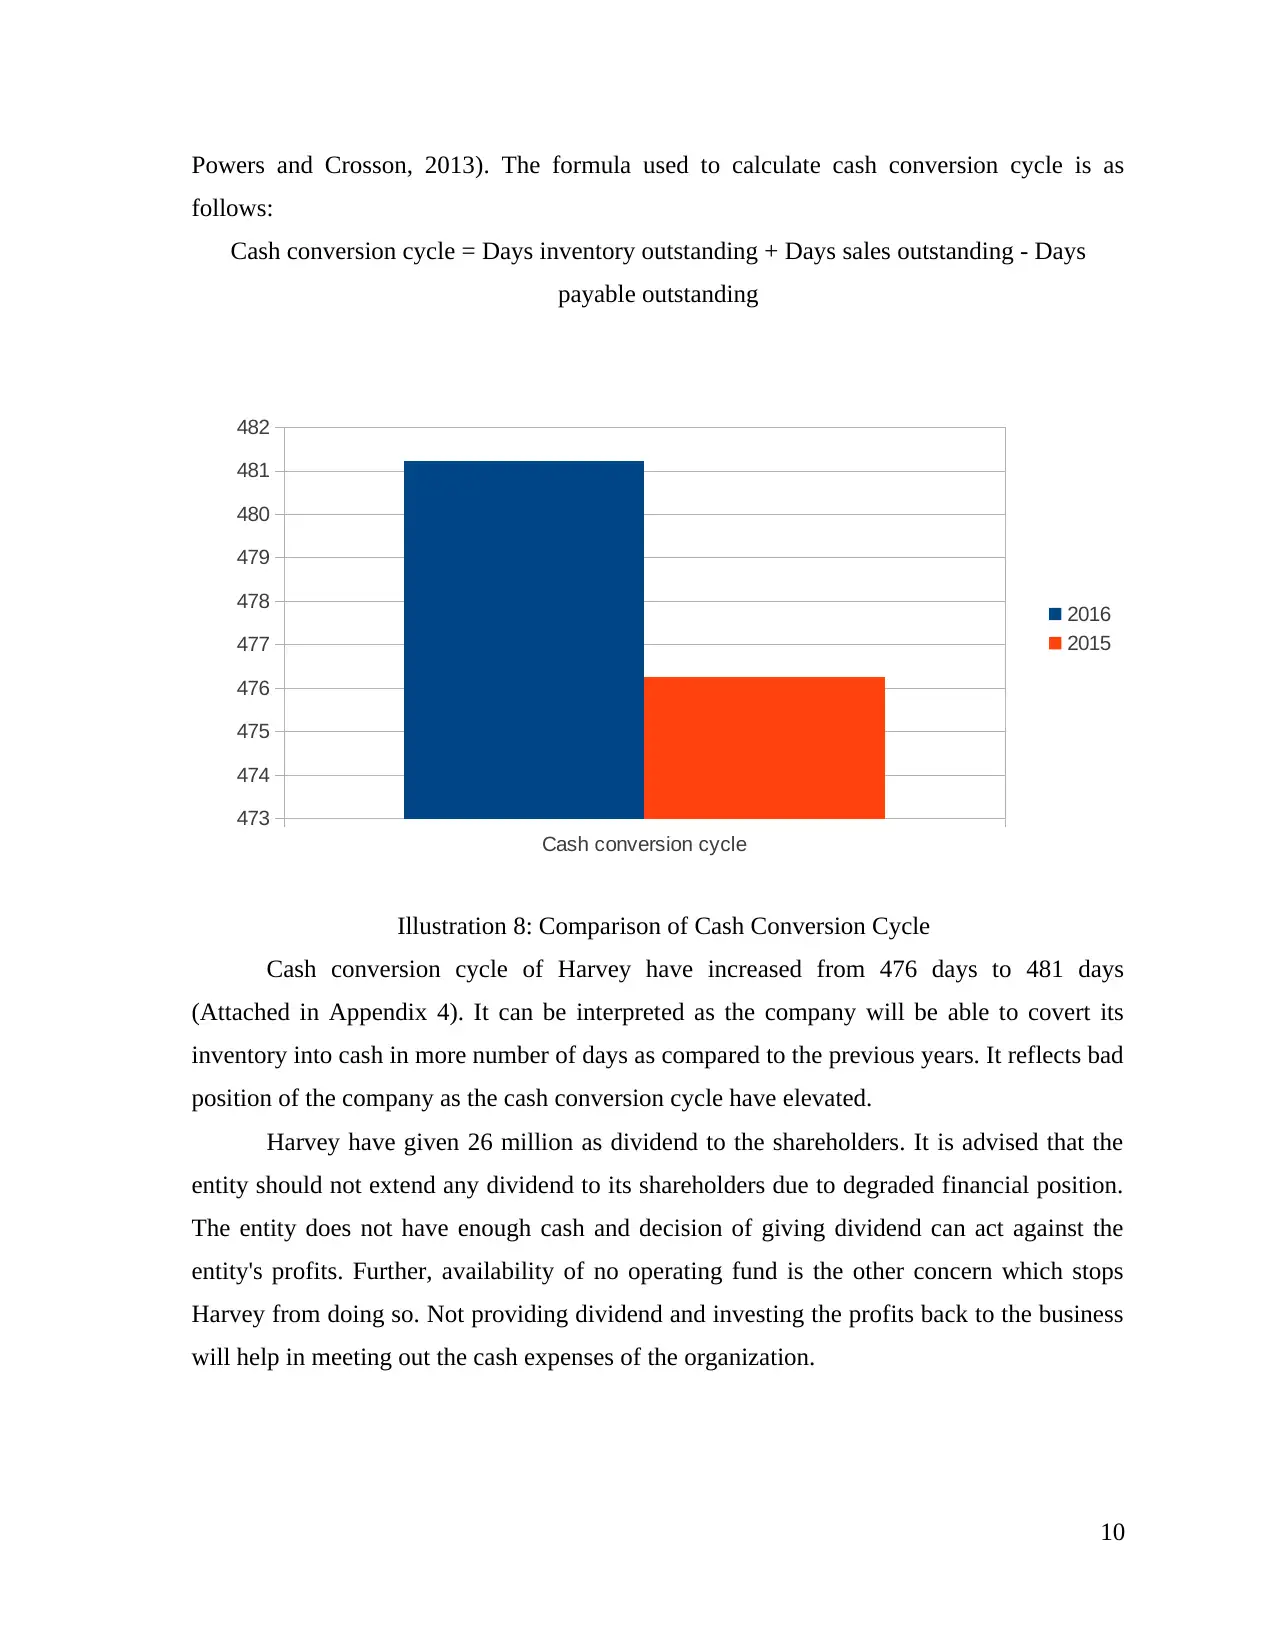
Illustration 8: Comparison of Cash Conversion Cycle
Cash conversion cycle of Harvey have increased from 476 days to 481 days
(Attached in Appendix 4). It can be interpreted as the company will be able to covert its
inventory into cash in more number of days as compared to the previous years. It reflects bad
position of the company as the cash conversion cycle have elevated.
Harvey have given 26 million as dividend to the shareholders. It is advised that the
entity should not extend any dividend to its shareholders due to degraded financial position.
The entity does not have enough cash and decision of giving dividend can act against the
entity's profits. Further, availability of no operating fund is the other concern which stops
Harvey from doing so. Not providing dividend and investing the profits back to the business
will help in meeting out the cash expenses of the organization.
10
follows:
Cash conversion cycle = Days inventory outstanding + Days sales outstanding - Days
payable outstanding
Cash conversion cycle
473
474
475
476
477
478
479
480
481
482
2016
2015
Illustration 8: Comparison of Cash Conversion Cycle
Cash conversion cycle of Harvey have increased from 476 days to 481 days
(Attached in Appendix 4). It can be interpreted as the company will be able to covert its
inventory into cash in more number of days as compared to the previous years. It reflects bad
position of the company as the cash conversion cycle have elevated.
Harvey have given 26 million as dividend to the shareholders. It is advised that the
entity should not extend any dividend to its shareholders due to degraded financial position.
The entity does not have enough cash and decision of giving dividend can act against the
entity's profits. Further, availability of no operating fund is the other concern which stops
Harvey from doing so. Not providing dividend and investing the profits back to the business
will help in meeting out the cash expenses of the organization.
10
Paraphrase This Document
Need a fresh take? Get an instant paraphrase of this document with our AI Paraphraser
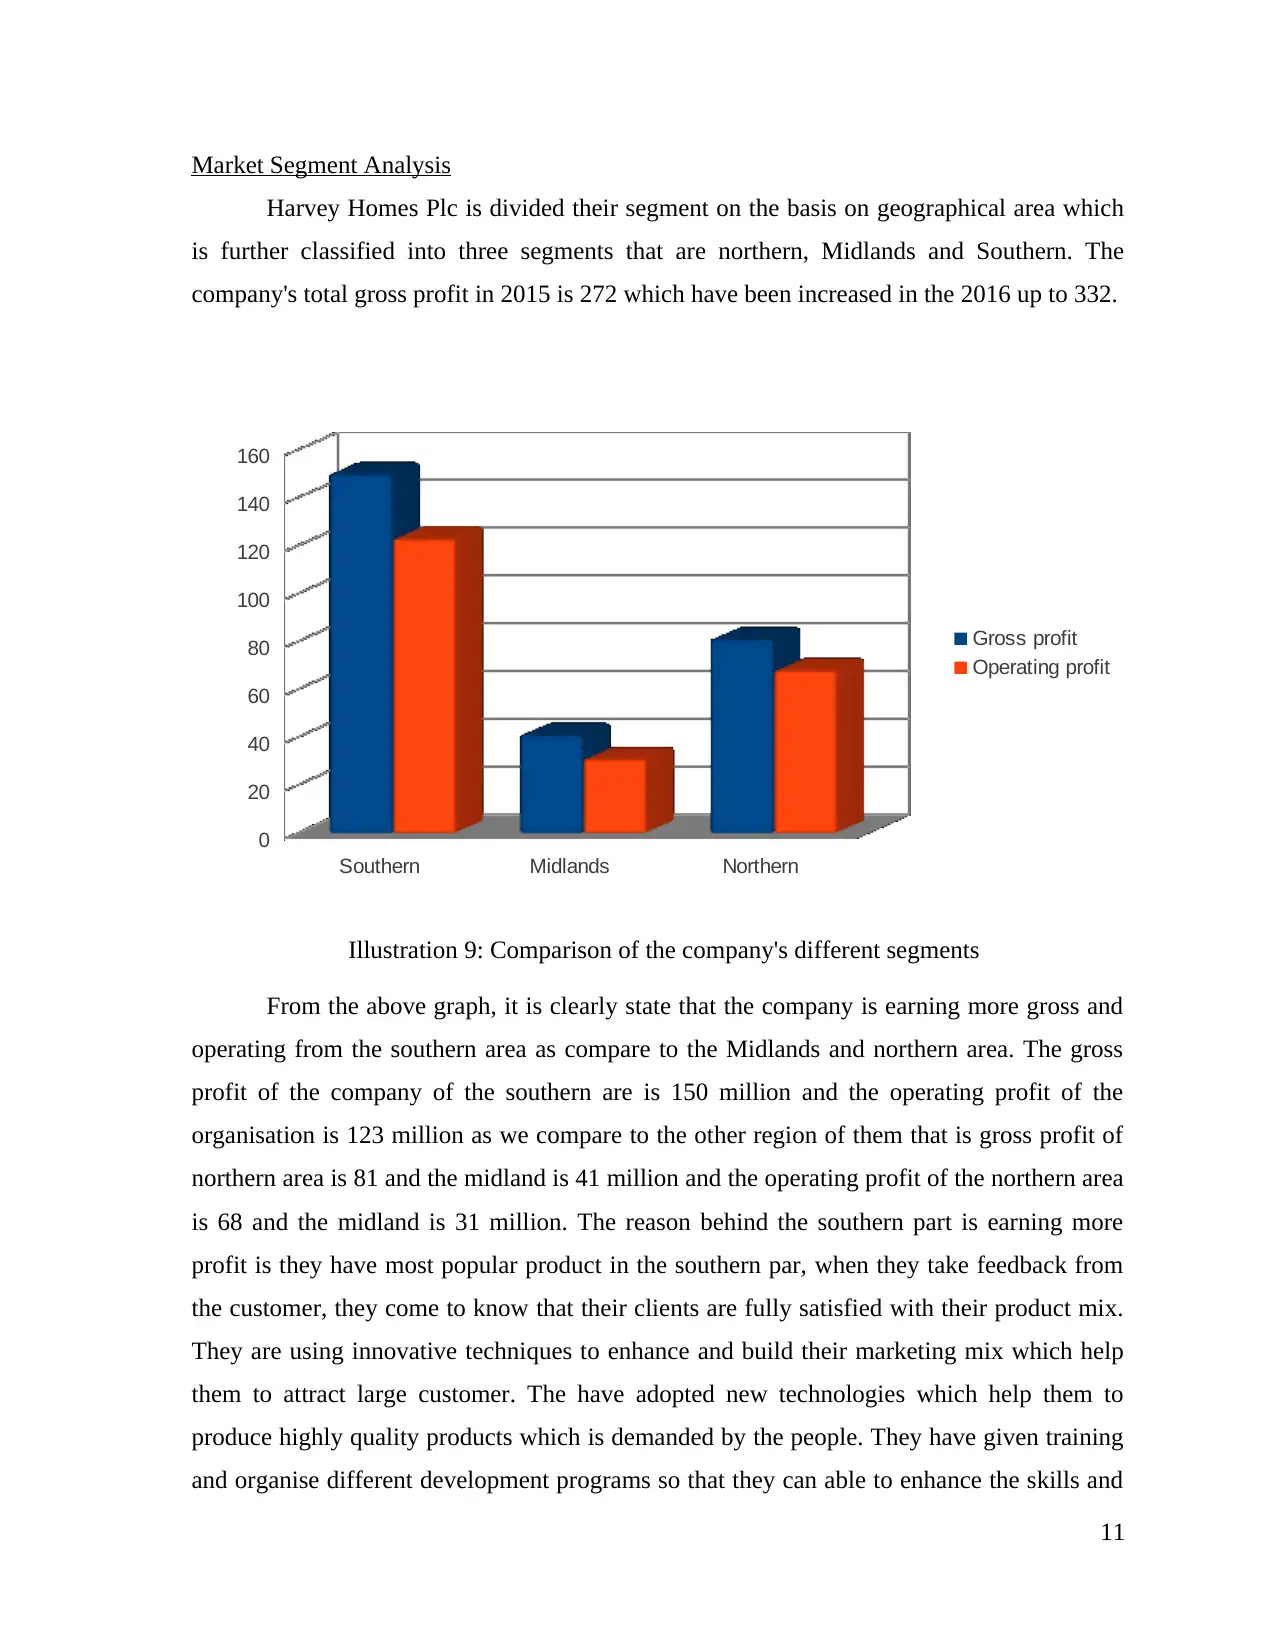
Market Segment Analysis
Harvey Homes Plc is divided their segment on the basis on geographical area which
is further classified into three segments that are northern, Midlands and Southern. The
company's total gross profit in 2015 is 272 which have been increased in the 2016 up to 332.
Southern Midlands Northern
0
20
40
60
80
100
120
140
160
Gross profit
Operating profit
Illustration 9: Comparison of the company's different segments
From the above graph, it is clearly state that the company is earning more gross and
operating from the southern area as compare to the Midlands and northern area. The gross
profit of the company of the southern are is 150 million and the operating profit of the
organisation is 123 million as we compare to the other region of them that is gross profit of
northern area is 81 and the midland is 41 million and the operating profit of the northern area
is 68 and the midland is 31 million. The reason behind the southern part is earning more
profit is they have most popular product in the southern par, when they take feedback from
the customer, they come to know that their clients are fully satisfied with their product mix.
They are using innovative techniques to enhance and build their marketing mix which help
them to attract large customer. The have adopted new technologies which help them to
produce highly quality products which is demanded by the people. They have given training
and organise different development programs so that they can able to enhance the skills and
11
knowledge of the employee which helps them to fulfil the customer orders on time and serve
best experience than their competitors. The organisation should also adopt these all
techniques in all the areas so that they can improve their profits in all the areas.
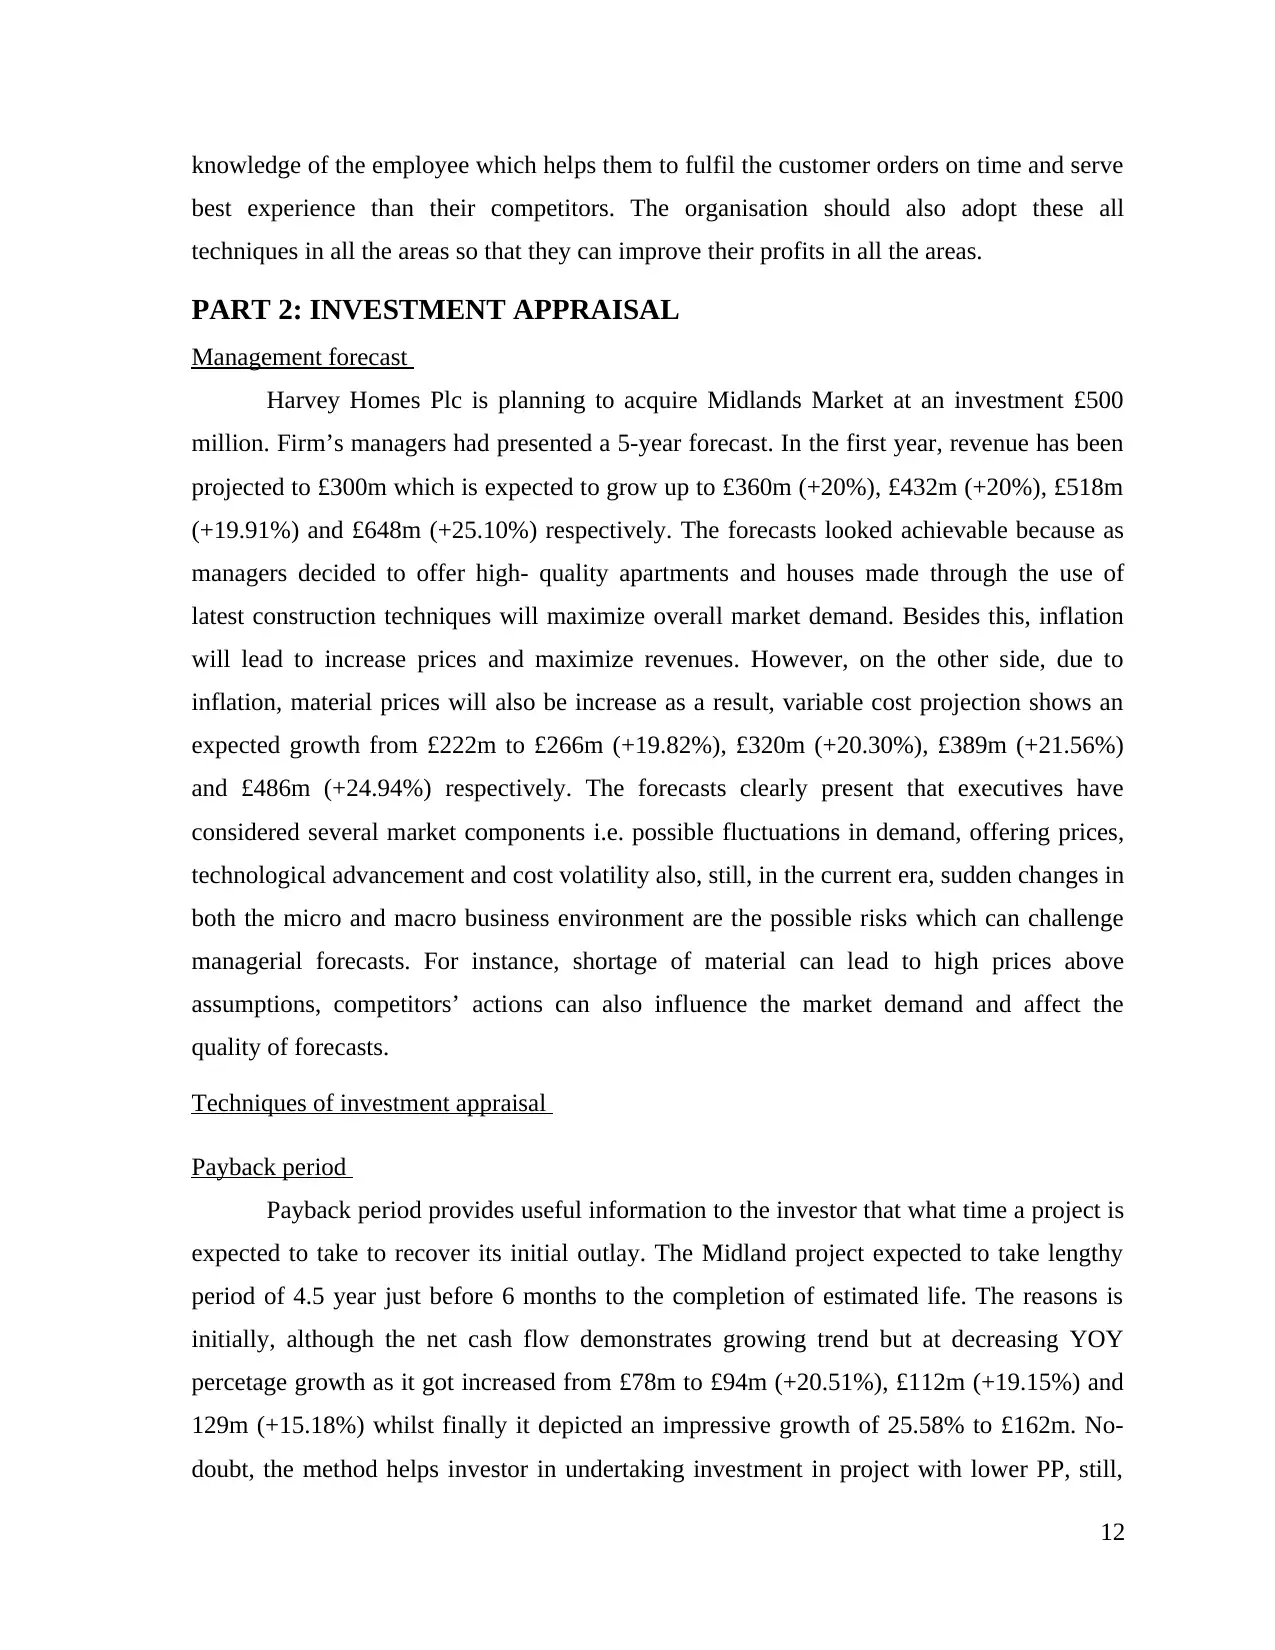
PART 2: INVESTMENT APPRAISAL
Management forecast
Harvey Homes Plc is planning to acquire Midlands Market at an investment £500
million. Firm’s managers had presented a 5-year forecast. In the first year, revenue has been
projected to £300m which is expected to grow up to £360m (+20%), £432m (+20%), £518m
(+19.91%) and £648m (+25.10%) respectively. The forecasts looked achievable because as
managers decided to offer high- quality apartments and houses made through the use of
latest construction techniques will maximize overall market demand. Besides this, inflation
will lead to increase prices and maximize revenues. However, on the other side, due to
inflation, material prices will also be increase as a result, variable cost projection shows an
expected growth from £222m to £266m (+19.82%), £320m (+20.30%), £389m (+21.56%)
and £486m (+24.94%) respectively. The forecasts clearly present that executives have
considered several market components i.e. possible fluctuations in demand, offering prices,
technological advancement and cost volatility also, still, in the current era, sudden changes in
both the micro and macro business environment are the possible risks which can challenge
managerial forecasts. For instance, shortage of material can lead to high prices above
assumptions, competitors’ actions can also influence the market demand and affect the
quality of forecasts.
Techniques of investment appraisal
Payback period
Payback period provides useful information to the investor that what time a project is
expected to take to recover its initial outlay. The Midland project expected to take lengthy
period of 4.5 year just before 6 months to the completion of estimated life. The reasons is
initially, although the net cash flow demonstrates growing trend but at decreasing YOY
percetage growth as it got increased from £78m to £94m (+20.51%), £112m (+19.15%) and
129m (+15.18%) whilst finally it depicted an impressive growth of 25.58% to £162m. No-
doubt, the method helps investor in undertaking investment in project with lower PP, still,
12
best experience than their competitors. The organisation should also adopt these all
techniques in all the areas so that they can improve their profits in all the areas.
PART 2: INVESTMENT APPRAISAL
Management forecast
Harvey Homes Plc is planning to acquire Midlands Market at an investment £500
million. Firm’s managers had presented a 5-year forecast. In the first year, revenue has been
projected to £300m which is expected to grow up to £360m (+20%), £432m (+20%), £518m
(+19.91%) and £648m (+25.10%) respectively. The forecasts looked achievable because as
managers decided to offer high- quality apartments and houses made through the use of
latest construction techniques will maximize overall market demand. Besides this, inflation
will lead to increase prices and maximize revenues. However, on the other side, due to
inflation, material prices will also be increase as a result, variable cost projection shows an
expected growth from £222m to £266m (+19.82%), £320m (+20.30%), £389m (+21.56%)
and £486m (+24.94%) respectively. The forecasts clearly present that executives have
considered several market components i.e. possible fluctuations in demand, offering prices,
technological advancement and cost volatility also, still, in the current era, sudden changes in
both the micro and macro business environment are the possible risks which can challenge
managerial forecasts. For instance, shortage of material can lead to high prices above
assumptions, competitors’ actions can also influence the market demand and affect the
quality of forecasts.
Techniques of investment appraisal
Payback period
Payback period provides useful information to the investor that what time a project is
expected to take to recover its initial outlay. The Midland project expected to take lengthy
period of 4.5 year just before 6 months to the completion of estimated life. The reasons is
initially, although the net cash flow demonstrates growing trend but at decreasing YOY
percetage growth as it got increased from £78m to £94m (+20.51%), £112m (+19.15%) and
129m (+15.18%) whilst finally it depicted an impressive growth of 25.58% to £162m. No-
doubt, the method helps investor in undertaking investment in project with lower PP, still,
12
many academics & professionals criticized the method just because of its failure to not give
value to the currency’s time value (Avery, Flaherty, and Rhee, 2011). Besides this, another
criticism of the technique is that it also avoids cash flow that occurred after the recovery of
beginning investment. In contrast, some studies favour the method because it is very easy
way to determine the time length of recovery of initial cost to manage investment risk.
Accounting/Average rate of return (ARR)
ARR method is based on conventional accounting because it uses accrual concepts to
examine investment project worthiness. The method provides an idea that what percentage
of return does Harvey Homes Plc can collect on their capital invested. The acquisition of
Midland is expected to generate an annual return of 6% that exceeded the standard criteria
decided by the manager of 5% that encourage managers to accept the project. Undoubtedly,
it is a good way to examine the investment project considering return; still, the main
drawback is that it does not consider timing and also the cash flow variations (Echanis and
Kester, 2016). It considers profits after deducting depreciation which does not result in
actual cash outflow, thus, mislead investors. Considering its shortcoming, it is better to reach
to any decisions taking into account ARR only.
Net present value
NPV is widely used technique in the field of investment appraisal for the successful
financial decisions because it accounted for time value of currency using current rate of
interest at which Midland acquisition project is financed. For the given scenario, at 3% cost
of capital, NPV is determined to £22m at profitability Index of 4% that exceeded the
standard criteria of 3.5% set by the managers. As the method considers risk therefore, it is
considered really suitable and appropriate technique of capital budgeting and suggests
Harvey Homes to undertake investment of the current project. In contrast, academicians
contended that using a same rate for overall project life is not justifiable (Shibata and
Nishihara, 2015). Besides this, change in interest rate also affects the NPV outcome because
high rate results in less NPV or vice-versa which the method does not accounted. In addition,
at the global level, FOREX rate, corporation tax rate also has an influence over the result.
Although, the method has several drawbacks, still, among all the above techniques, it is
highly suitable; therefore, it is better to recommend the firm to invest required capital to
acquire Midland division so as to gain favourable return (Li and Trutnevyte, 2017).
13
Secure Best Marks with AI Grader
Need help grading? Try our AI Grader for instant feedback on your assignments.
Finance sources
Scenario presented that firm is looking for an additional investment in the France
which requires an initial outlay of £400m, hence, company requires sufficient amount of
capital to finance the project. There are following sources available through which, capital
can be gathered, enumerated hereunder:
Share issue: Firm can decide to go to public by issuing equity shares and collect
capital from the public subscription for acquiring stake in the company. No mandatory
obligation to pay a fixed rate of dividend at specified time is the key advantage of this
method, still, considering actual corporate world, it seems essential to distribute some
proportion of return as dividend to encourage investors to hold their equity or buy also (Sabri
and et.al., 2015). However, in contrast, absence of tax shields & transfer of stake are the
downfall sides of share issue.
Bank borrowings: In every nation, financial institutions provide monetary assistance
in the way of giving loan to the required party. Harvey Homes Plc can apply for bank loan
and in return, as per the schedule of payment, it will have to pay timely instalments inclusive
of interest. Although, business has to manage funds for the repayment, still, they can get tax
deductions to the amount of interest paid to the lender. In despite of this, business control is
not diverted to the debt providers and they have no voting power to participate in board
decisions (Peirson and et.al., 2014).
Retained earnings: Every business does not distribute all of its earning among
shareholders as dividend and keep some proportion in their hand so as to finance future
projects. Harvey Homes Plc can utilize its cumulative return of previous years and invest it
for undertaking investment in France without any financial and legal obligation.
Considering all the above sources, it is better to suggest the firm to incorporate a
mixture of all these financial sources to finance its new project. Debt must be used for
getting tax benefits whereas equity is suggested to use because of absence of mandatory
dividend payment and retained earning has no obligation. Firm must combine these financial
sources in a debt to equity ratio of 0.50:1 to manage risk appropriately.
14
Non-financial factors
Respective Directors
Harvey Homes Plc
10th August 2017
Subject: Qualitative factors in capital budgeting decisions
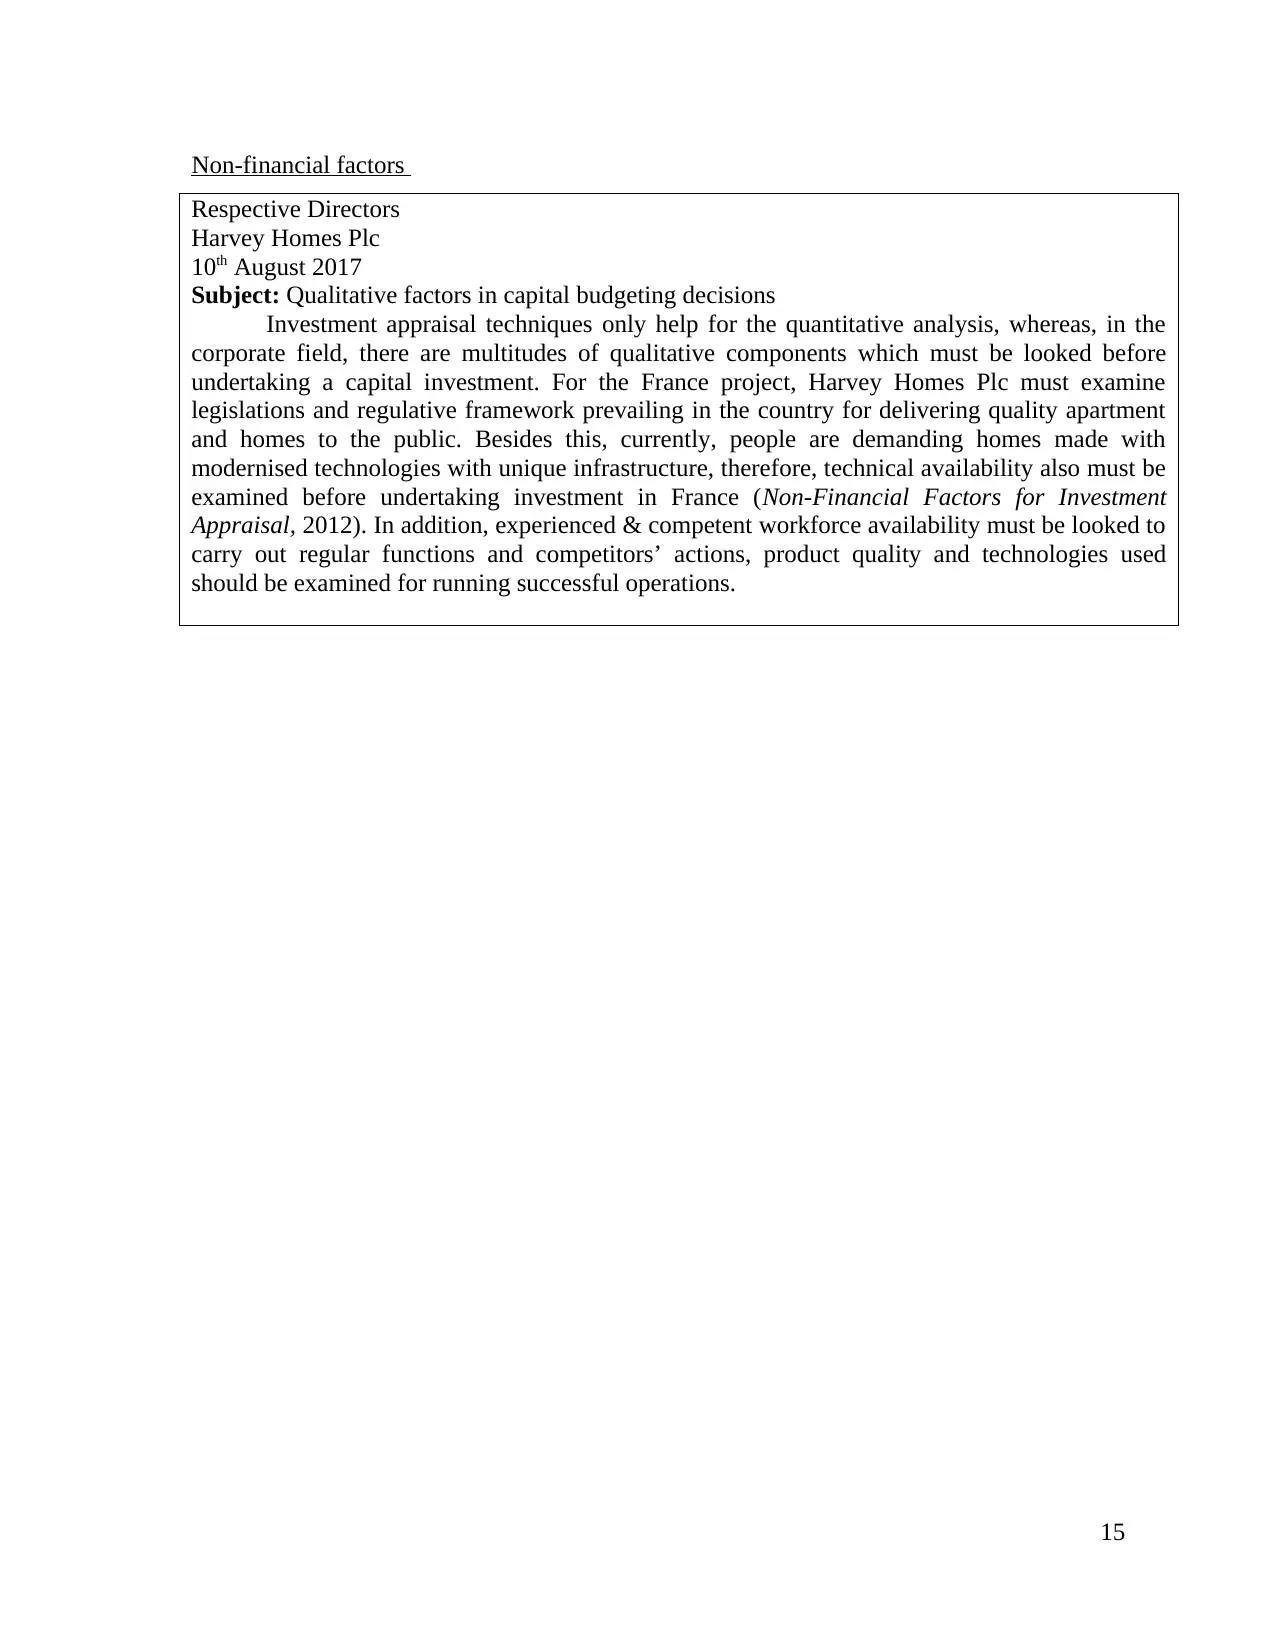
Investment appraisal techniques only help for the quantitative analysis, whereas, in the
corporate field, there are multitudes of qualitative components which must be looked before
undertaking a capital investment. For the France project, Harvey Homes Plc must examine
legislations and regulative framework prevailing in the country for delivering quality apartment
and homes to the public. Besides this, currently, people are demanding homes made with
modernised technologies with unique infrastructure, therefore, technical availability also must be
examined before undertaking investment in France (Non-Financial Factors for Investment
Appraisal, 2012). In addition, experienced & competent workforce availability must be looked to
carry out regular functions and competitors’ actions, product quality and technologies used
should be examined for running successful operations.
15
Respective Directors
Harvey Homes Plc
10th August 2017
Subject: Qualitative factors in capital budgeting decisions
Investment appraisal techniques only help for the quantitative analysis, whereas, in the
corporate field, there are multitudes of qualitative components which must be looked before
undertaking a capital investment. For the France project, Harvey Homes Plc must examine
legislations and regulative framework prevailing in the country for delivering quality apartment
and homes to the public. Besides this, currently, people are demanding homes made with
modernised technologies with unique infrastructure, therefore, technical availability also must be
examined before undertaking investment in France (Non-Financial Factors for Investment
Appraisal, 2012). In addition, experienced & competent workforce availability must be looked to
carry out regular functions and competitors’ actions, product quality and technologies used
should be examined for running successful operations.
15
REFERENCES
Books and Journal
Allen, E. J., Larson, C. R. and Sloan, R. G., 2013. Accrual reversals, earnings and stock
returns. Journal of Accounting and Economics. 56(1). pp.113-129.
Arnold, G., 2013. Corporate financial management. Pearson Higher Ed.
Caglayan, M. and Demir, F., 2014. Firm productivity, exchange rate movements, sources of
finance, and export orientation. World Development. 54. pp.204-219.
Lanis, R. and Richardson, G., 2012. Corporate social responsibility and tax aggressiveness: An
empirical analysis. Journal of Accounting and Public Policy. 31(1). pp.86-108.
Needles, B. E., Powers, M. and Crosson, S. V., 2013. Principles of accounting. Cengage
Learning.
Weygandt, J. J., Kimmel, P. D. and Kieso, D. E., 2015. Financial & Managerial Accounting.
John Wiley & Sons.
Peirson, G. and et.al., 2014. Business finance. McGraw-Hill Education Australia.
Shibata, T. and Nishihara, M., 2015. Investment timing, debt structure, and financing
constraints. European Journal of Operational Research. 241(2). pp. 513-526.
Sabri, M. F. and et.al., 2015. Financial literacy, financial Management practices, and retirement
confidence among Women working in government Agencies: A mediation model. The
Journal of Developing Areas. 49(6). pp. 405-412.
Echanis, E. S. and Kester, G. W., 2016. Capital Budgeting Practices of Listed Philippine
Firms. Philippine Management Review. 7(1). pp. 16-28.
AVERY, A.E., FLAHERTY, S.M.V. and RHEE, M., 2011. Fortifying the Payback Period
Method for Alternative Cash Flow Patterns. Journal of Financial and Economic
Practice. 11(2). pp. 1-9.
Li, F. G. and Trutnevyte, E., 2017. Investment appraisal of cost-optimal and near-optimal
pathways for the UK electricity sector transition to 2050. Applied Energy. 189. pp.89-109.
Online
16
Paraphrase This Document
Need a fresh take? Get an instant paraphrase of this document with our AI Paraphraser

Non-Financial Factors for Investment Appraisal. 2012. [Online]. Available through: <
https://www.nibusinessinfo.co.uk/content/non-financial-factors-investment-appraisal>.
[Accessed on 10th August 2017].
17
https://www.nibusinessinfo.co.uk/content/non-financial-factors-investment-appraisal>.
[Accessed on 10th August 2017].
17
APPENDIX
Appendix 1:
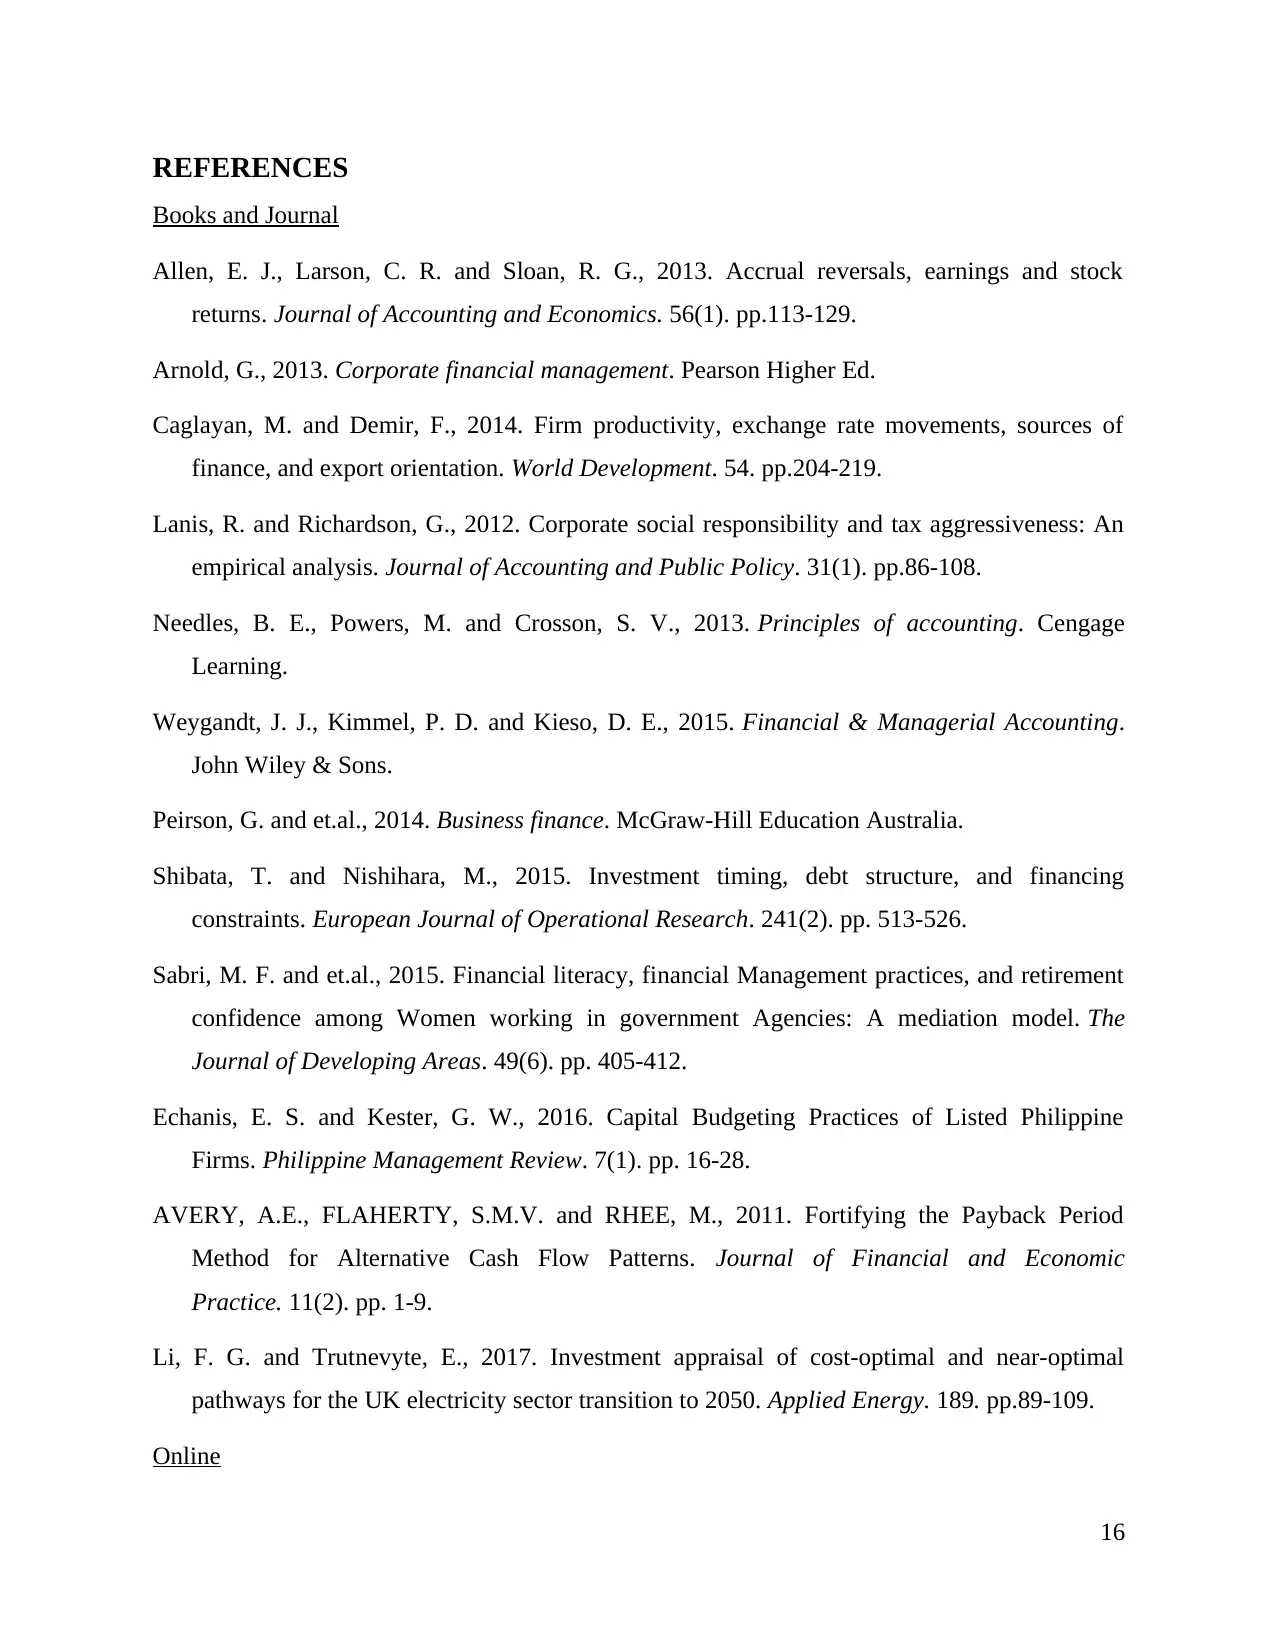
Table 1: Ratio analysis for profit and loss statement
Formula 2016 2015 Increase /
Decrease
Gross profit
Gross Margin / Net
Sales*100
332 272 60
Net sales 1297 1083 214
Gross Margin
ratio 25.60% 25.10% 0.500
Operating profits
Operating profit /
Revenue*100
259 222 37.00
Revenue 1297 1083 214.00
Net Margin Ratio 20% 20.5% -0.500%
Operating profits
Operating Profits / return on
capital employed * 100
259 222 37.00
Capital employed 1412 1094 318.00
Return on capital
employed 18.00% 20.00% -2.00%
Appendix 2:
Table 2: Calculation of Capital employed
Calculation of Capital employed
Formula: Total Assets – Current Liabilities
2016 2015
Total Assets 2046 1644
Less: Current Liabilities -634 -550
Capital Employed 1412 1094
18
Appendix 1:
Table 1: Ratio analysis for profit and loss statement
Formula 2016 2015 Increase /
Decrease
Gross profit
Gross Margin / Net
Sales*100
332 272 60
Net sales 1297 1083 214
Gross Margin
ratio 25.60% 25.10% 0.500
Operating profits
Operating profit /
Revenue*100
259 222 37.00
Revenue 1297 1083 214.00
Net Margin Ratio 20% 20.5% -0.500%
Operating profits
Operating Profits / return on
capital employed * 100
259 222 37.00
Capital employed 1412 1094 318.00
Return on capital
employed 18.00% 20.00% -2.00%
Appendix 2:
Table 2: Calculation of Capital employed
Calculation of Capital employed
Formula: Total Assets – Current Liabilities
2016 2015
Total Assets 2046 1644
Less: Current Liabilities -634 -550
Capital Employed 1412 1094
18
Appendix 3:
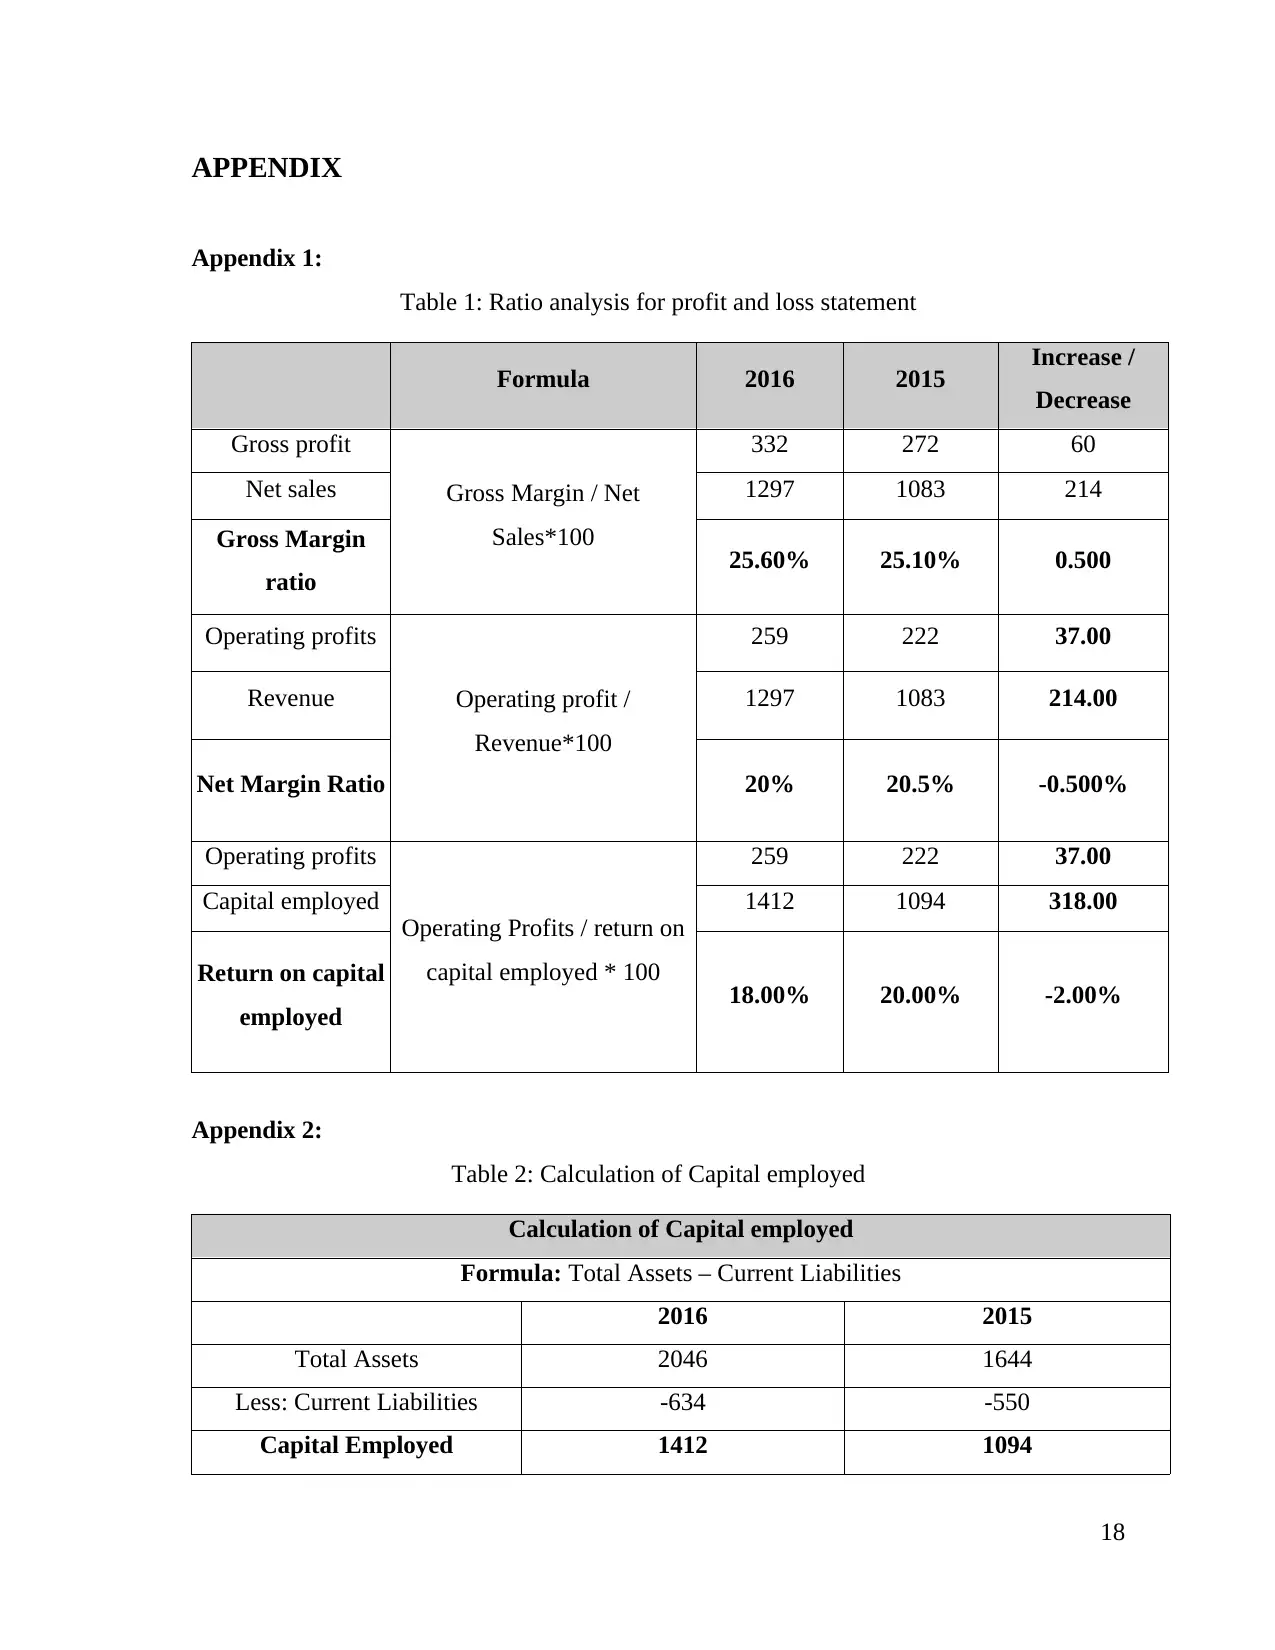
Table 3: Cash flow from operating, investing and financing activities
Cash flow from different activities
Particulars Cash flows
Operating activities -32
Investing activities -23
Financing activities 150
Appendix 4:
Table 4: Calculation of DIO, DSO and DPO
Particulars 2016 2015 Formula
Inventories 1808 1500
(Inventory / Cost of
sales)* days in
accounting periodCost of goods sold 965 811
Days in accounting
period 366 365
DIO 685.73 675.09
Accounts receivable 36 39 (Accounts receivable /
Net credit sales) * Days
in accounting period
Net credit sales 1297 1083
Days of accounting 366 365
DSO 10.16 13.14
Accounts payable 566 471 (Accounts payable /
Cost of sales) * Days in
accounting period
Cost of sales 965 811
19
Secure Best Marks with AI Grader
Need help grading? Try our AI Grader for instant feedback on your assignments.
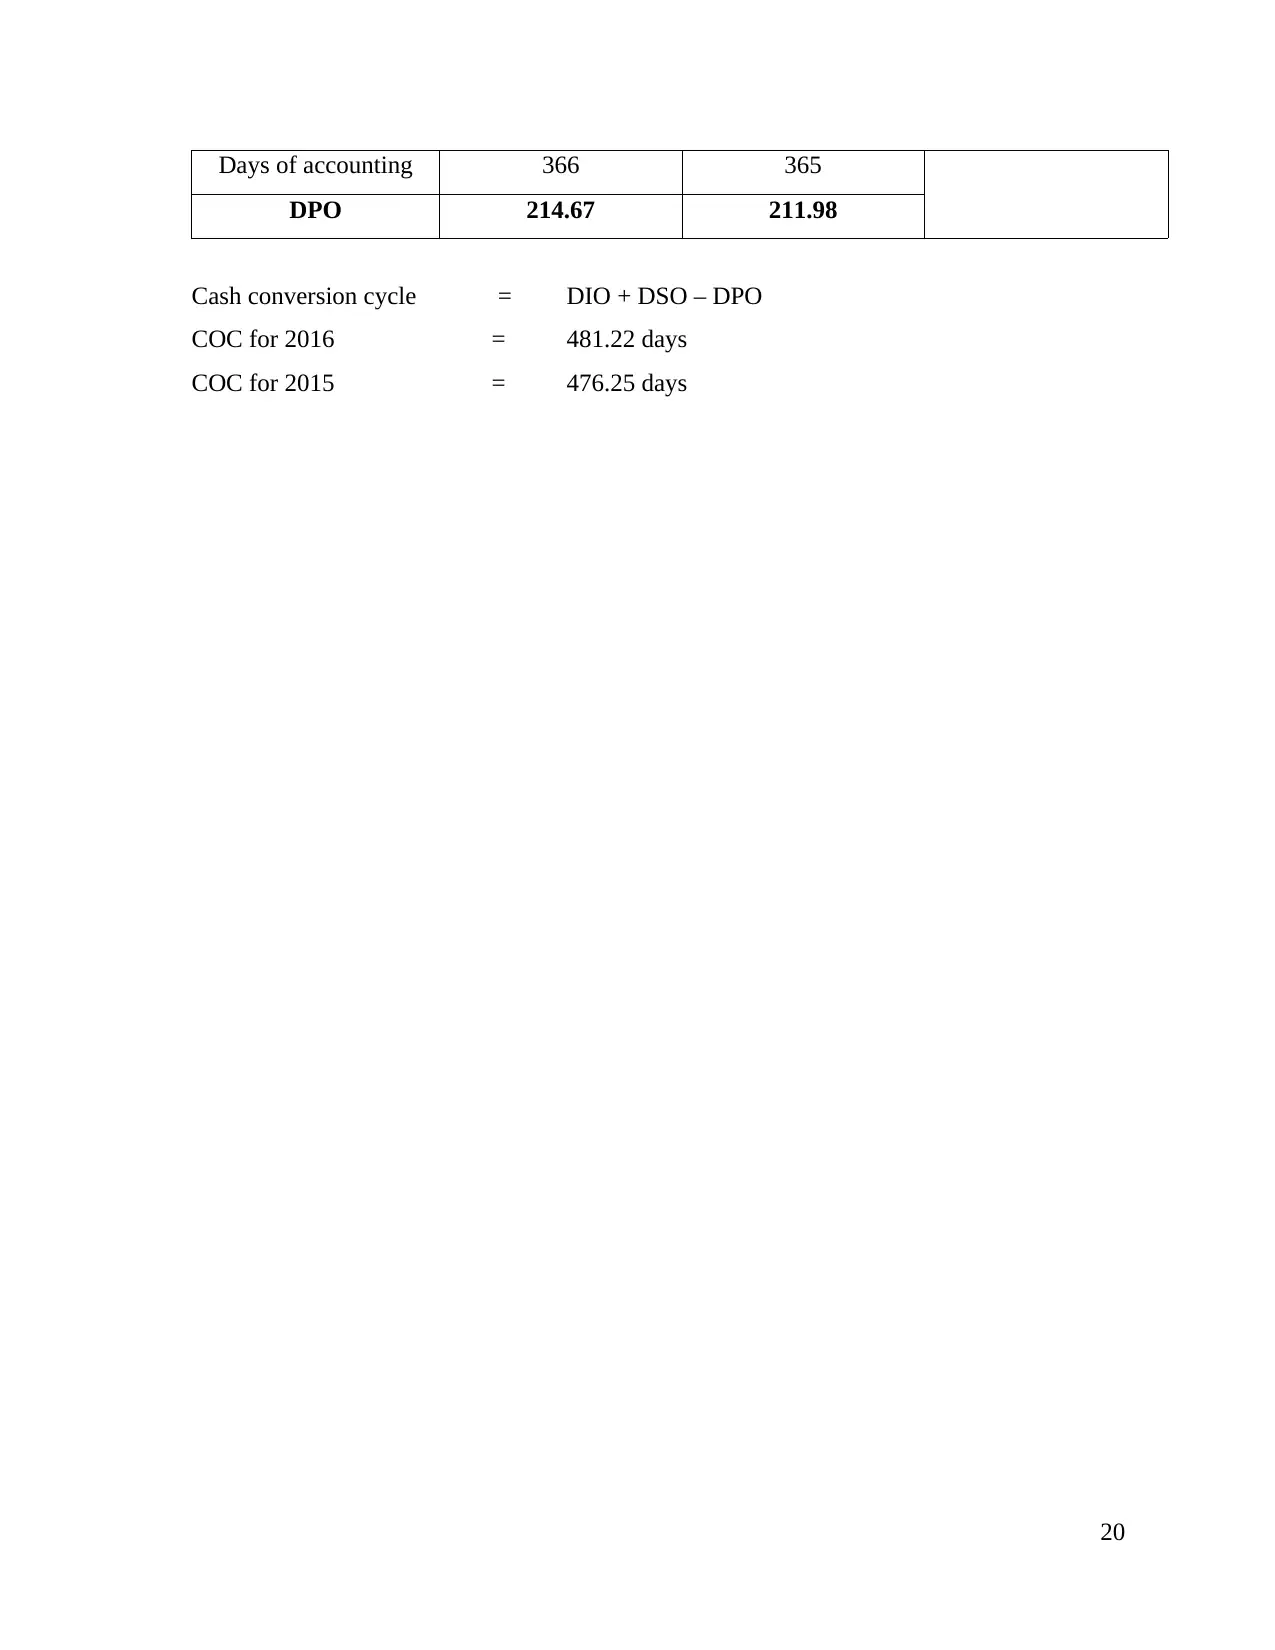
Days of accounting 366 365
DPO 214.67 211.98
Cash conversion cycle = DIO + DSO – DPO
COC for 2016 = 481.22 days
COC for 2015 = 476.25 days
20
DPO 214.67 211.98
Cash conversion cycle = DIO + DSO – DPO
COC for 2016 = 481.22 days
COC for 2015 = 476.25 days
20
1 out of 23
Related Documents

![[PDF] Harvey Company Financial Analysis](/_next/image/?url=https%3A%2F%2Fdesklib.com%2Fmedia%2Fimages%2Fvy%2F7c46e52b2ed44dc28c4d7f598dd6c910.jpg&w=256&q=75)
![[FULL ACCESS] Financial Analysis and Market Segmentation](/_next/image/?url=https%3A%2F%2Fdesklib.com%2Fmedia%2Fimages%2Fqf%2Fca1b2367267248f99b66462acf21e250.jpg&w=256&q=75)


Your All-in-One AI-Powered Toolkit for Academic Success.
+13062052269
info@desklib.com
Available 24*7 on WhatsApp / Email
![[object Object]](/_next/static/media/star-bottom.7253800d.svg)
Unlock your academic potential
© 2024 | Zucol Services PVT LTD | All rights reserved.