AM803001 - Financial Decision Making Assignment
Added on 2020-09-03
23 Pages5220 Words56 Views
FINANCIAL DECISIONMAKING
Table of ContentsEXECUTIVE SUMMARY.............................................................................................................1PART 1............................................................................................................................................1Analysing the statement of profit or loss................................................................................1Financial position analysis.....................................................................................................5Analysis of cash flow statement.............................................................................................9Market Segment Analysis.....................................................................................................10PART 2: INVESTMENT APPRAISAL........................................................................................12Management forecast ...........................................................................................................12Techniques of investment appraisal ....................................................................................12Payback period ................................................................................................................12Accounting/Average rate of return (ARR) .....................................................................13Net present value..................................................................................................................13Non-financial factors ...........................................................................................................14APPENDIX....................................................................................................................................18
Illustration IndexIllustration 1: Comparison of gross profit and net sales..................................................................2Illustration 2: Comparison of operating profits and revenue..........................................................3Illustration 3: Comparison of operating profits and capital employed............................................4Illustration 4: Current ratio of Harvey Homes Plc...........................................................................6Illustration 5: Quick ratio of Harvey Homes Plc.............................................................................7Illustration 6: Debt ratio of the Harvey Homes Plc.........................................................................8Illustration 7: Cash flow from operating, investing and financing activities...................................9Illustration 8: Comparison of Cash Conversion Cycle..................................................................10Illustration 9: Comparison of the company's different segments..................................................11Index of TablesTable 1: Ratio analysis for profit and loss statement.....................................................................18Table 2: Calculation of Capital employed.....................................................................................18Table 3: Cash flow from operating, investing and financing activities.........................................19Table 4: Calculation of DIO, DSO and DPO.................................................................................19
EXECUTIVE SUMMARYAnalysing the financial statements of the entity helps in better decision making. It ishelpful in comparative analysis of sales, profits, assets etc (Allen, Larson and Sloan, 2013).Harvey homes is a company which is involved in creating quality homes. Ratio analysistechnique have been used to analyse the financial statement of the company. Capitalbudgeting technique have been used to assess that whether the project will prove to beprofitable for the company or not. The key findings suggest that current ratio of the companyis on higher side as compared to the ideal one which shows that the entity is not optimallyutilizing its resources available with it. Further, it has taken long term loan for 150 million inorder to meet its expenses as Harvey is not generating much operating cash in order to meetout its needs. Midlands in not generating high revenues where the entity is advised toimprove its product mix and marketing strategy for better profits in near future. Moreover,some financial and non-financial factors have been discussed which the enterprise shouldconsider while expanding in other country.PART 1Analysing the statement of profit or lossGross margin ratio1
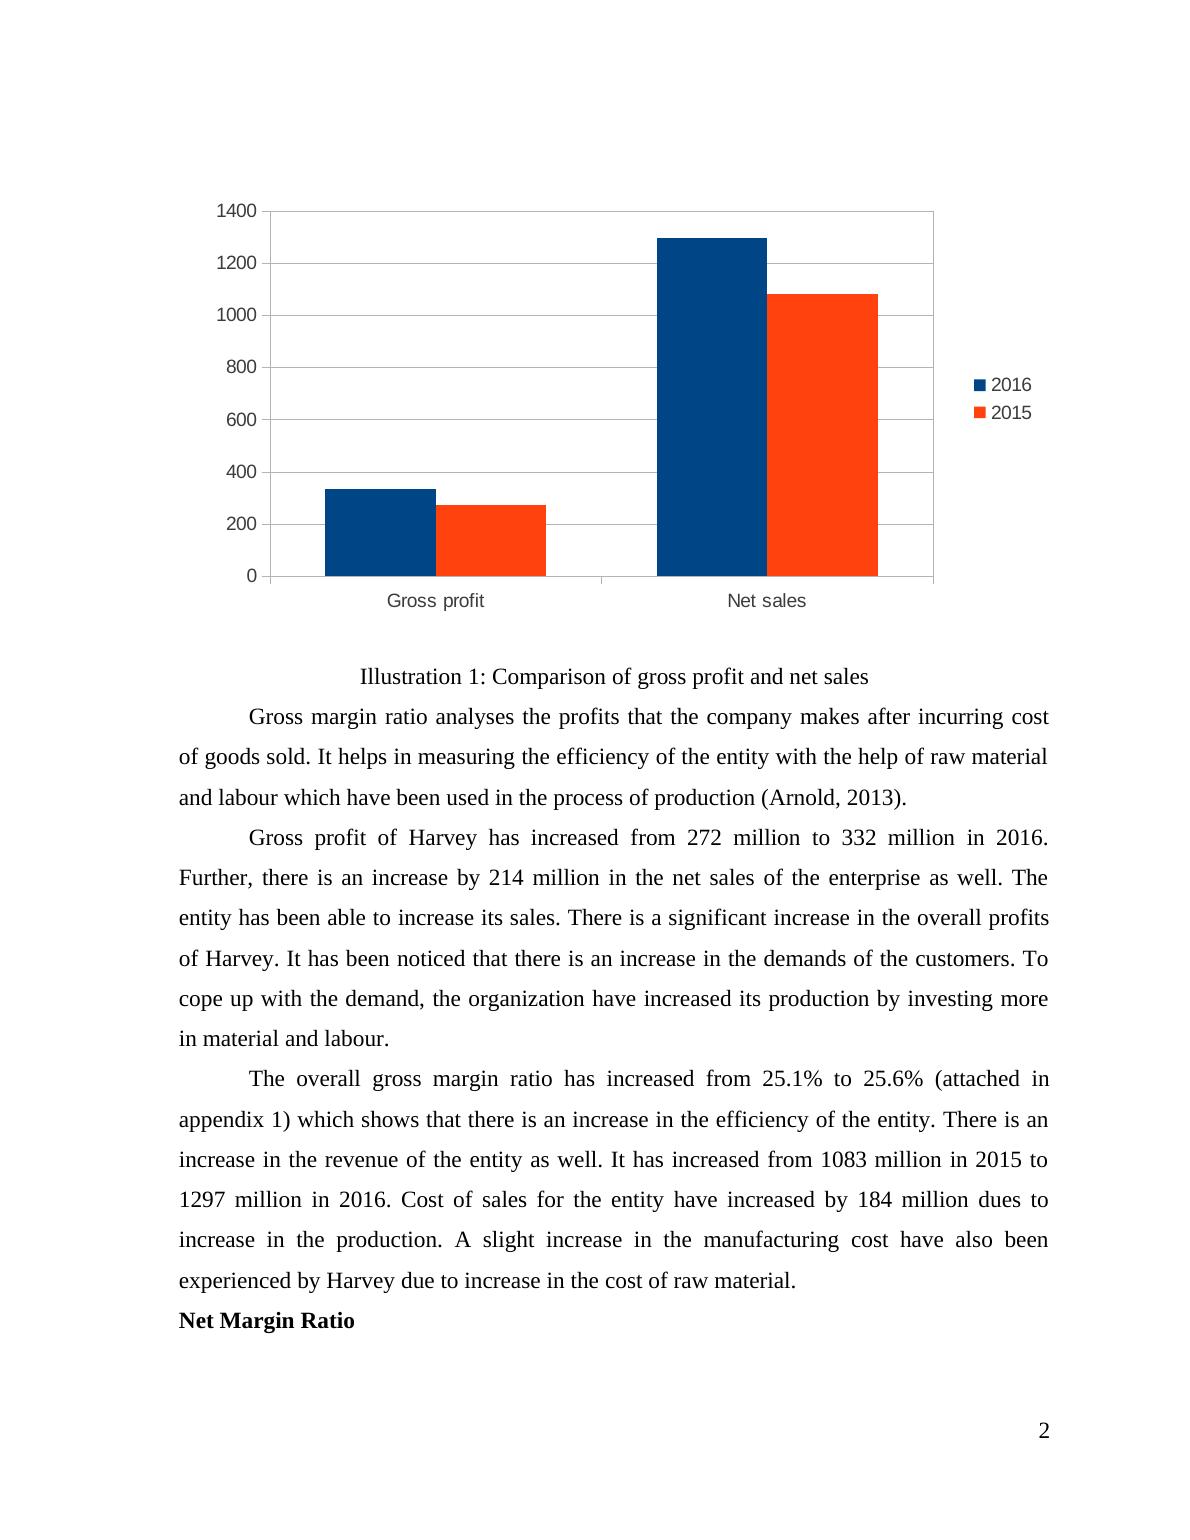
Gross margin ratio analyses the profits that the company makes after incurring costof goods sold. It helps in measuring the efficiency of the entity with the help of raw materialand labour which have been used in the process of production (Arnold, 2013).Gross profit of Harvey has increased from 272 million to 332 million in 2016.Further, there is an increase by 214 million in the net sales of the enterprise as well. Theentity has been able to increase its sales. There is a significant increase in the overall profitsof Harvey. It has been noticed that there is an increase in the demands of the customers. Tocope up with the demand, the organization have increased its production by investing morein material and labour.The overall gross margin ratio has increased from 25.1% to 25.6% (attached inappendix 1) which shows that there is an increase in the efficiency of the entity. There is anincrease in the revenue of the entity as well. It has increased from 1083 million in 2015 to1297 million in 2016. Cost of sales for the entity have increased by 184 million dues toincrease in the production. A slight increase in the manufacturing cost have also beenexperienced by Harvey due to increase in the cost of raw material.Net Margin Ratio2Gross profitNet sales020040060080010001200140020162015Illustration 1: Comparison of gross profit and net sales
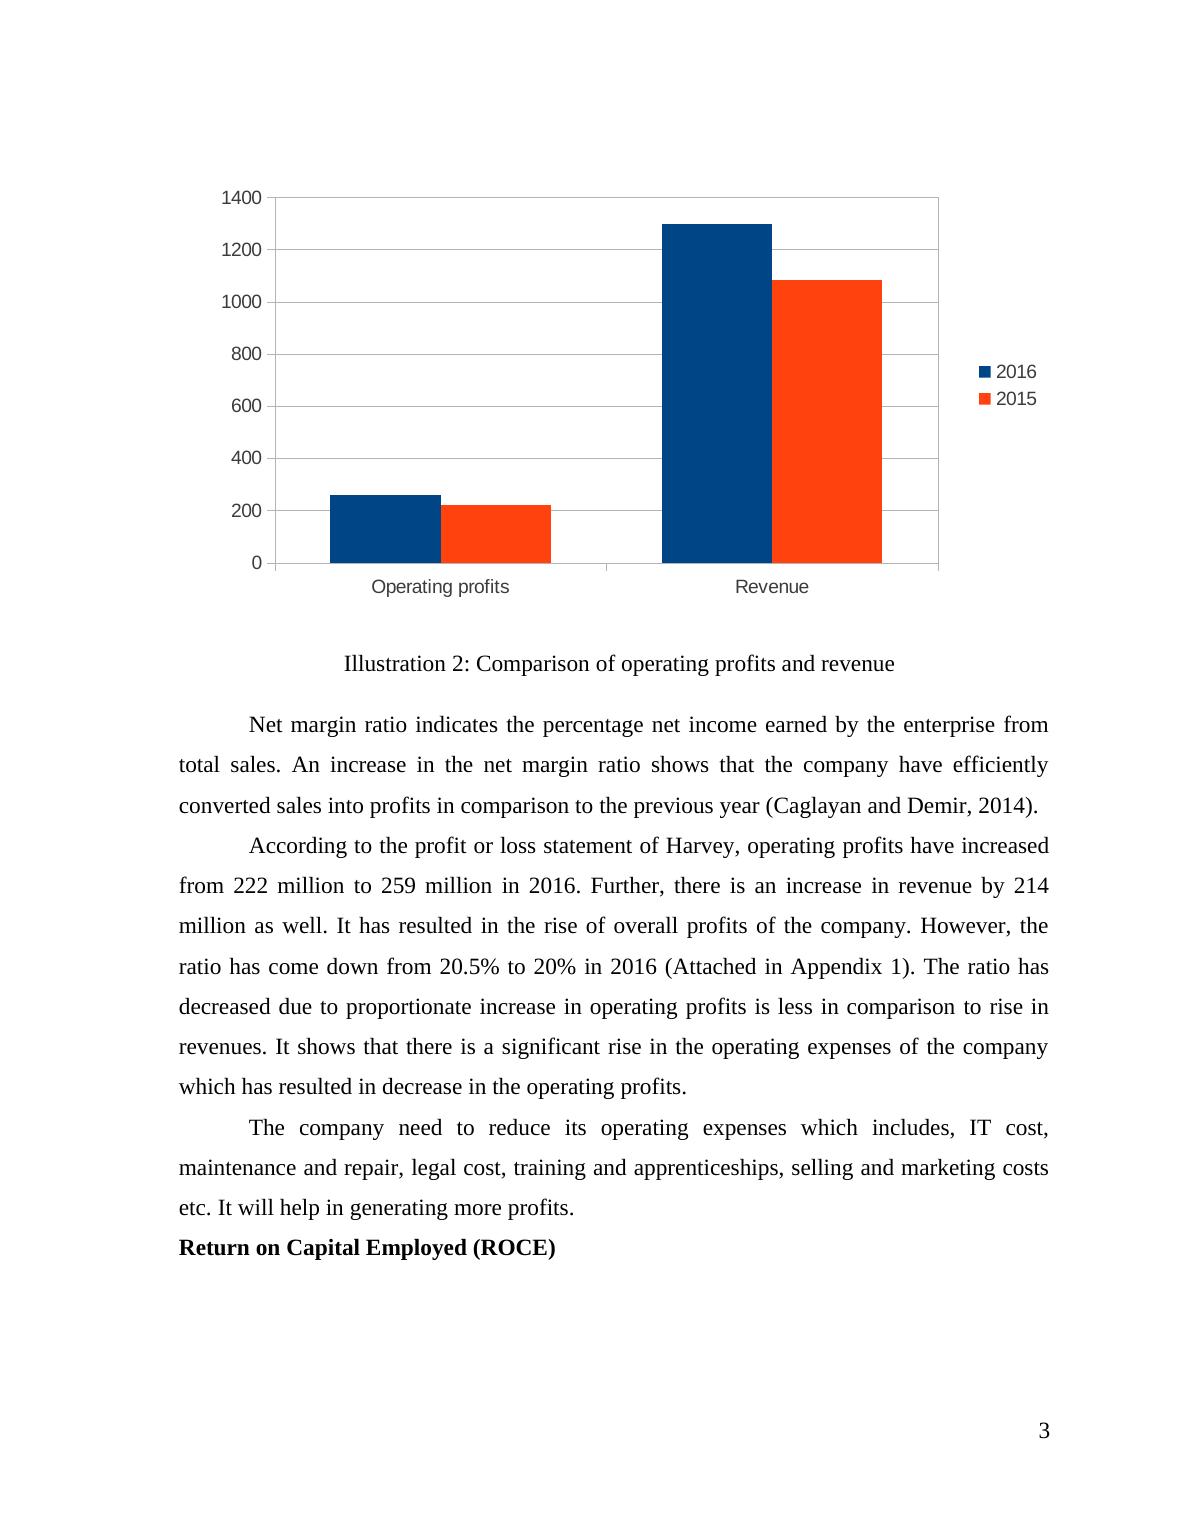
Operating profitsRevenue020040060080010001200140020162015Illustration 2: Comparison of operating profits and revenueNet margin ratio indicates the percentage net income earned by the enterprise fromtotal sales. An increase in the net margin ratio shows that the company have efficientlyconverted sales into profits in comparison to the previous year (Caglayan and Demir, 2014). According to the profit or loss statement of Harvey, operating profits have increasedfrom 222 million to 259 million in 2016. Further, there is an increase in revenue by 214million as well. It has resulted in the rise of overall profits of the company. However, theratio has come down from 20.5% to 20% in 2016 (Attached in Appendix 1). The ratio hasdecreased due to proportionate increase in operating profits is less in comparison to rise inrevenues. It shows that there is a significant rise in the operating expenses of the companywhich has resulted in decrease in the operating profits.The company need to reduce its operating expenses which includes, IT cost,maintenance and repair, legal cost, training and apprenticeships, selling and marketing costsetc. It will help in generating more profits.Return on Capital Employed (ROCE)3
End of preview
Want to access all the pages? Upload your documents or become a member.
Related Documents
Report on Comparative Analysis of Financial Statementlg...
|23
|5327
|46
FINANCIAL DECISION MAKING EXECUTIVE SUMMARYlg...
|27
|5456
|414
Financial Decision Making in Harvey Homes Plc : Case Studylg...
|16
|5699
|44
Financial Decision Making: Assignmentlg...
|16
|4244
|59
Financial Analysis Assignment Sample (Doc)lg...
|21
|3864
|132
Financial Decision Making (PDF)lg...
|22
|4867
|43