Financial Decision Making: Ratio Analysis of Alpha Ltd's Performance
VerifiedAdded on 2023/01/11
|8
|1838
|35
Report
AI Summary
This report presents a financial analysis of Alpha Ltd, focusing on key financial ratios to assess the company's performance. The analysis includes the calculation and interpretation of Return on Capital Employed (ROCE), net profit margin, current ratio, debtors collection period, and creditors coll...

FINANCIAL DECISION
MAKING
MAKING
Paraphrase This Document
Need a fresh take? Get an instant paraphrase of this document with our AI Paraphraser
TABLE OF CONTENTS
TABLE OF CONTENTS..............................................................................................................2
INTRODUCTION...........................................................................................................................3
Calculation of ratios....................................................................................................................3
Performance of the ratios............................................................................................................5
CONCLUSION................................................................................................................................7
REFERENCES................................................................................................................................8
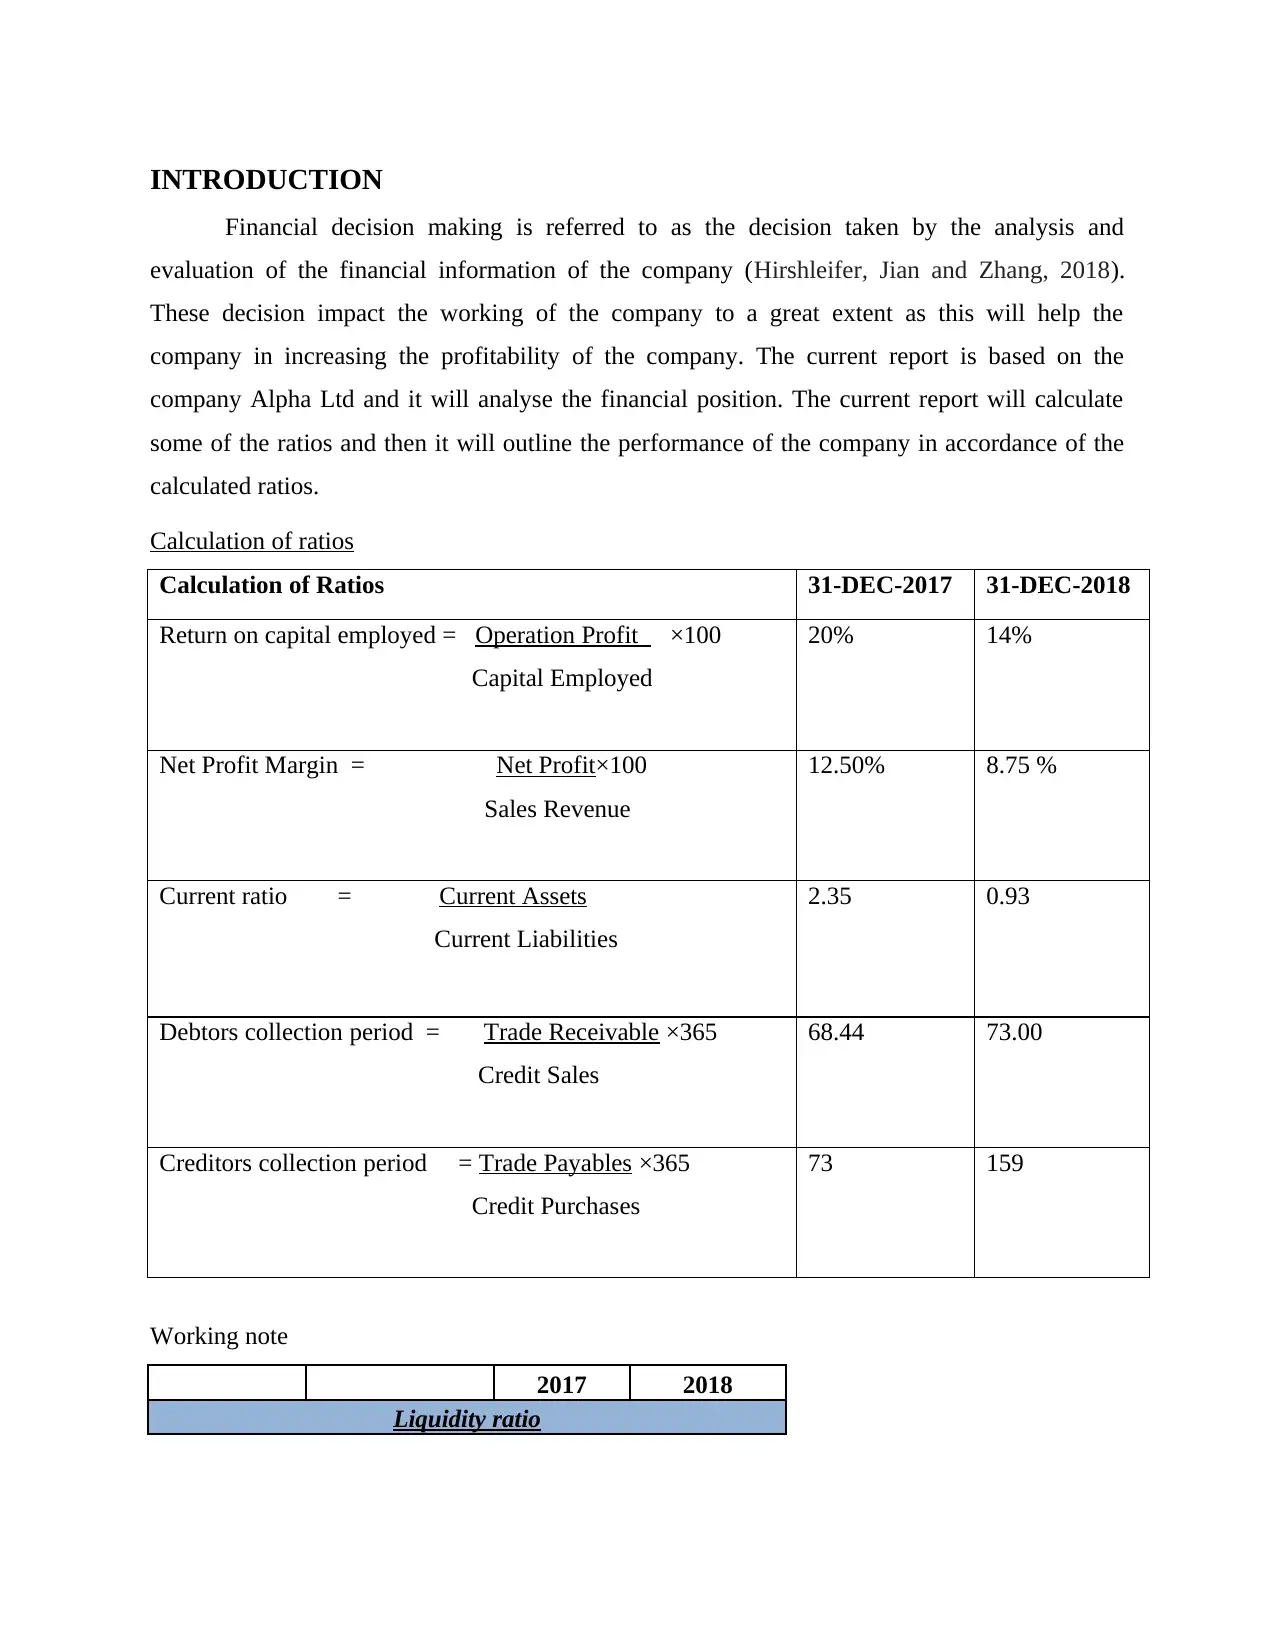
INTRODUCTION
Financial decision making is referred to as the decision taken by the analysis and
evaluation of the financial information of the company (Hirshleifer, Jian and Zhang, 2018).
These decision impact the working of the company to a great extent as this will help the
company in increasing the profitability of the company. The current report is based on the
company Alpha Ltd and it will analyse the financial position. The current report will calculate
some of the ratios and then it will outline the performance of the company in accordance of the
calculated ratios.
Calculation of ratios
Calculation of Ratios 31-DEC-2017 31-DEC-2018
Return on capital employed = Operation Profit ×100
Capital Employed
20% 14%
Net Profit Margin = Net Profit×100
Sales Revenue
12.50% 8.75 %
Current ratio = Current Assets
Current Liabilities
2.35 0.93
Debtors collection period = Trade Receivable ×365
Credit Sales
68.44 73.00
Creditors collection period = Trade Payables ×365
Credit Purchases
73 159
Working note
2017 2018
Liquidity ratio
⊘ This is a preview!⊘
Do you want full access?
Subscribe today to unlock all pages.
Trusted by 1+ million students worldwide
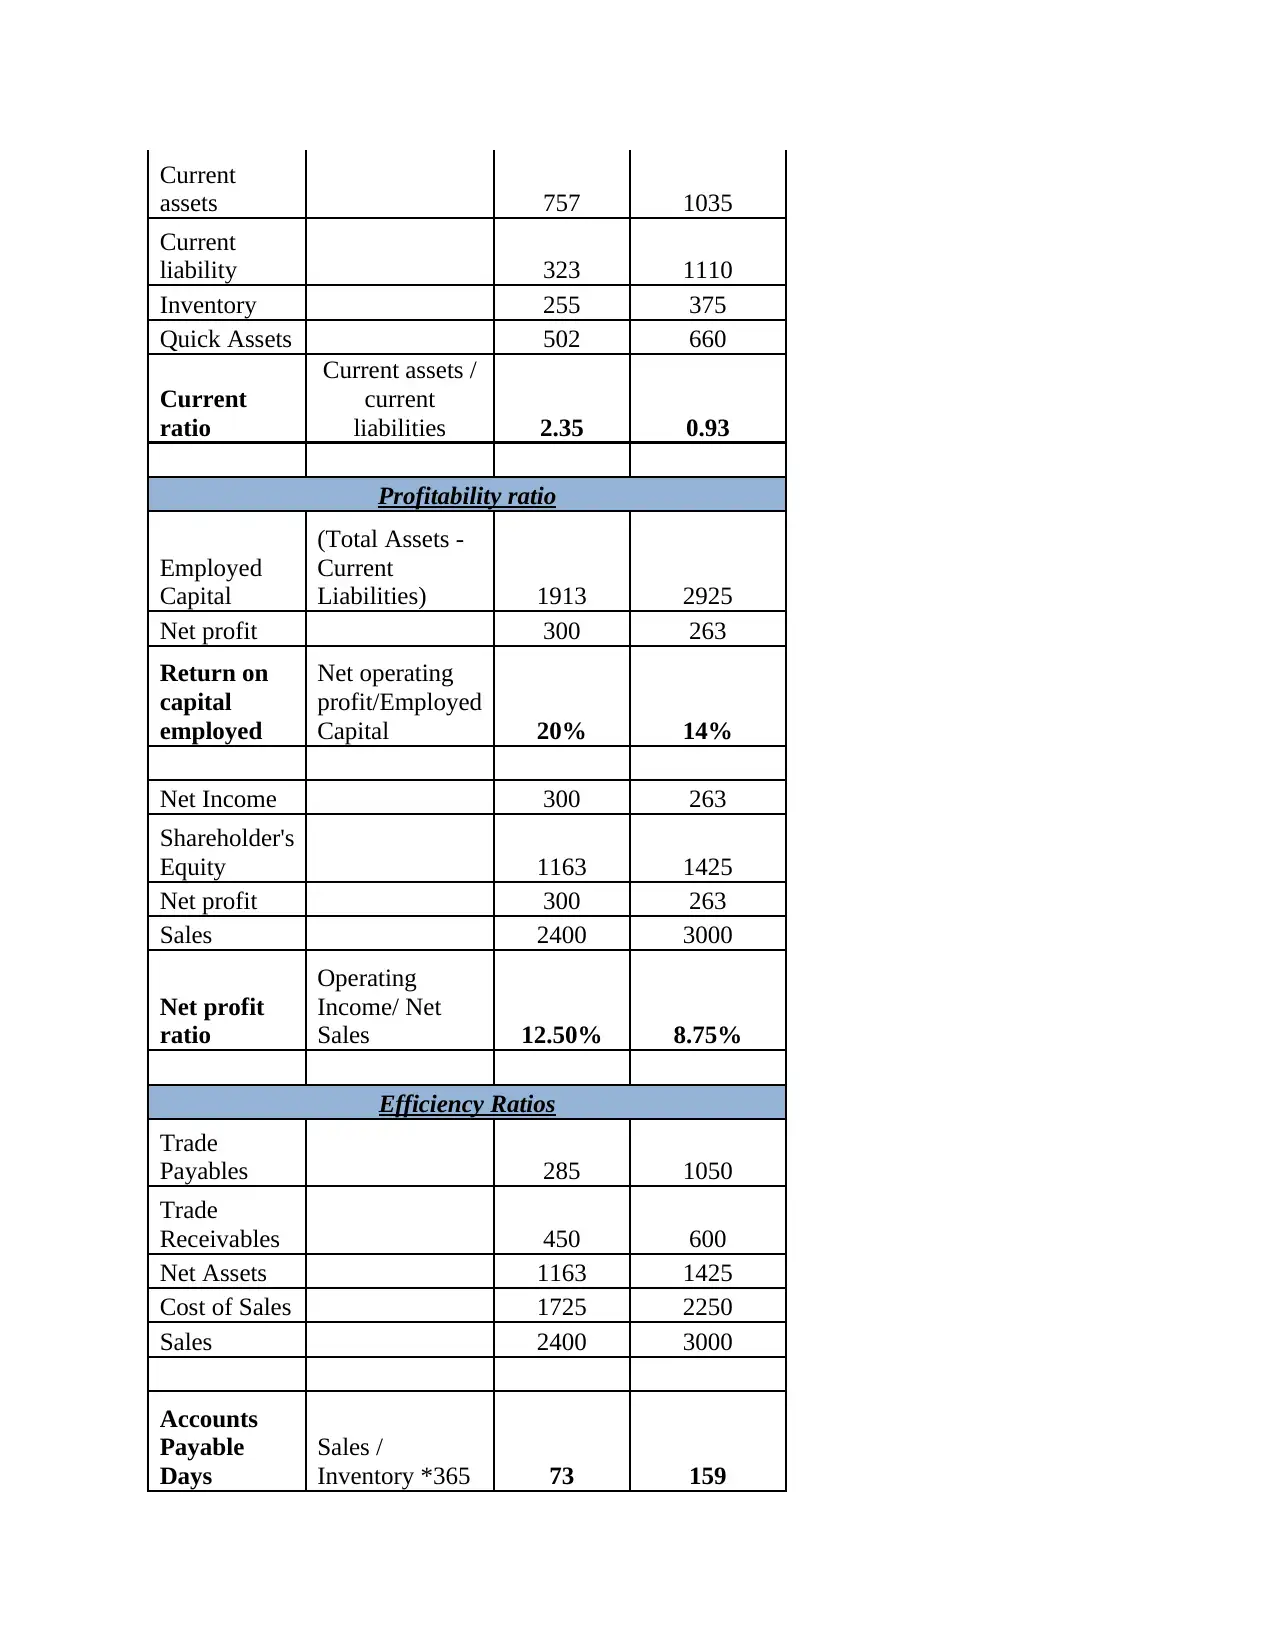
Current
assets 757 1035
Current
liability 323 1110
Inventory 255 375
Quick Assets 502 660
Current
ratio
Current assets /
current
liabilities 2.35 0.93
Profitability ratio
Employed
Capital
(Total Assets -
Current
Liabilities) 1913 2925
Net profit 300 263
Return on
capital
employed
Net operating
profit/Employed
Capital 20% 14%
Net Income 300 263
Shareholder's
Equity 1163 1425
Net profit 300 263
Sales 2400 3000
Net profit
ratio
Operating
Income/ Net
Sales 12.50% 8.75%
Efficiency Ratios
Trade
Payables 285 1050
Trade
Receivables 450 600
Net Assets 1163 1425
Cost of Sales 1725 2250
Sales 2400 3000
Accounts
Payable
Days
Sales /
Inventory *365 73 159
Paraphrase This Document
Need a fresh take? Get an instant paraphrase of this document with our AI Paraphraser
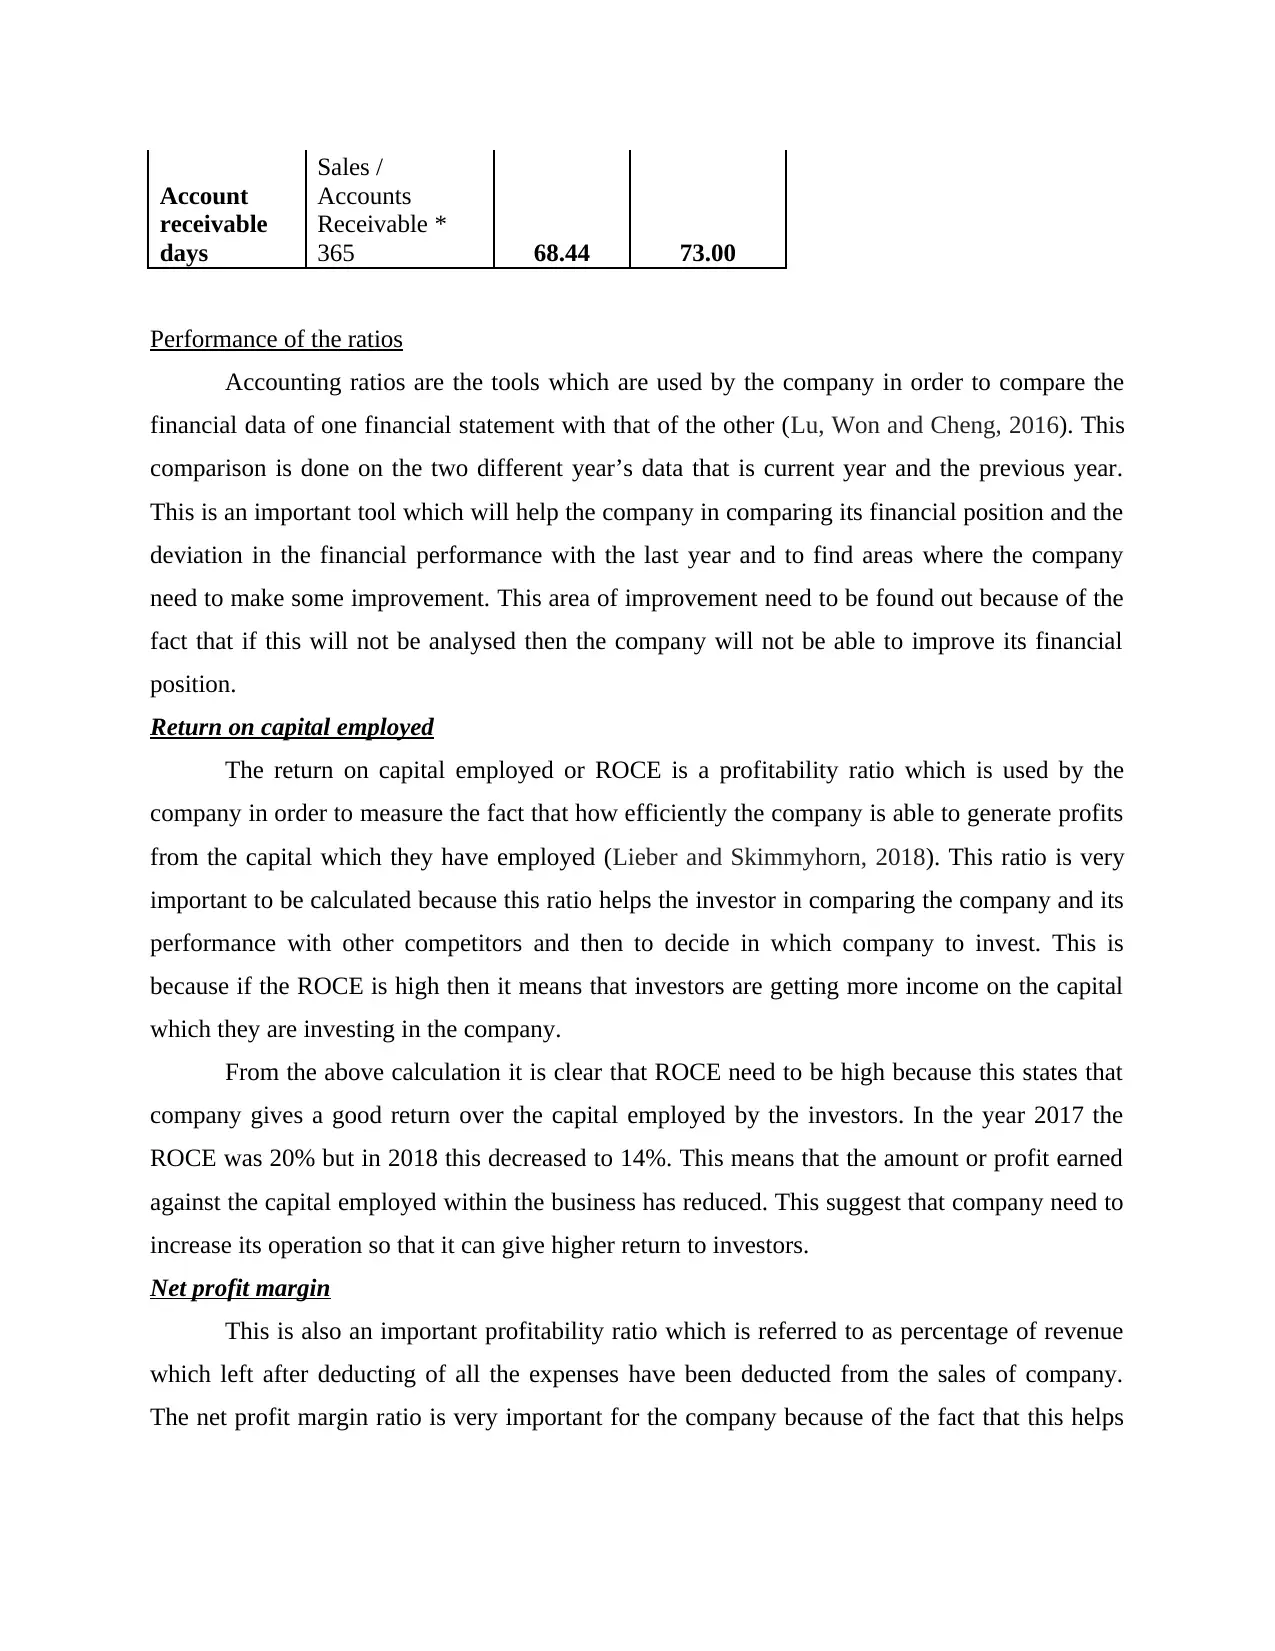
Account
receivable
days
Sales /
Accounts
Receivable *
365 68.44 73.00
Performance of the ratios
Accounting ratios are the tools which are used by the company in order to compare the
financial data of one financial statement with that of the other (Lu, Won and Cheng, 2016). This
comparison is done on the two different year’s data that is current year and the previous year.
This is an important tool which will help the company in comparing its financial position and the
deviation in the financial performance with the last year and to find areas where the company
need to make some improvement. This area of improvement need to be found out because of the
fact that if this will not be analysed then the company will not be able to improve its financial
position.
Return on capital employed
The return on capital employed or ROCE is a profitability ratio which is used by the
company in order to measure the fact that how efficiently the company is able to generate profits
from the capital which they have employed (Lieber and Skimmyhorn, 2018). This ratio is very
important to be calculated because this ratio helps the investor in comparing the company and its
performance with other competitors and then to decide in which company to invest. This is
because if the ROCE is high then it means that investors are getting more income on the capital
which they are investing in the company.
From the above calculation it is clear that ROCE need to be high because this states that
company gives a good return over the capital employed by the investors. In the year 2017 the
ROCE was 20% but in 2018 this decreased to 14%. This means that the amount or profit earned
against the capital employed within the business has reduced. This suggest that company need to
increase its operation so that it can give higher return to investors.
Net profit margin
This is also an important profitability ratio which is referred to as percentage of revenue
which left after deducting of all the expenses have been deducted from the sales of company.
The net profit margin ratio is very important for the company because of the fact that this helps
the company in measuring overall success of the company. The higher profit margin suggests
that business is using right pricing strategies and this help company in increasing high profit.
In case of Alpha Ltd and calculation of the net profit margin it was observed that the
profitability of the company in 2017 was good as the net profit ratio was 12.50%. But this was
not in case of 2018 as in this the profit margin reduced to 8.75% and this means that the profit
earning capacity of the company reduced by 3.75% and this is not a good position. This states
that company need to take measures in improving the sales of company and this can be done
with many different steps and measures.
Current ratio
Current ratio is referred to as the liquidity ratio which is helpful for the company in
measuring the ability of the company to pay its current liabilities with the cash being made from
the current asset (Kim, Gutter and Spangler, 2017). The current ratio measurement is important
for the company because this outline the capacity of company to meet its short term liabilities
with the given current asset and cash for a period of financial year. This is calculated by
deducting the current liabilities from the current assets of the companies.
From the assessment and evaluation of the above calculation and its interpretation it is
clear that if the current ratio of the company is good then it means that company is in position of
paying of the current liabilities with their current asset only. This is in case of year 2017 wherein
the current ratio is 2.35 this means that the current assets are 2.35 times more than the current
liabilities. On the contrary in the year 2018 the current ratio decreased to 0.93 and this states that
the company has only 0.93 times the current asset more than the current liabilities. If the
liabilities are more than the company had to take loans from other people to pay off their current
liabilities.
Average collection period/ debtor collection period
The average collection period is referred to as a ratio which is calculated as the average
of the balance of account receivable by the total credit sales for a period of financial year. This is
the most important ratio for the company who rely majorly on the credit sales and the receivables
(Valaskova, Bartosova and Kubala, 2019). The major importance of this ratio for the company is
that these ratios help the company in predicting the time in which the company is able to recover
all its payment.
⊘ This is a preview!⊘
Do you want full access?
Subscribe today to unlock all pages.
Trusted by 1+ million students worldwide
At time of calculation and its interpretation it was seen that the debtor collection period in
2017 was 68.44 but in 2018 it was 73.00. This data suggest that in the year 2017 the speed of
collecting the receivables was fast as compared to the period of 2018. But in the year 2018 it
increased to 73 which means that the speed or the time taken in receiving the due amount
reduced by 4.56 times. Hence, the performance of Alpha ltd reduced as now the company is able
to recover its money at a slow pace. Also, it is suggested to the company that as they are not able
to recover the more amount so they must stop the credit sales. This is because if credit sales will
not be done then no money needs to be recovered by the company.
Average payable days/ creditors collection period
This is an efficiency ratio which helps the company in calculating the average payment
which the company has to do for all the credit purchases they have made during the financial
period (Greenberg and Hershfield, 2019). Also, known as creditor turnover ratio this indicates
the time involved during the credit sales which is make the current liabilities outstanding fir the
company and this need to be paid. This ratio is important as this indicates the time when the
company is able to pay off all its debts and is in pure liquid position.
With help of calculation of the average payable days it was seen that in 2017 this was 70
but in the year 2018 it was 159. This suggest that in the year 2017 it was good but in the year
2018 it increased drastically which is not at all good for the company. Having this higher
collection period in 2018 suggest that the company is not able to pay off its current asset on time
and in proper manner that is full. Also, this higher number of creditor collection period suggests
that the company is not having proper communication with the consumer and because of this the
sales of company is reducing and for this the company need to take loans from other to run and
operate the business. Hence, because of this the profitability of the company reduces.
CONCLUSION
In the end it is summarised that the calculation and analysis o f the ratios is very essential
for the company in taking the financial decision. This is because the ratios help the company in
analysing the fact that where the company need to improve and this help the company in talking
the decision for the betterment of the company.
Paraphrase This Document
Need a fresh take? Get an instant paraphrase of this document with our AI Paraphraser
REFERENCES
Books and Journals
Greenberg, A.E. and Hershfield, H.E., 2019. Financial decision making. Consumer Psychology
Review. 2(1). pp.17-29.
Hirshleifer, D., Jian, M. and Zhang, H., 2018. Superstition and financial decision
making. Management Science. 64(1). pp.235-252.
Kim, J., Gutter, M.S. and Spangler, T., 2017. Review of family financial decision making:
Suggestions for future research and implications for financial education. Journal of
Financial Counseling and Planning. 28(2). pp.253-267.
Lieber, E.M. and Skimmyhorn, W., 2018. Peer effects in financial decision-making. Journal of
Public Economics. 163. pp.37-59.
Lu, Q., Won, J. and Cheng, J.C., 2016. A financial decision making framework for construction
projects based on 5D Building Information Modeling (BIM). International Journal of
Project Management. 34(1). pp.3-21.
Valaskova, K., Bartosova, V. and Kubala, P., 2019. Behavioural Aspects of the Financial
Decision-Making. Organizacija. 52(1).
1 out of 8
Related Documents


Your All-in-One AI-Powered Toolkit for Academic Success.
+13062052269
info@desklib.com
Available 24*7 on WhatsApp / Email
![[object Object]](/_next/static/media/star-bottom.7253800d.svg)
Unlock your academic potential
© 2024 | Zucol Services PVT LTD | All rights reserved.