Financial Econometric Analysis: CAPM and Regression
Added on 2023-01-12
8 Pages1392 Words22 Views
Financial econometric

Contents
INTRODUCTION...........................................................................................................................1
MAIN BODY..................................................................................................................................1
CAPM..........................................................................................................................................1
Regression analysis......................................................................................................................2
CONCLUSION................................................................................................................................5
REFERENCES................................................................................................................................6
INTRODUCTION
Financial econometrics is the branch of economics in which is concerned with mathematical
methods (Chang, McAleer and Wang, 2018). In context of this concept, the panel data is a
combination of multi dimensional data which is recorded over a time. The main aim of this
report is to construct a data and then analyse it using appropriate regression analysis. For this
purpose, a panel data is created which has stock prices for 8 large scale companies. This data is
recorded over the period of two years. Furthermore, this data is used to run regression test using
SPSS so that theory of CAPM can be verified and regression results can be analysed.
MAIN BODY
CAPM
The panel data which has been used has stock prices of 8 countries which are Amazon,
AutoZone Inc., Hilton Worldwide Holdings Inc. (HLT), MGM Resorts International (MGM),
AT&T Inc. (T), Twitter, Inc. (TWTR), Verizon Communications Inc. (VZ) and The Interpublic
Group of Companies, Inc. Among all these companies, Amazon is considered as a dependent
variable in order to analyse the relationship between the prices of stocks of each company with
Amazon.
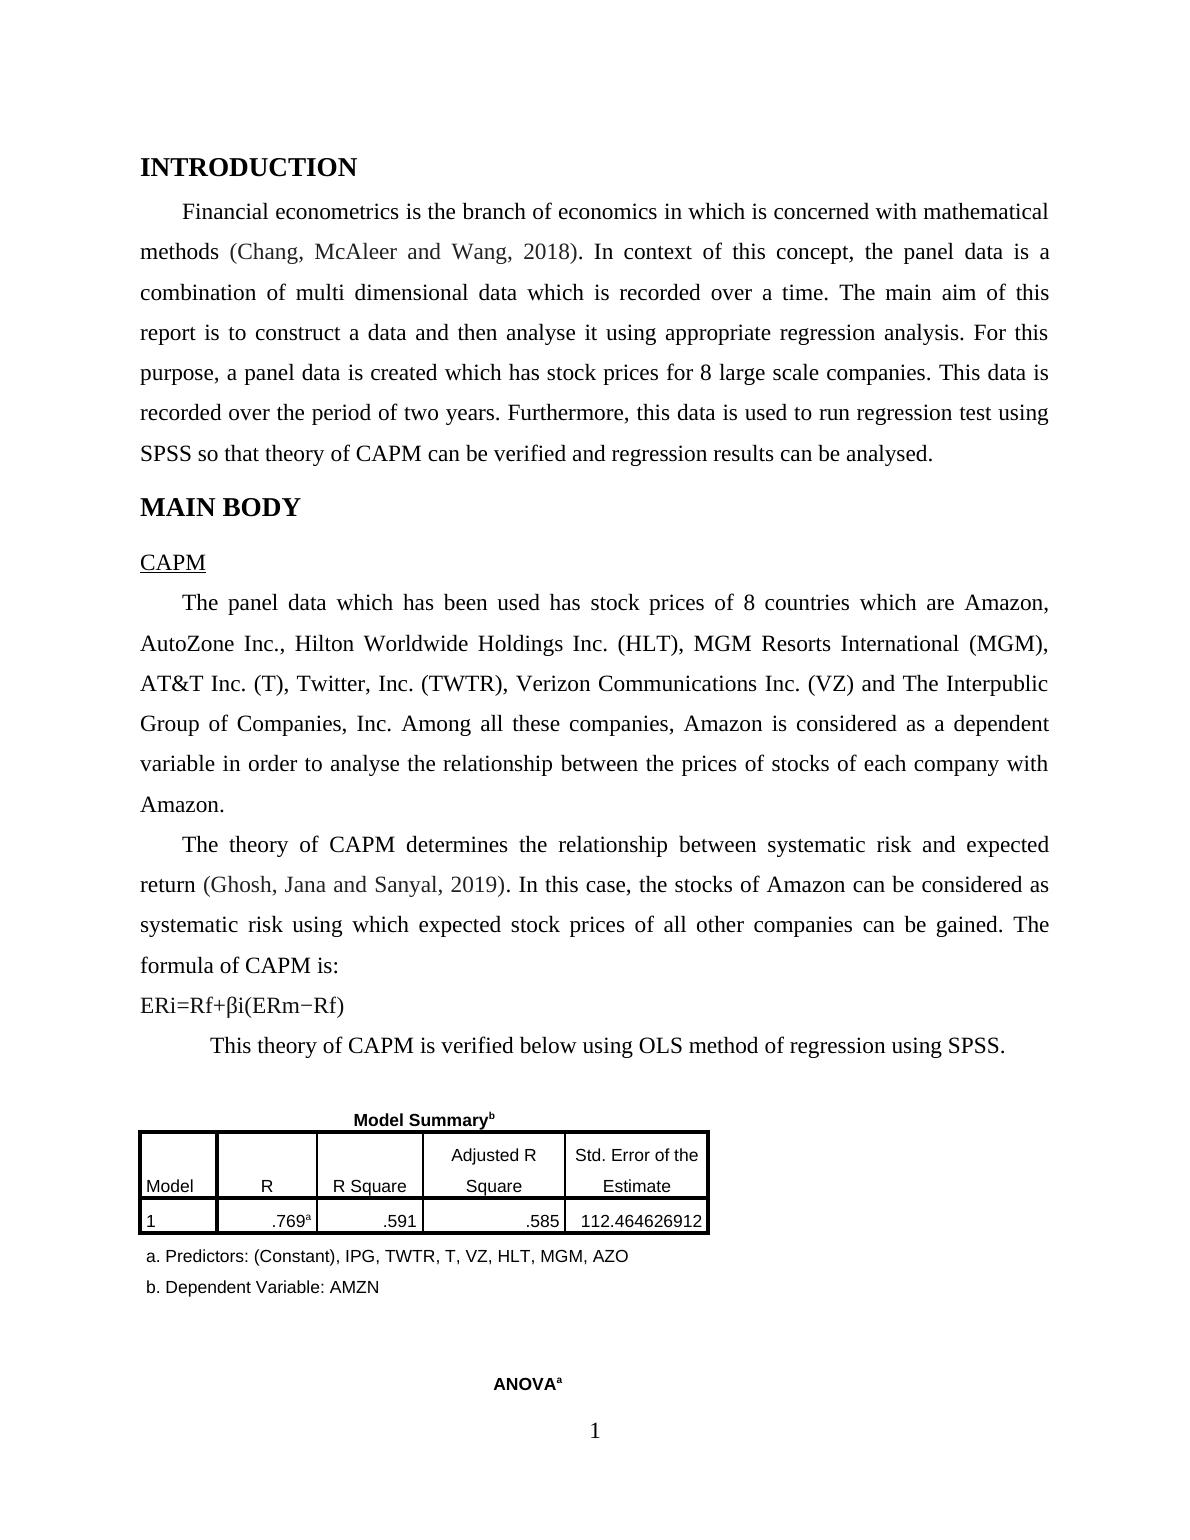
The theory of CAPM determines the relationship between systematic risk and expected
return (Ghosh, Jana and Sanyal, 2019). In this case, the stocks of Amazon can be considered as
systematic risk using which expected stock prices of all other companies can be gained. The
formula of CAPM is:
ERi=Rf+βi(ERm−Rf)
This theory of CAPM is verified below using OLS method of regression using SPSS.
Model Summaryb
Model R R Square
Adjusted R
Square
Std. Error of the
Estimate
1 .769a .591 .585 112.464626912
a. Predictors: (Constant), IPG, TWTR, T, VZ, HLT, MGM, AZO
b. Dependent Variable: AMZN
ANOVAa
1
Financial econometrics is the branch of economics in which is concerned with mathematical
methods (Chang, McAleer and Wang, 2018). In context of this concept, the panel data is a
combination of multi dimensional data which is recorded over a time. The main aim of this
report is to construct a data and then analyse it using appropriate regression analysis. For this
purpose, a panel data is created which has stock prices for 8 large scale companies. This data is
recorded over the period of two years. Furthermore, this data is used to run regression test using
SPSS so that theory of CAPM can be verified and regression results can be analysed.
MAIN BODY
CAPM
The panel data which has been used has stock prices of 8 countries which are Amazon,
AutoZone Inc., Hilton Worldwide Holdings Inc. (HLT), MGM Resorts International (MGM),
AT&T Inc. (T), Twitter, Inc. (TWTR), Verizon Communications Inc. (VZ) and The Interpublic
Group of Companies, Inc. Among all these companies, Amazon is considered as a dependent
variable in order to analyse the relationship between the prices of stocks of each company with
Amazon.
The theory of CAPM determines the relationship between systematic risk and expected
return (Ghosh, Jana and Sanyal, 2019). In this case, the stocks of Amazon can be considered as
systematic risk using which expected stock prices of all other companies can be gained. The
formula of CAPM is:
ERi=Rf+βi(ERm−Rf)
This theory of CAPM is verified below using OLS method of regression using SPSS.
Model Summaryb
Model R R Square
Adjusted R
Square
Std. Error of the
Estimate
1 .769a .591 .585 112.464626912
a. Predictors: (Constant), IPG, TWTR, T, VZ, HLT, MGM, AZO
b. Dependent Variable: AMZN
ANOVAa
1
End of preview
Want to access all the pages? Upload your documents or become a member.
Related Documents
Testing the CAPM Theory Using Time Series Regression Analysislg...
|18
|3072
|254
Data Analysis Project for Deskliblg...
|9
|2087
|218