Financial & Economic Interpretation and Communication
VerifiedAdded on 2022/08/12
|15
|3153
|18
AI Summary
Contribute Materials
Your contribution can guide someone’s learning journey. Share your
documents today.
Fin
0
SANTOS LIMITED
Financial & Economic Interpretation and Communication
2/17/2020
0
SANTOS LIMITED
Financial & Economic Interpretation and Communication
2/17/2020
Secure Best Marks with AI Grader
Need help grading? Try our AI Grader for instant feedback on your assignments.
Fin
1
Contents
Analysis...........................................................................................................................................3
Interpretations..................................................................................................................................6
Conclusion.......................................................................................................................................7
Resource B.......................................................................................................................................9
Core business areas and geographical locations..............................................................................9
Financial results improved or changed............................................................................................9
Evidences from the other sources....................................................................................................9
Current business strategy and target market....................................................................................9
Current and future market potential...............................................................................................10
Strength of management team.......................................................................................................10
Remuneration trends from last year to this year............................................................................11
Difference in the wages earned in the competitor business...........................................................11
Current management structure and ownership structure...............................................................11
Non-wage related benefits.............................................................................................................12
References......................................................................................................................................13
Fin
2
Resource A – Financial Report Content
Executive summary
Santos limited was founded on the 18 March 1954. It is the ASX public listed company which
deals in the oil and gas products. The company is the second-largest producer of Australia and
has headquartered in South Australia. The company deals in products like gas and petroleum,
coal steam, LPG gas crude oil, petroleum exploration, etc. (Churet and Eccles, 2014). The key
business activity of the company is that they are suppliers and the producer of the gas to all the
states and territories of the Australian place. In this report, the financial performance of the
company has analyzed which has enhanced from the previous year. The purpose of analyzing the
financial report is to analyses the financial performance that whether the company is earning the
profit or not.
Fin
3
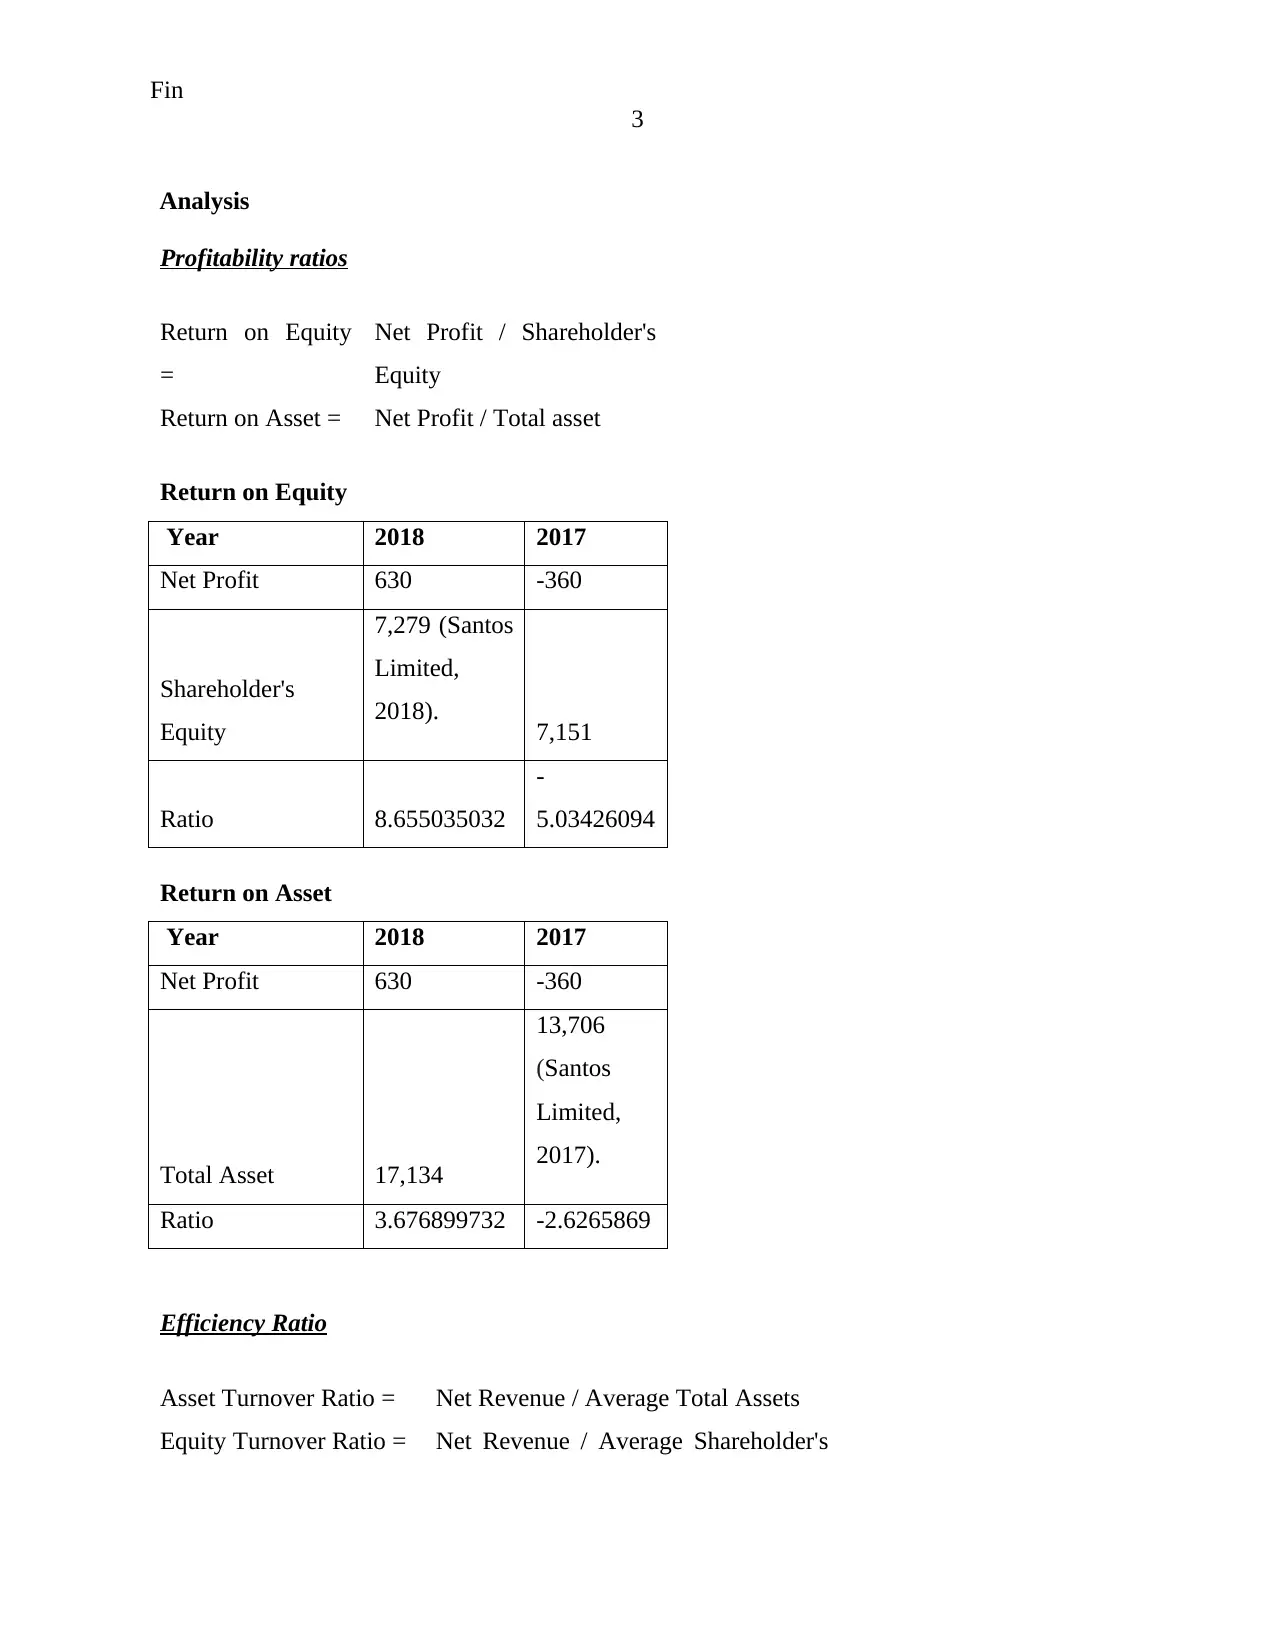
Analysis
Profitability ratios
Return on Equity
=
Net Profit / Shareholder's
Equity
Return on Asset = Net Profit / Total asset
Return on Equity
Year 2018 2017
Net Profit 630 -360
Shareholder's
Equity
7,279 (Santos
Limited,
2018). 7,151
Ratio 8.655035032
-
5.03426094
Return on Asset
Year 2018 2017
Net Profit 630 -360
Total Asset 17,134
13,706
(Santos
Limited,
2017).
Ratio 3.676899732 -2.6265869
Efficiency Ratio
Asset Turnover Ratio = Net Revenue / Average Total Assets
Equity Turnover Ratio = Net Revenue / Average Shareholder's
3
Analysis
Profitability ratios
Return on Equity
=
Net Profit / Shareholder's
Equity
Return on Asset = Net Profit / Total asset
Return on Equity
Year 2018 2017
Net Profit 630 -360
Shareholder's
Equity
7,279 (Santos
Limited,
2018). 7,151
Ratio 8.655035032
-
5.03426094
Return on Asset
Year 2018 2017
Net Profit 630 -360
Total Asset 17,134
13,706
(Santos
Limited,
2017).
Ratio 3.676899732 -2.6265869
Efficiency Ratio
Asset Turnover Ratio = Net Revenue / Average Total Assets
Equity Turnover Ratio = Net Revenue / Average Shareholder's
Secure Best Marks with AI Grader
Need help grading? Try our AI Grader for instant feedback on your assignments.
Fin
4
Equity
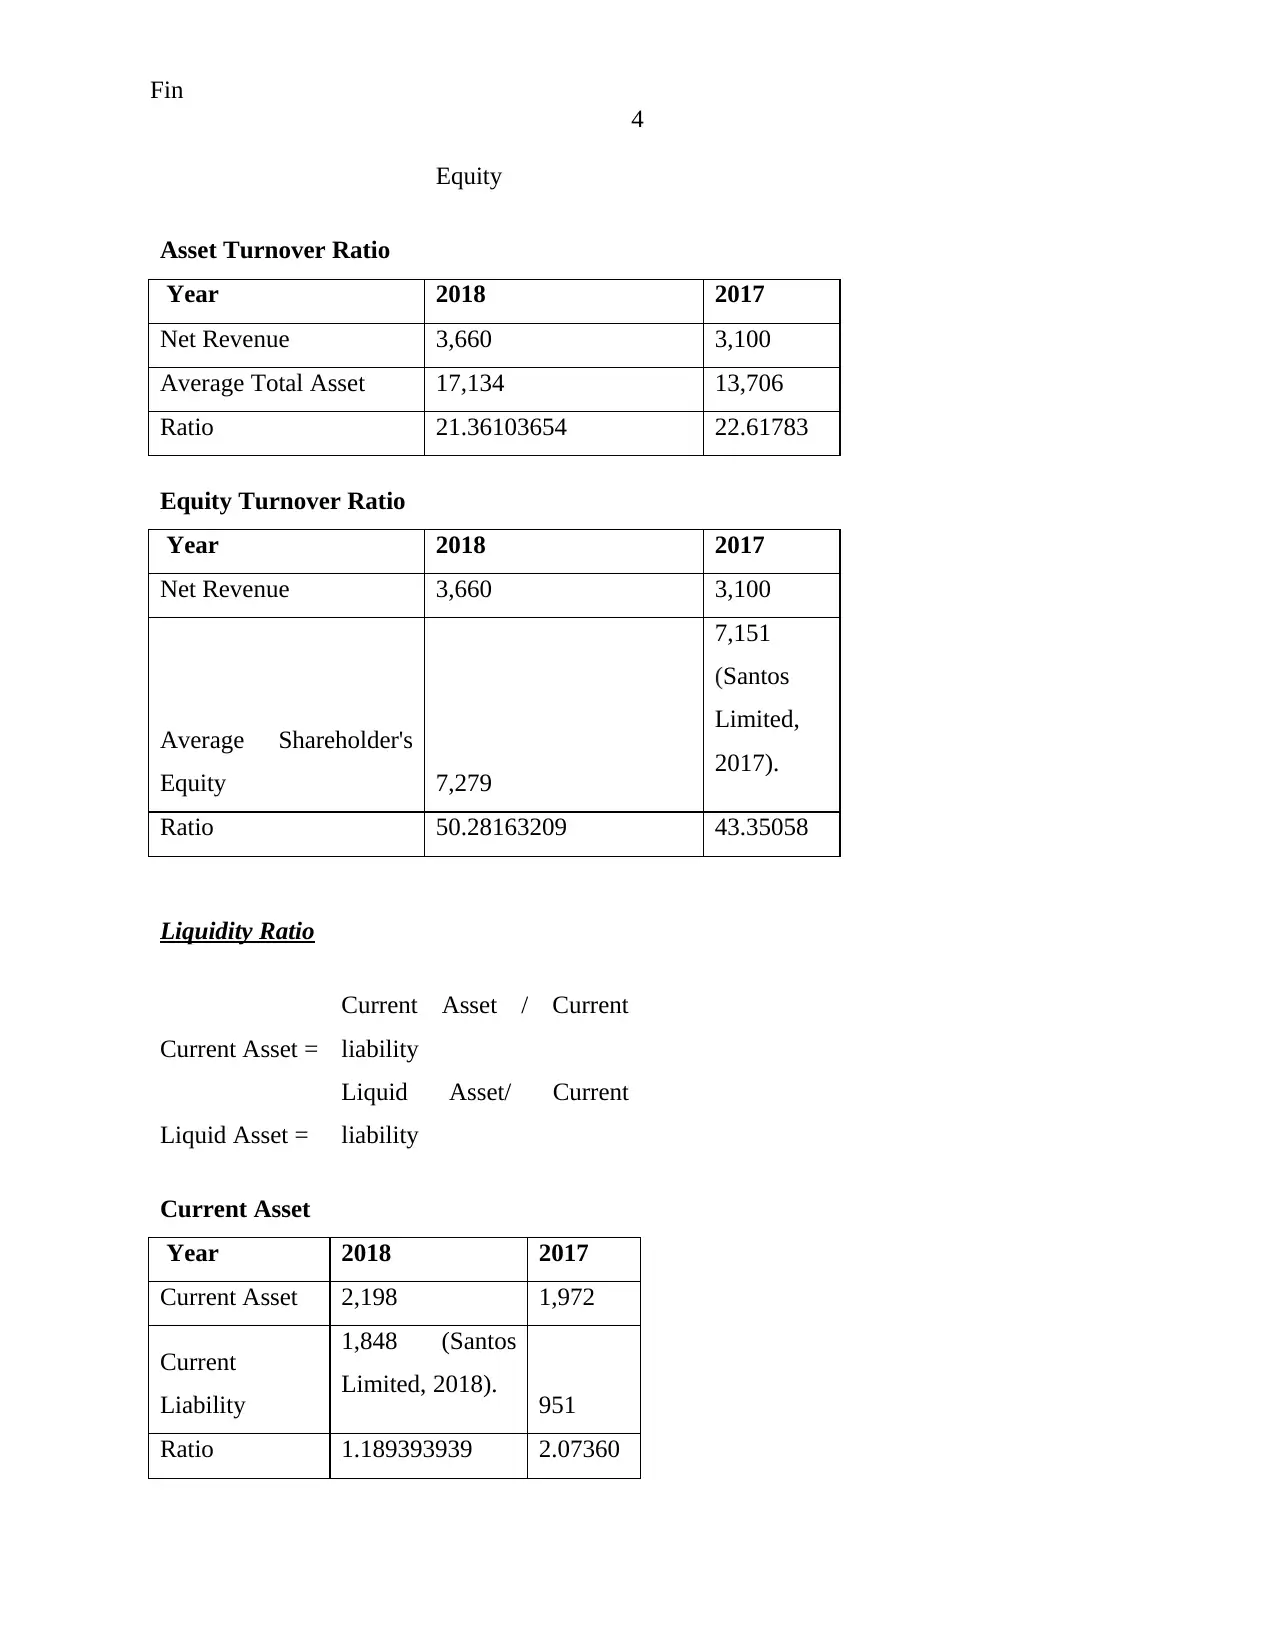
Asset Turnover Ratio
Year 2018 2017
Net Revenue 3,660 3,100
Average Total Asset 17,134 13,706
Ratio 21.36103654 22.61783
Equity Turnover Ratio
Year 2018 2017
Net Revenue 3,660 3,100
Average Shareholder's
Equity 7,279
7,151
(Santos
Limited,
2017).
Ratio 50.28163209 43.35058
Liquidity Ratio
Current Asset =
Current Asset / Current
liability
Liquid Asset =
Liquid Asset/ Current
liability
Current Asset
Year 2018 2017
Current Asset 2,198 1,972
Current
Liability
1,848 (Santos
Limited, 2018). 951
Ratio 1.189393939 2.07360
4
Equity
Asset Turnover Ratio
Year 2018 2017
Net Revenue 3,660 3,100
Average Total Asset 17,134 13,706
Ratio 21.36103654 22.61783
Equity Turnover Ratio
Year 2018 2017
Net Revenue 3,660 3,100
Average Shareholder's
Equity 7,279
7,151
(Santos
Limited,
2017).
Ratio 50.28163209 43.35058
Liquidity Ratio
Current Asset =
Current Asset / Current
liability
Liquid Asset =
Liquid Asset/ Current
liability
Current Asset
Year 2018 2017
Current Asset 2,198 1,972
Current
Liability
1,848 (Santos
Limited, 2018). 951
Ratio 1.189393939 2.07360
Fin
5
7
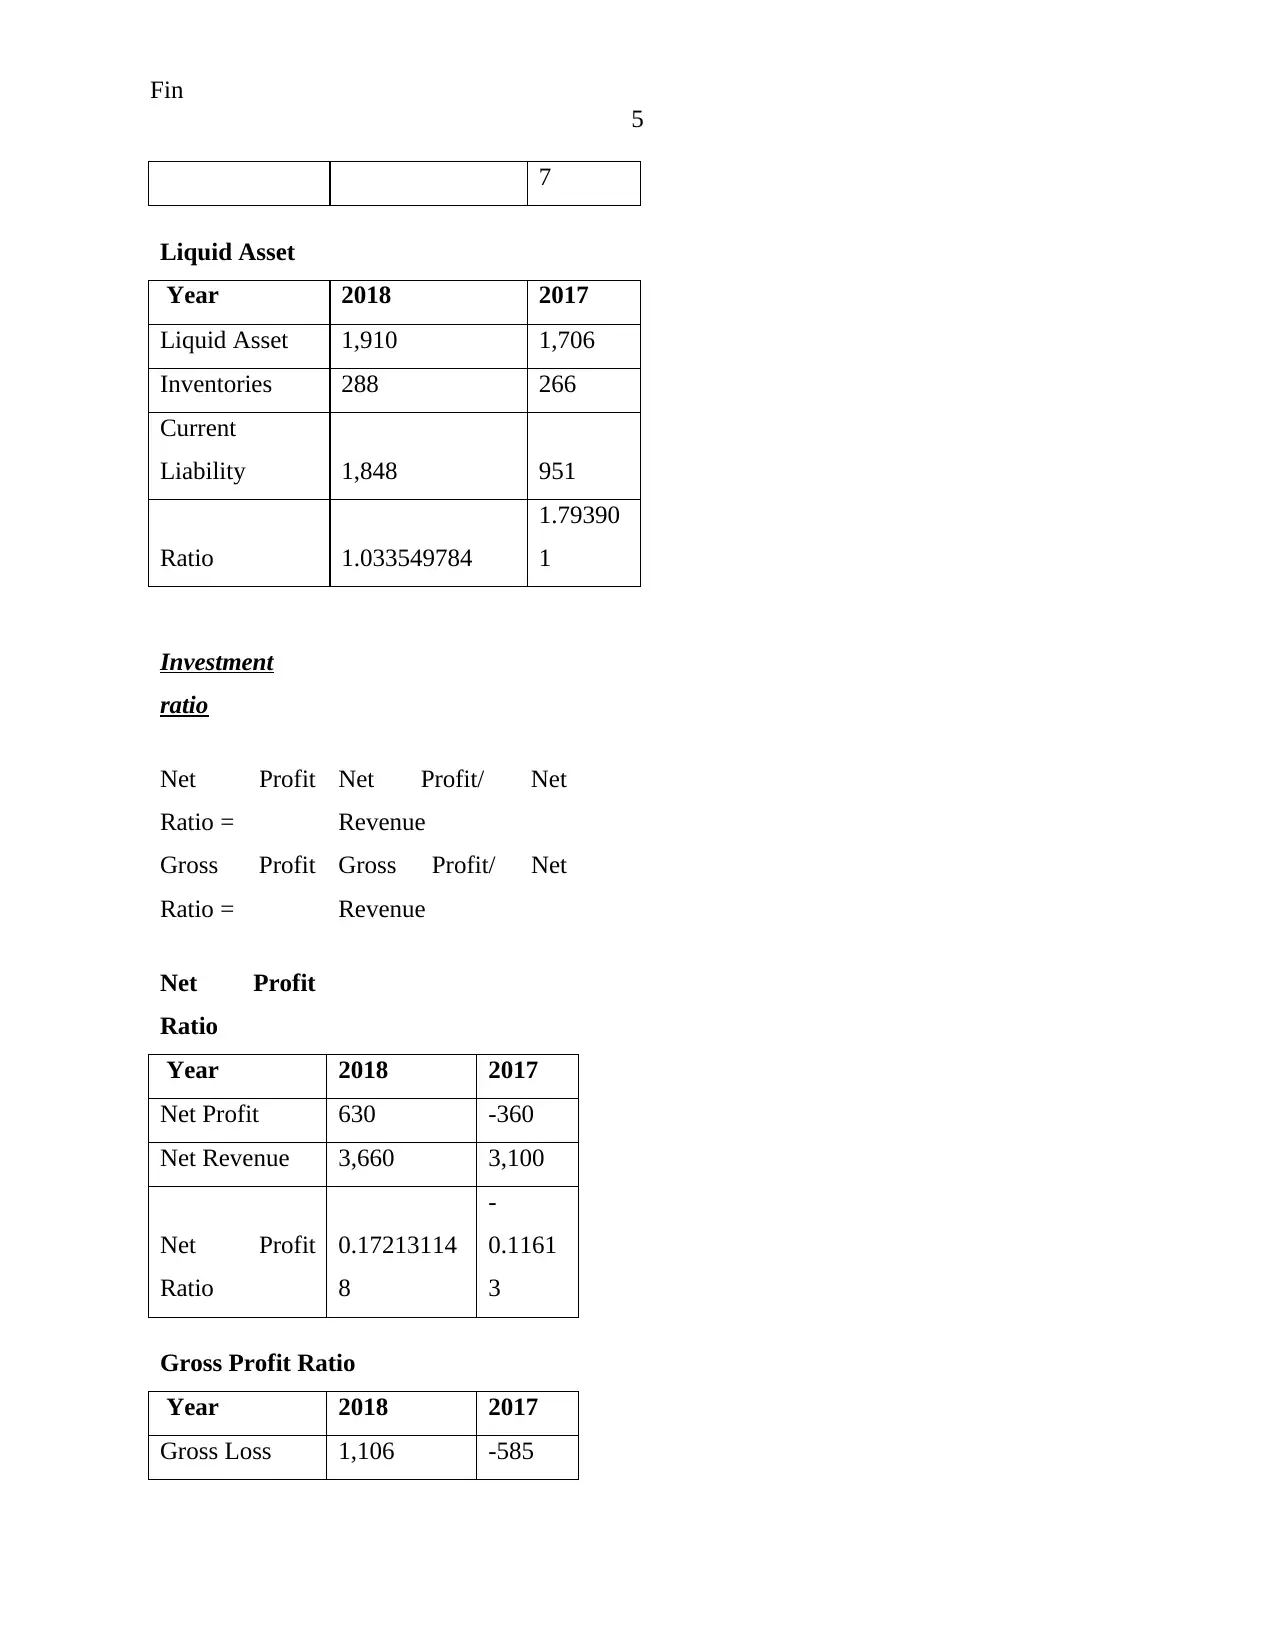
Liquid Asset
Year 2018 2017
Liquid Asset 1,910 1,706
Inventories 288 266
Current
Liability 1,848 951
Ratio 1.033549784
1.79390
1
Investment
ratio
Net Profit
Ratio =
Net Profit/ Net
Revenue
Gross Profit
Ratio =
Gross Profit/ Net
Revenue
Net Profit
Ratio
Year 2018 2017
Net Profit 630 -360
Net Revenue 3,660 3,100
Net Profit
Ratio
0.17213114
8
-
0.1161
3
Gross Profit Ratio
Year 2018 2017
Gross Loss 1,106 -585
5
7
Liquid Asset
Year 2018 2017
Liquid Asset 1,910 1,706
Inventories 288 266
Current
Liability 1,848 951
Ratio 1.033549784
1.79390
1
Investment
ratio
Net Profit
Ratio =
Net Profit/ Net
Revenue
Gross Profit
Ratio =
Gross Profit/ Net
Revenue
Net Profit
Ratio
Year 2018 2017
Net Profit 630 -360
Net Revenue 3,660 3,100
Net Profit
Ratio
0.17213114
8
-
0.1161
3
Gross Profit Ratio
Year 2018 2017
Gross Loss 1,106 -585
Fin
6
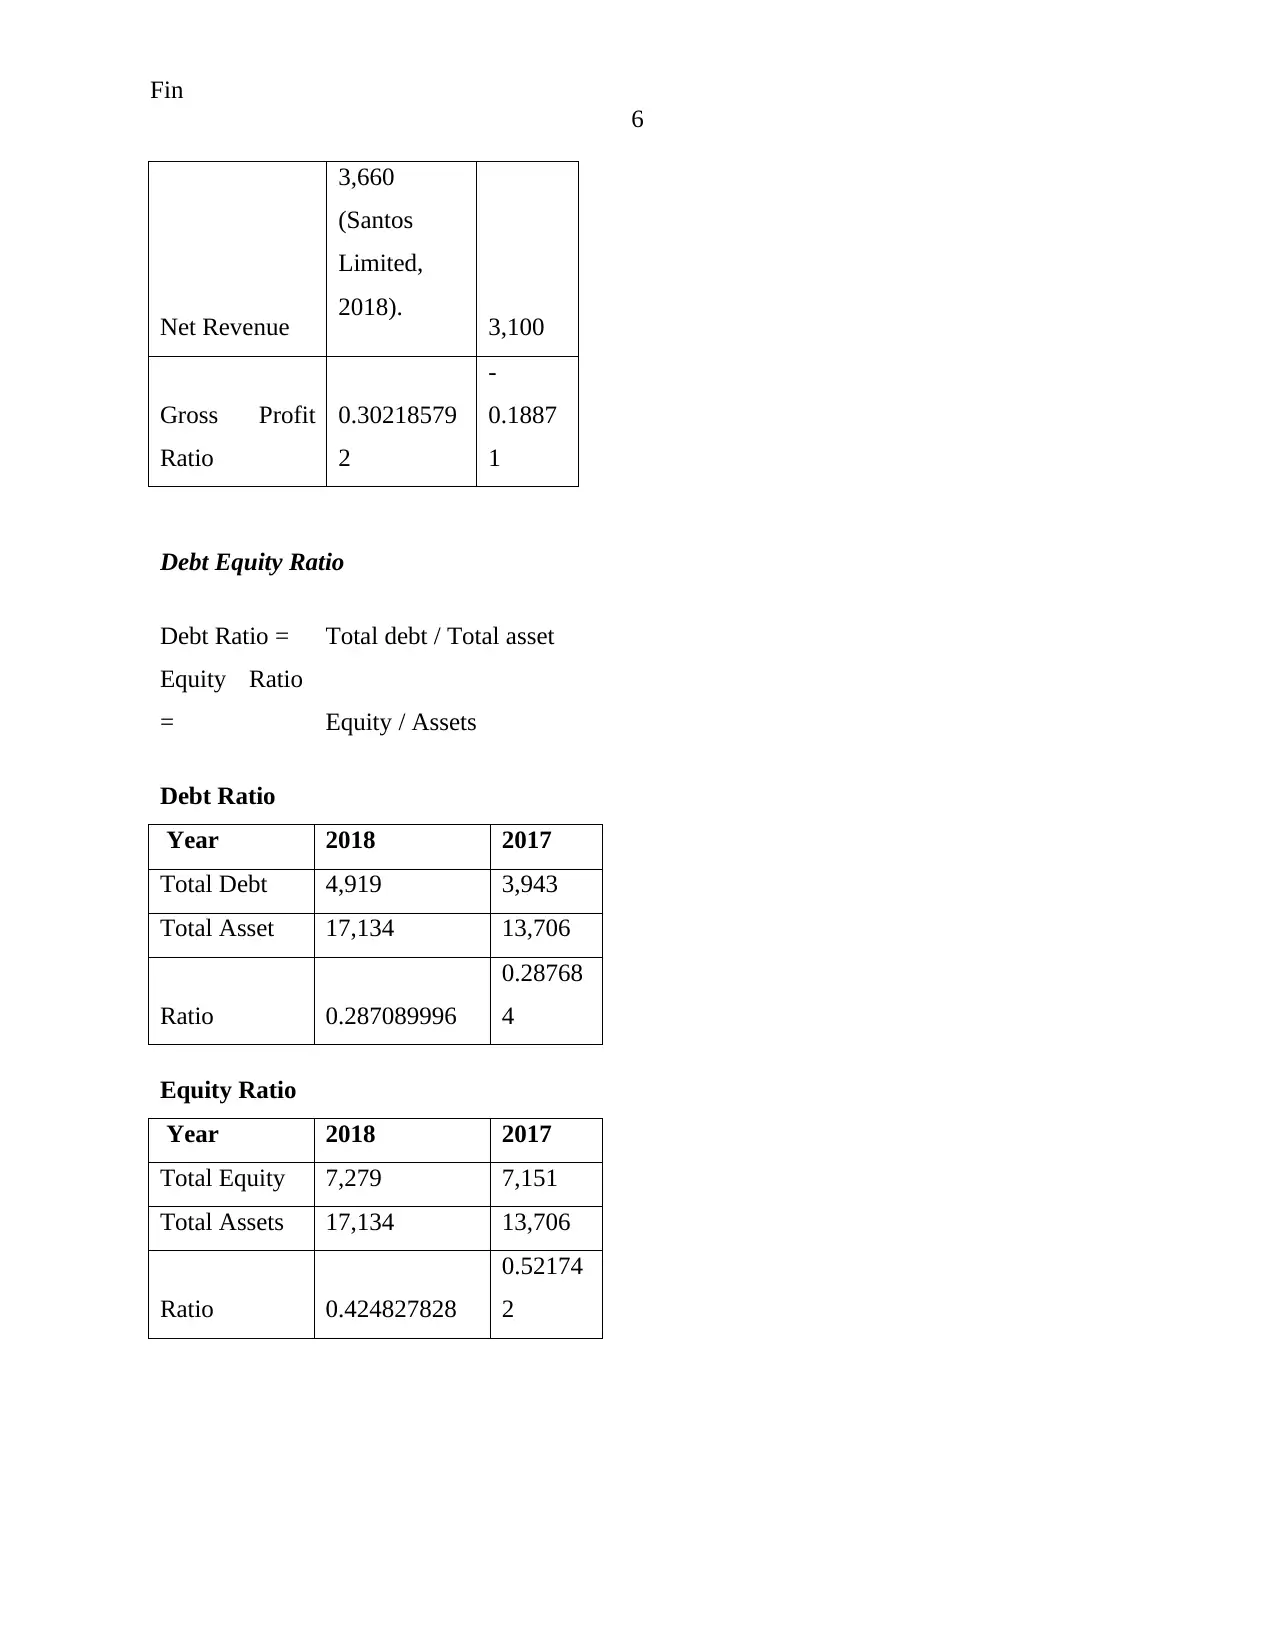
Net Revenue
3,660
(Santos
Limited,
2018). 3,100
Gross Profit
Ratio
0.30218579
2
-
0.1887
1
Debt Equity Ratio
Debt Ratio = Total debt / Total asset
Equity Ratio
= Equity / Assets
Debt Ratio
Year 2018 2017
Total Debt 4,919 3,943
Total Asset 17,134 13,706
Ratio 0.287089996
0.28768
4
Equity Ratio
Year 2018 2017
Total Equity 7,279 7,151
Total Assets 17,134 13,706
Ratio 0.424827828
0.52174
2
6
Net Revenue
3,660
(Santos
Limited,
2018). 3,100
Gross Profit
Ratio
0.30218579
2
-
0.1887
1
Debt Equity Ratio
Debt Ratio = Total debt / Total asset
Equity Ratio
= Equity / Assets
Debt Ratio
Year 2018 2017
Total Debt 4,919 3,943
Total Asset 17,134 13,706
Ratio 0.287089996
0.28768
4
Equity Ratio
Year 2018 2017
Total Equity 7,279 7,151
Total Assets 17,134 13,706
Ratio 0.424827828
0.52174
2
Paraphrase This Document
Need a fresh take? Get an instant paraphrase of this document with our AI Paraphraser
Fin
7
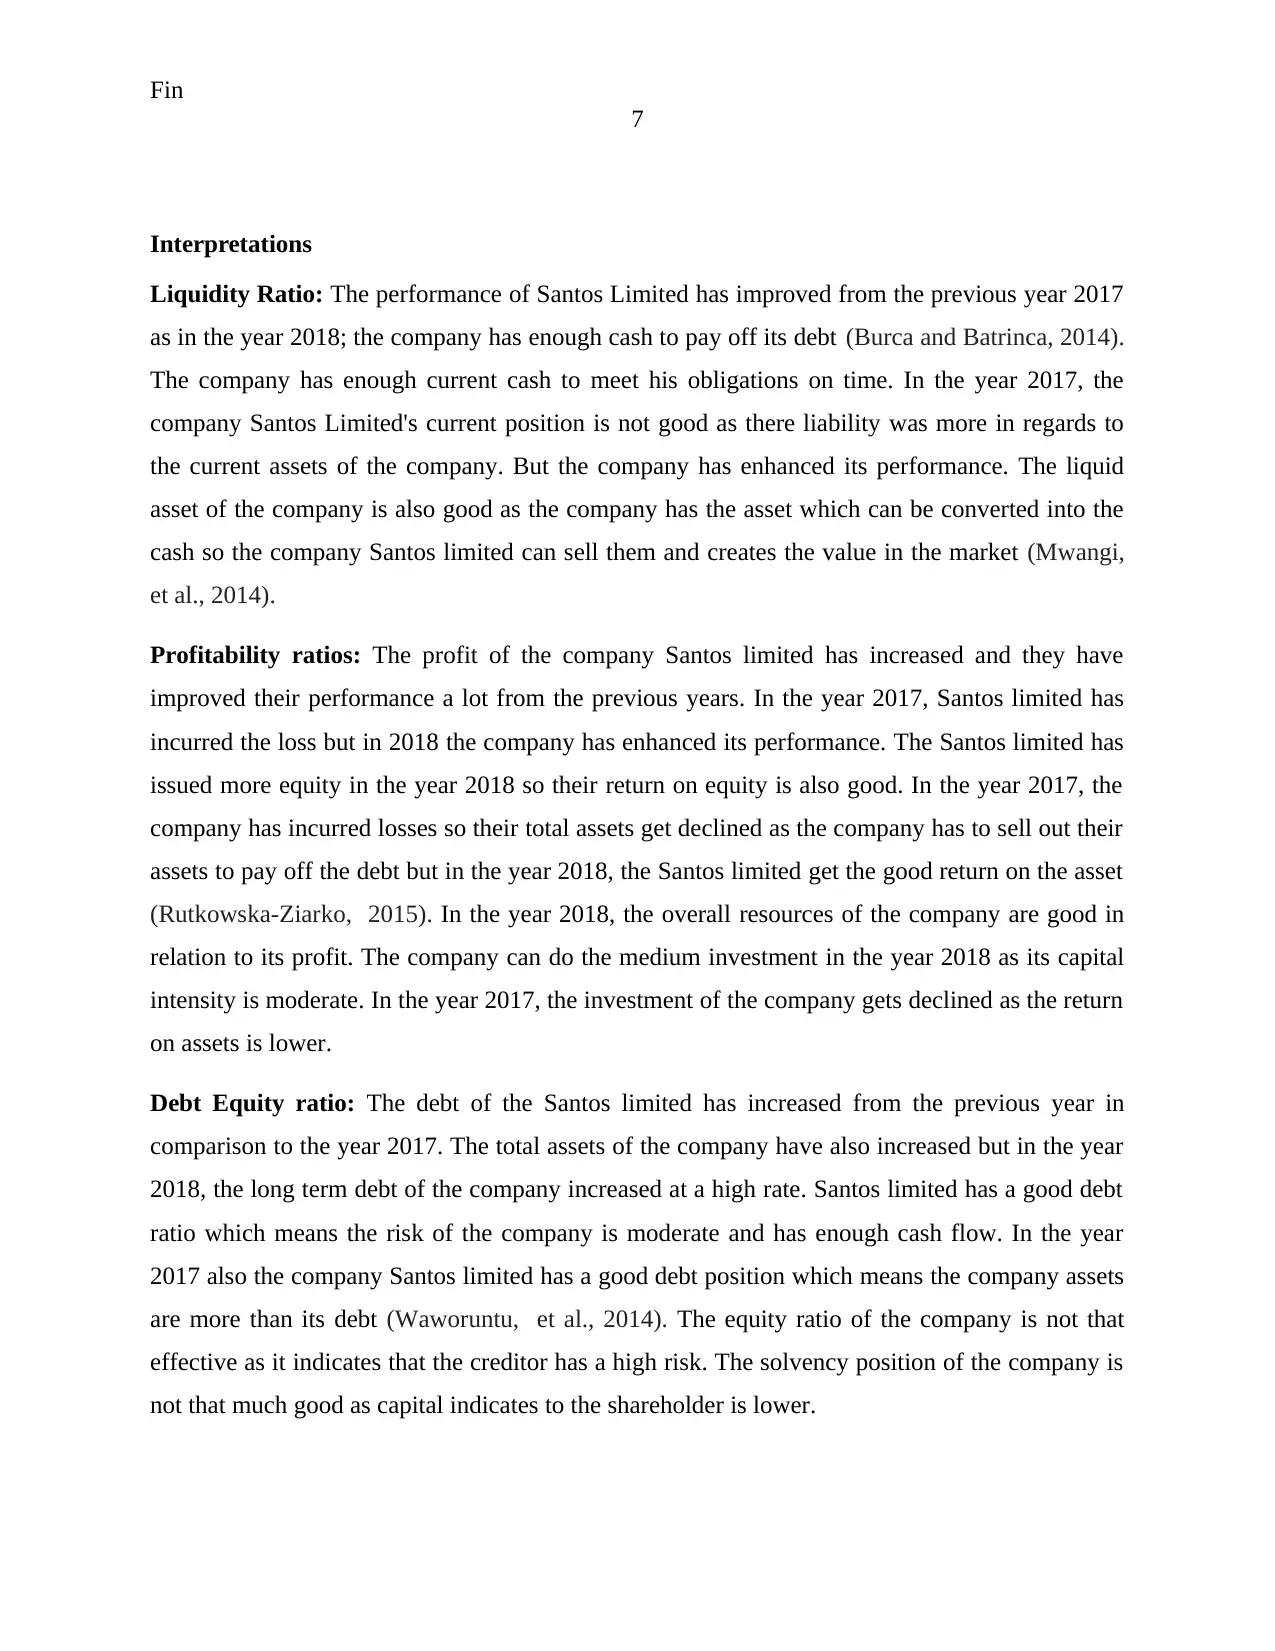
Interpretations
Liquidity Ratio: The performance of Santos Limited has improved from the previous year 2017
as in the year 2018; the company has enough cash to pay off its debt (Burca and Batrinca, 2014).
The company has enough current cash to meet his obligations on time. In the year 2017, the
company Santos Limited's current position is not good as there liability was more in regards to
the current assets of the company. But the company has enhanced its performance. The liquid
asset of the company is also good as the company has the asset which can be converted into the
cash so the company Santos limited can sell them and creates the value in the market (Mwangi,
et al., 2014).
Profitability ratios: The profit of the company Santos limited has increased and they have
improved their performance a lot from the previous years. In the year 2017, Santos limited has
incurred the loss but in 2018 the company has enhanced its performance. The Santos limited has
issued more equity in the year 2018 so their return on equity is also good. In the year 2017, the
company has incurred losses so their total assets get declined as the company has to sell out their
assets to pay off the debt but in the year 2018, the Santos limited get the good return on the asset
(Rutkowska-Ziarko, 2015). In the year 2018, the overall resources of the company are good in
relation to its profit. The company can do the medium investment in the year 2018 as its capital
intensity is moderate. In the year 2017, the investment of the company gets declined as the return
on assets is lower.
Debt Equity ratio: The debt of the Santos limited has increased from the previous year in
comparison to the year 2017. The total assets of the company have also increased but in the year
2018, the long term debt of the company increased at a high rate. Santos limited has a good debt
ratio which means the risk of the company is moderate and has enough cash flow. In the year
2017 also the company Santos limited has a good debt position which means the company assets
are more than its debt (Waworuntu, et al., 2014). The equity ratio of the company is not that
effective as it indicates that the creditor has a high risk. The solvency position of the company is
not that much good as capital indicates to the shareholder is lower.
7
Interpretations
Liquidity Ratio: The performance of Santos Limited has improved from the previous year 2017
as in the year 2018; the company has enough cash to pay off its debt (Burca and Batrinca, 2014).
The company has enough current cash to meet his obligations on time. In the year 2017, the
company Santos Limited's current position is not good as there liability was more in regards to
the current assets of the company. But the company has enhanced its performance. The liquid
asset of the company is also good as the company has the asset which can be converted into the
cash so the company Santos limited can sell them and creates the value in the market (Mwangi,
et al., 2014).
Profitability ratios: The profit of the company Santos limited has increased and they have
improved their performance a lot from the previous years. In the year 2017, Santos limited has
incurred the loss but in 2018 the company has enhanced its performance. The Santos limited has
issued more equity in the year 2018 so their return on equity is also good. In the year 2017, the
company has incurred losses so their total assets get declined as the company has to sell out their
assets to pay off the debt but in the year 2018, the Santos limited get the good return on the asset
(Rutkowska-Ziarko, 2015). In the year 2018, the overall resources of the company are good in
relation to its profit. The company can do the medium investment in the year 2018 as its capital
intensity is moderate. In the year 2017, the investment of the company gets declined as the return
on assets is lower.
Debt Equity ratio: The debt of the Santos limited has increased from the previous year in
comparison to the year 2017. The total assets of the company have also increased but in the year
2018, the long term debt of the company increased at a high rate. Santos limited has a good debt
ratio which means the risk of the company is moderate and has enough cash flow. In the year
2017 also the company Santos limited has a good debt position which means the company assets
are more than its debt (Waworuntu, et al., 2014). The equity ratio of the company is not that
effective as it indicates that the creditor has a high risk. The solvency position of the company is
not that much good as capital indicates to the shareholder is lower.
Fin
8
Investment ratio: The investment ratio of the company is good in the year 2018 but in the year
2017, The Santos limited financial position was not good. The investors are not investing in the
year 2017 as the company has incurred the huge loss but in the next year 2018, the company has
improved their performance (Klieštik, et al., 2015). The sales in the company for oil and gas
have increased in the year 2018 and it results in giving a higher net profit to the company. The
investors can invest in the year 2018 to get a good return and dividend.
Conclusion
From the above report, it is concluded that the financial performance of the Santos Limited
company is good in the year 2018 but in the year 2017, the company has faced many challenges.
In the year 2017, the revenues of the company are declining and it results in a decline their profit.
The debt position of the company is good as the company has enough liquidity to pay off its
debt. The Santos limited has issued more equity in the year 2018 so their return on equity is also
good which has clearly stated in this report. The liquid asset of the company is also good as the
company has the asset which can be converted into the cash so the company Santos limited can
sold them and creates the value in the market. The sales in the company for oil and gas have
increased in the year 2018 and it results in giving a higher net profit to the company. The
investors can invest in the year 2018 to get a good return and dividend. The overall resources of
the company are good in relation to its profit. The company can do the medium investment in the
year 2018 as its capital intensity is moderate.
Fin
9
Resource B
Core business areas and geographical locations
The core business area of the company in Australia where the company located and worked as
per the requirements of the people. Santos is an Australian Energy Limited company that works
in the production of oil and gas. The other geographical locations of Santos Limited are north-
east South Australia, South West Queensland, Adelaide and South Australia (Pirzada, et al.,
2015).
Financial results improved or changed
The financial performance of Santos limited has improved from the previous year 2017 and there
were many changes that have taken place in the company. Earlier the company is incurring
losses but in the year 2018, the company has increased its revenues and it results in enhancing its
profit (Hill, 2010). The long term debt of the company has increased in 2018 so it is the major
change that has taken place. The liquid asset of the company is also good as the company has the
asset which can be converted into the cash and can pay off their short term obligation on time.
Evidence from the other sources
The source of finance has increased in the company 2018 as a comparison to the year 2017 and
major evidence of that is the financial equity of the company. The long term debt of the company
has increased in the year 2018 which shows that the company has risen its funding from the other
sources to fulfill the functioning of the company (Jaafar and James, 2014).
Current business strategy and target market
The main business strategy followed by Santos is a three-phase strategy that includes three
phases which are building, transform and grow (Martin, et al., 2016). The company transforms
the new leadership team and maintains a better performance of the business. The company
focuses on natural gas assets. This strategy increases production and increases gas supply.
There are several key points considered in the target market of the company which are discussed
below-
Target market based on psychographic segmentation
Secure Best Marks with AI Grader
Need help grading? Try our AI Grader for instant feedback on your assignments.
Fin
10
Target market based on brand preference
Target market based on the decision process
Target market based on product usage
Yes, there is a specific skillset required of employees of the company to improve the overall
operations of the company and it also includes several marketing benefits.
Current and future market potential
The Santos limited is an Australian energy company that current position is related with that it is
the second-largest independent oil and gas producer in Australia, as per the analysis of 2018, the
current revenue of the company is 366 crores USD. The current stock price of the company is
STO (ASX) A$8.13 -0.06 (-0.73%).
The company wants to improve its position in the future as the future market potential. The
company needs to attain more profits in the future and need to gain consumers in the Australian
market (Richard, et al., 2019).
The global events give a large impact on the company as it majorly affects the overall society of
the gas and oil production and affects the production areas of the company. The global events
occurred in the specific areas of Australia that are Adelaide, South Australia and many more.
Strength of management team
There are several strengths of the management team that provide different benefits to the
company. Some of the major strengths are:
Communication: This strength improves the attraction of the consumers
Delegation: The tasks of the company become easier for employees and achieve
employee motivation.
Planning: All the action plans get improved by the planning process of the management
team.
Organizing: The multi-tasks capability is increased and it increases the profitability of the
company.
Fin
11
Remuneration trends from last year to this year
There is no such change in the remuneration trend from the previous to this year. The company
has followed the trend like the top performer or the employees in the company will get the extra
bonus so that every employee will work full of enthusiasm (Qingjin and Jian, 2017). The Santos
limited has adopted the trend of hiring the boomerang employees so that the growth of the
company rises and sales of the company also enhanced. The rewards have increased in the year
2018 and in 2017 there were only a few rewards so this remuneration scheme will motivate the
employees.
The difference in the wages earned in the competitor business
Yes, the wages of every company is different. The competitor of the Santos limited is the
Apache, Marathon oil and their wages of the employees differ from Santos limited. The company
has provided several other services to their employees other than the wages so their salary range
is moderate while their competitor companies are not providing the other several services like
fringe benefits so there salary or wages differs (Richard, et al., 2019). Santos limited is the
second-best producer and seller in Australia so the wages provided by the company to its
employees are higher than its competitors.
Current management structure and ownership structure
The management structure of Santos is different from other companies as in the company leaders
and managers have the power to operate the functions. Santos leadership includes the board
members and management leadership team (Senasi and Khalil, 2015). Both the teams analyze
the overall performance of the company. They only are responsible to increase the value of the
shareholders.
The ownership structure of Santos is also different in nature as the structure of ownership is
different in individual investors. The ownership structure affects share performance. The
ownership structure maintains by the board members of the organization that manages the
different functions of the company.
Fin
12
Non-wage related benefits
Yes, there are the non-wage benefits also in the company Santos limited such as fringe benefits,
free traveling, free uniforms, etc. There are several benefits that were given to the employees of
the company other than the salary such as free coffee, free services of hospitality once in a year
and many others (Liu, et al., 2019). This benefit helps in motivating the employees to work in the
company with the full of efficiency. The company has given the medical services to their
employees and also give life insurance so that their employees can work with full of
concentration.
Paraphrase This Document
Need a fresh take? Get an instant paraphrase of this document with our AI Paraphraser
Fin
13
References
Burca, A.M. and Batrinca, G., 2014. The determinants of financial performance in the Romanian
insurance market. International Journal of Academic Research in Accounting, Finance and
Management Sciences, 4(1), pp.299-308.
Churet, C. and Eccles, R.G., 2014. Integrated reporting, quality of management, and financial
performance. Journal of Applied Corporate Finance, 26(1), pp.56-64.
Hill, J.G., 2010. New trends in the regulation of executive remuneration. Directors in troubled
times, pp.100-123.
Jaafar, S.B. and James, K., 2014. Director remuneration pay: Trends during and after the
financial crisis of 2007 to 2009. Australasian Accounting, Business and Finance Journal, 8(3),
pp.55-68.
Klieštik, T., Kočišová, K. and Mišanková, M., 2015. Logit and probit model used for prediction
of financial health of company. Procedia Economics and finance, 23, pp.850-855.
Liu, T., Makridis, C., Ouimet, P. and Simintzi, E., 2019. The distribution of non-wage benefits:
Maternity benefits and gender diversity. Available at SSRN 3088067.
Martin, G., Farndale, E., Paauwe, J. and Stiles, P.G., 2016. Corporate governance and strategic
human resource management: Four archetypes and proposals for a new approach to corporate
sustainability. European Management Journal, 34(1), pp.22-35.
Mwangi, L.W., Makau, M.S. and Kosimbei, G., 2014. Relationship between capital structure and
performance of non-financial companies listed in the Nairobi Securities Exchange,
Kenya. Global Journal of Contemporary Research in Accounting, Auditing and Business
Ethics, 1(2), pp.72-90.
Öner Kaya, E., 2015. The effects of firm-specific factors on the profitability of non-life insurance
companies in Turkey. International journal of financial studies, 3(4), pp.510-529.
Pirzada, K., Mustapha, M.Z.B. and Wickramasinghe, D., 2015. Firm Performance, Institutional
Ownership and Capital Structure: A Case of Malaysia. Procedia-Social and Behavioral
Sciences, 211, pp.170-176.
Fin
14
Qingjin, W. and Jian, Z., 2017. A Study on the Relationship between Strength of Management
and New Venture Performance in Entrepreneurial Context The Mediating Effect of Team
Cooperation. Science & Technology Progress and Policy, 2017(14), p.3.
Richard, O.C., Wu, J., Markoczy, L.A. and Chung, Y., 2019. Top management team
demographic‐faultline strength and strategic change: What role does environmental dynamism
play?. Strategic Management Journal, 40(6), pp.987-1009.
Rutkowska-Ziarko, A., 2015. The Influence of Profitability Ratios and Company Size on
Profitability and Investment Risk in the Capital Market. Folia Oeconomica Stetinensia, 15(1),
pp.151-161.
Santos Limited, 2017. Annual Report Available at: https://www.santos.com/media/4319/2017-
annual-report.pdf Accessed on: 17 February 2020.
Santos Limited, 2017. Annual Report Available at: https://www.santos.com/media/4319/2017-
annual-report.pdf Accessed on: 17 February 2020.
Santos Limited, 2018. Annual Report Available at: https://www.santos.com/media/4651/2018-
annual-report.pdf Accessed on: 17 February 2020.
Santos Limited, 2018. Annual Report Available at: https://www.santos.com/media/4651/2018-
annual-report.pdf Accessed on: 17 February 2020.
Senasi, V. and Khalil, S., 2015. Implementation of minimum wage policy in Malaysia:
manufacturing employers’ perceptions of training provision and fringe benefits. International
journal of humanities and social science, 5(12), pp.87-94.
Waworuntu, S.R., Wantah, M.D. and Rusmanto, T., 2014. CSR and financial performance
analysis: evidence from top ASEAN listed companies. Procedia-Social and Behavioral
Sciences, 164, pp.493-500.
1 out of 15
Related Documents


Your All-in-One AI-Powered Toolkit for Academic Success.
+13062052269
info@desklib.com
Available 24*7 on WhatsApp / Email
![[object Object]](/_next/static/media/star-bottom.7253800d.svg)
Unlock your academic potential
© 2024 | Zucol Services PVT LTD | All rights reserved.