Corporate Performance Report: Financial Analysis of Rio Tinto Plc
VerifiedAdded on 2023/05/28
|20
|6033
|192
Report
AI Summary
This report presents a financial evaluation of Rio Tinto, focusing on its corporate performance to guide investment decisions for the Arden Fund. The analysis utilizes ratio analysis to assess profitability, liquidity, leverage, and efficiency over a period of time. The report includes an introduction, a detailed explanation of financial statement analysis, and the factors influencing investment decisions. The analysis covers profitability, liquidity, financial leverage, and efficiency ratios, using financial data from 2013 to 2017. The report identifies potential risks and issues within the company, and concludes with recommendations for investors. The report also includes an analysis of the financial report using corporate accounting principles, and a reflective statement commenting on the effectiveness of the analysis process. The report is well-referenced and provides a comprehensive overview of Rio Tinto's financial performance, including the identification of key strengths, weaknesses, and potential risks.
1
Corporate Performance Report of Rio Tinto
Corporate Performance Report of Rio Tinto
Paraphrase This Document
Need a fresh take? Get an instant paraphrase of this document with our AI Paraphraser
2
Executive Summary
The present report is developed for carrying out financial evaluation of Rio Tinto to
determine its prospects of future growth and development. This is mainly carried out for guiding
the decision of Arden Fund investors who want to invest in the company. As such, the report has
incorporated the use of ratio analysis for determining the profitability, liquidity, leverage and
earning potential of the company to identify the potential risk and issues in advance. It has been
identified through the use of financial analysis that there is significant risk of generating good
profits for the shareholders within the company. Thus, it has been recommended to the investors
for analyzing the future performance of the company for the coming period of time before
investing within the company.
3
Contents
Executive Summary.........................................................................................................................2
1.0: Answer 1: Financial Report of Rio Tinto.................................................................................4
2.0: Introduction.............................................................................................................................4
3.0: Understanding the meaning of the financial statement analysis...............................................4
4.0: Factors that influences the making of investment decision......................................................4
5.0: Analysis of financial statements of Rio Tinto..........................................................................5
5.1: Ratio Analysis...........................................................................................................................5
Financial Data of Rio Tinto.............................................................................................................5
Profitability Analysis.......................................................................................................................6
Liquidity Analysis...........................................................................................................................8
Financial Leverage Analysis............................................................................................................9
Efficiency Analysis........................................................................................................................11
5.2: Earnings Analysis...................................................................................................................12
6.0: Potential Risks or Potential Issues..........................................................................................12
7.0: Conclusion..............................................................................................................................13
8.0: Solution 2: Analysis of financial report produced in question 1 through using corporate
accounting principles.....................................................................................................................14
9.0: Solution 3: Reflective Statement Commenting on the Effectiveness of the Process from
Questions 1 and 2...........................................................................................................................16
10.0: References............................................................................................................................18
⊘ This is a preview!⊘
Do you want full access?
Subscribe today to unlock all pages.
Trusted by 1+ million students worldwide

4
1.0: Answer 1: Financial Report of Rio Tinto
2.0: Introduction
The analysis of internal and external performance of a firm is very important for
assessing its present and future potential of growth. This forms the basis for decision-making
process of investors for their investment decisions. In this context, the present report is
developed for assessing the internal as well as external performance of Rio Tinto, an Australian
multinational metals and mining company established in the year 1873 and headquartered within
the UK. This is mainly done for guiding the decision-making process of Arden Fund, a collection
of ethical investors interested in buying a significant volume of shares in Rio Tinto Plc. The
external performance of the firm is evaluated in the report through the use of financial analysis
that is through the technique of ratio analysis. The internal performance is evaluated by assessing
the effectiveness of its internal processes as analyzed on the basis of the results of its financial
analysis.
3.0: Understanding the meaning of the financial statement analysis
The financial statements can be defined as the summary of the operating, financing and
investment activities of a business. The financial statement analysis can be described as the
process of reviewing and analyzing the financial performance of a company through evaluation
of its financial reports. It intends to examine the past and current financial data for assessing its
present and future growth potential. The most important benefit of financial statement analysis is
to provide idea to the investors for guiding their investment decisions by prediction of a
company future financial performance. The main type of financial statements that are developed
by a business entity for disclosing the financial performances to the external stakeholders are
equity statement, income statement, balance sheet and statement of cash flow. Equity statement
reflects the part of the value of a firm that is owned by the creditors whereas income statement
reflects a summary of the revenue and expenses. Balance sheet depicts the summary of assets,
liabilities and equity while cash flow statement depicts the summary of cash flows over a period
of time. The analysis of all these financial statement determines a firm internal strength and
weakness and established its future strategic direction by developing of possible measures to
overcome its weakness.
4.0: Factors that influences the making of investment decision
Financial ratio analysis can be regarded as the most important tool for financial analysis
that guides the decision-making process of investors. Ratio analysis proves to be most
appropriate for evaluation of the various aspects of a company’s performance that are, efficiency,
liquidly, profitability and solvency. The Arden Fund Investors through the use of technique of
Paraphrase This Document
Need a fresh take? Get an instant paraphrase of this document with our AI Paraphraser

5
financial ratio analysis can adequately evaluate its operating financial performance that will help
in assessing its potential of future growth and development. In addition to this, investors can
adequately analyze the market value of firm securities with the use of earning analysis. Earning
analysis can be carried out by evaluation of the earning per share of a firm that given a depiction
of its market worth by measuring its operating earnings. As such, Arden Fund investors can
analyze the EPS of Rio Tinto before making the investment decision.
5.0: Analysis of financial statements of Rio Tinto
5.1: Ratio Analysis
Ratio analysis is regarded as the most important accounting tool used to perform the
financial analysis. All the required information that is needed to be processed is primarily
gathered from the financial statements of the selected company. Ratio is referred to the
mathematical relationship two main quantities from the financial statement of the company.
Through use of ratios, investors can have information about the five major aspects of the
financial performance mainly return on investment, liquidity, efficiency, profitability, and capital
structure or financial leverage.
Importance of Ratio Analysis
Ratios are one of the most important tools that were used in finance and that almost every
business does and by calculating these ratios, it is easy to express an opinion about the
performance of particular enterprise.
We can use ratio analysis to tell us whether the business is –
• Profitable
• Has enough money to pay its debts
• Could be paying its employees higher wages, remuneration or so on
• Is able to pay its taxes
• Is using its assets efficiently or not
• Has a sufficient amount of fund to meet their daily obligations (Brigham and Michael,
2013)
Types of Ratios
• Profitability Analysis
• Liquidity Analysis
• Efficiency Analysis
• Financial Leverage Analysis
6
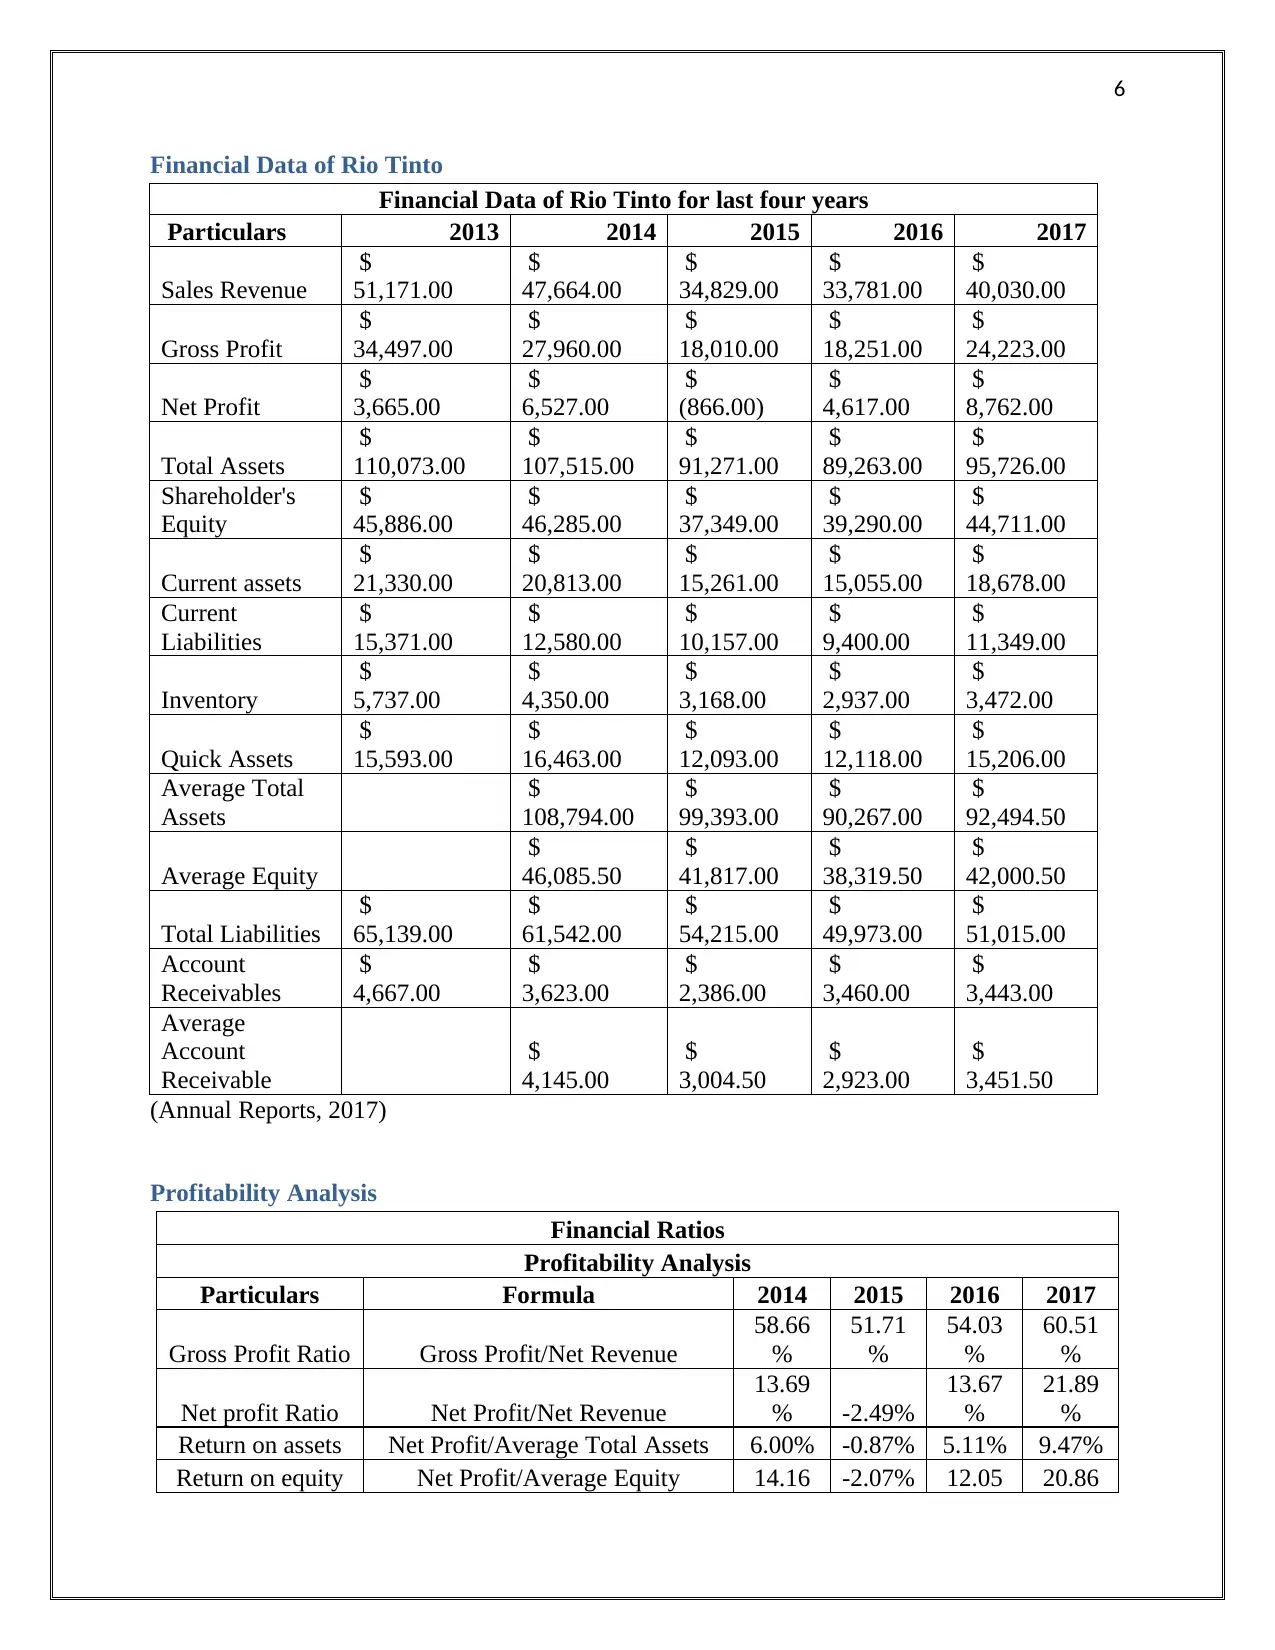
Financial Data of Rio Tinto
Financial Data of Rio Tinto for last four years
Particulars 2013 2014 2015 2016 2017
Sales Revenue
$
51,171.00
$
47,664.00
$
34,829.00
$
33,781.00
$
40,030.00
Gross Profit
$
34,497.00
$
27,960.00
$
18,010.00
$
18,251.00
$
24,223.00
Net Profit
$
3,665.00
$
6,527.00
$
(866.00)
$
4,617.00
$
8,762.00
Total Assets
$
110,073.00
$
107,515.00
$
91,271.00
$
89,263.00
$
95,726.00
Shareholder's
Equity
$
45,886.00
$
46,285.00
$
37,349.00
$
39,290.00
$
44,711.00
Current assets
$
21,330.00
$
20,813.00
$
15,261.00
$
15,055.00
$
18,678.00
Current
Liabilities
$
15,371.00
$
12,580.00
$
10,157.00
$
9,400.00
$
11,349.00
Inventory
$
5,737.00
$
4,350.00
$
3,168.00
$
2,937.00
$
3,472.00
Quick Assets
$
15,593.00
$
16,463.00
$
12,093.00
$
12,118.00
$
15,206.00
Average Total
Assets
$
108,794.00
$
99,393.00
$
90,267.00
$
92,494.50
Average Equity
$
46,085.50
$
41,817.00
$
38,319.50
$
42,000.50
Total Liabilities
$
65,139.00
$
61,542.00
$
54,215.00
$
49,973.00
$
51,015.00
Account
Receivables
$
4,667.00
$
3,623.00
$
2,386.00
$
3,460.00
$
3,443.00
Average
Account
Receivable
$
4,145.00
$
3,004.50
$
2,923.00
$
3,451.50
(Annual Reports, 2017)
Profitability Analysis
Financial Ratios
Profitability Analysis
Particulars Formula 2014 2015 2016 2017
Gross Profit Ratio Gross Profit/Net Revenue
58.66
%
51.71
%
54.03
%
60.51
%
Net profit Ratio Net Profit/Net Revenue
13.69
% -2.49%
13.67
%
21.89
%
Return on assets Net Profit/Average Total Assets 6.00% -0.87% 5.11% 9.47%
Return on equity Net Profit/Average Equity 14.16 -2.07% 12.05 20.86
⊘ This is a preview!⊘
Do you want full access?
Subscribe today to unlock all pages.
Trusted by 1+ million students worldwide
7
% % %
(Damodaran, 2011)
2014 2015 2016 2017
-10.00%
0.00%
10.00%
20.00%
30.00%
40.00%
50.00%
60.00%
70.00%
58.66%
51.71% 54.03%
60.51%
13.69%
-2.49%
13.67%
21.89%
6.00%
-0.87%
5.11% 9.47%
14.16%
-2.07%
12.05%
20.86%
Profitability Ratios
Gross Profit Ratio
Net profit Ratio
Return on assets
Return on equity
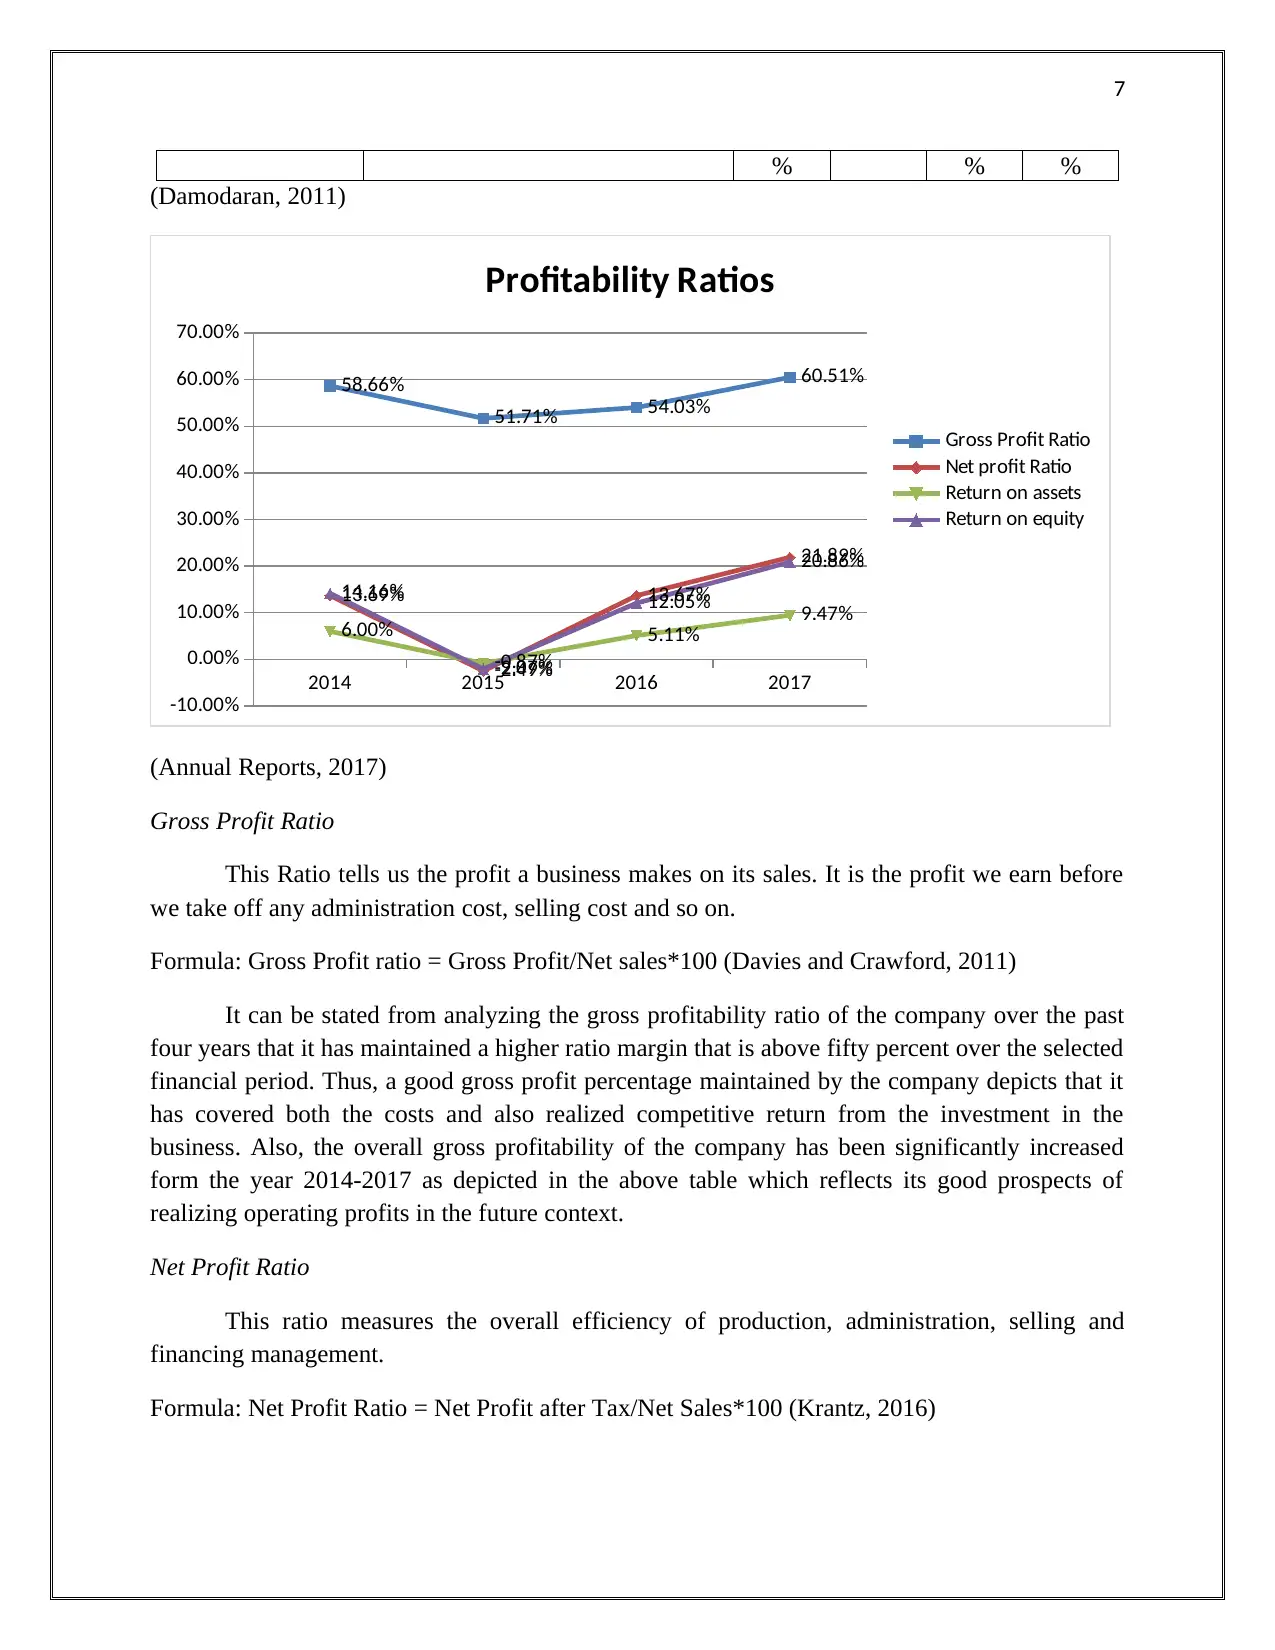
(Annual Reports, 2017)
Gross Profit Ratio
This Ratio tells us the profit a business makes on its sales. It is the profit we earn before
we take off any administration cost, selling cost and so on.
Formula: Gross Profit ratio = Gross Profit/Net sales*100 (Davies and Crawford, 2011)
It can be stated from analyzing the gross profitability ratio of the company over the past
four years that it has maintained a higher ratio margin that is above fifty percent over the selected
financial period. Thus, a good gross profit percentage maintained by the company depicts that it
has covered both the costs and also realized competitive return from the investment in the
business. Also, the overall gross profitability of the company has been significantly increased
form the year 2014-2017 as depicted in the above table which reflects its good prospects of
realizing operating profits in the future context.
Net Profit Ratio
This ratio measures the overall efficiency of production, administration, selling and
financing management.
Formula: Net Profit Ratio = Net Profit after Tax/Net Sales*100 (Krantz, 2016)
% % %
(Damodaran, 2011)
2014 2015 2016 2017
-10.00%
0.00%
10.00%
20.00%
30.00%
40.00%
50.00%
60.00%
70.00%
58.66%
51.71% 54.03%
60.51%
13.69%
-2.49%
13.67%
21.89%
6.00%
-0.87%
5.11% 9.47%
14.16%
-2.07%
12.05%
20.86%
Profitability Ratios
Gross Profit Ratio
Net profit Ratio
Return on assets
Return on equity
(Annual Reports, 2017)
Gross Profit Ratio
This Ratio tells us the profit a business makes on its sales. It is the profit we earn before
we take off any administration cost, selling cost and so on.
Formula: Gross Profit ratio = Gross Profit/Net sales*100 (Davies and Crawford, 2011)
It can be stated from analyzing the gross profitability ratio of the company over the past
four years that it has maintained a higher ratio margin that is above fifty percent over the selected
financial period. Thus, a good gross profit percentage maintained by the company depicts that it
has covered both the costs and also realized competitive return from the investment in the
business. Also, the overall gross profitability of the company has been significantly increased
form the year 2014-2017 as depicted in the above table which reflects its good prospects of
realizing operating profits in the future context.
Net Profit Ratio
This ratio measures the overall efficiency of production, administration, selling and
financing management.
Formula: Net Profit Ratio = Net Profit after Tax/Net Sales*100 (Krantz, 2016)
Paraphrase This Document
Need a fresh take? Get an instant paraphrase of this document with our AI Paraphraser

8
The after-tax profits realized to net sales has depicted an increasing trend from the year
2014-2017 which depicts that its efficiency to meet the cost of production and financing has been
improved reflecting its good financial position. However, it has been reflected from the table that
the ratio for the year 2015 reflects a negative trend depicting that it has suffered loss in the
respective financial year. The ratio has then reflected an increasing trend till the year 2017
reflecting that it has improved its ability to meet the operating expenses which consequently lead
to increase in its sales revenue.
Return on Assets (ROA)
This ratio actually measures the profitability of the investments in the firm.
Formula: Return on Assets = Net Profit after Tax/Total Assets*100 (Madura, 2014)
The return on assets of the company has depicted an increasing trend from the year 2014-
2017 reflecting the improvement in its ability to gain returns on the investment. The company
ROA has been negative in the year 2015 indicating that it has incurred losses on its investment
but has then improved its ability to realize returns on its investments as the ratio has depicted an
increasing trend from the year 2015-2017.
Return on Equity (ROE)
It measures the profitability of a business in relation to the equity invested by its
shareholders.
Formula: ROE=Net Income/Shareholder equity (Moles and Kidwekk, 2011)
The ROE has reflected an increasing trend from the year 2014-2017 as depicted in the
above table. The ratio has depicted a negative trend in the year 2015 which means that it has
earned loss on its equity investment. However, the company has then improved its ROE but it
has depicted a financial risk present within the company for the shareholders as its ROE is below
10% as analyzed for the last four years.
Liquidity Analysis
Financial Ratios
Liquidity Analysis
Particulars Formula 2014 2015 2016 2017
Current Ratio Current Assets/Current Liabilities 1.65 1.50 1.60 1.65
Quick Ratio Quick Assets/Current Liabilities 1.01 1.31 1.19 1.29
(Annual Reports, 2017)
9
2014 2015 2016 2017
0.00
0.20
0.40
0.60
0.80
1.00
1.20
1.40
1.60
1.80 1.65
1.50 1.60 1.65
1.01
1.31 1.19 1.29
Liquidity Ratios
Current Ratio
Quick Ratio
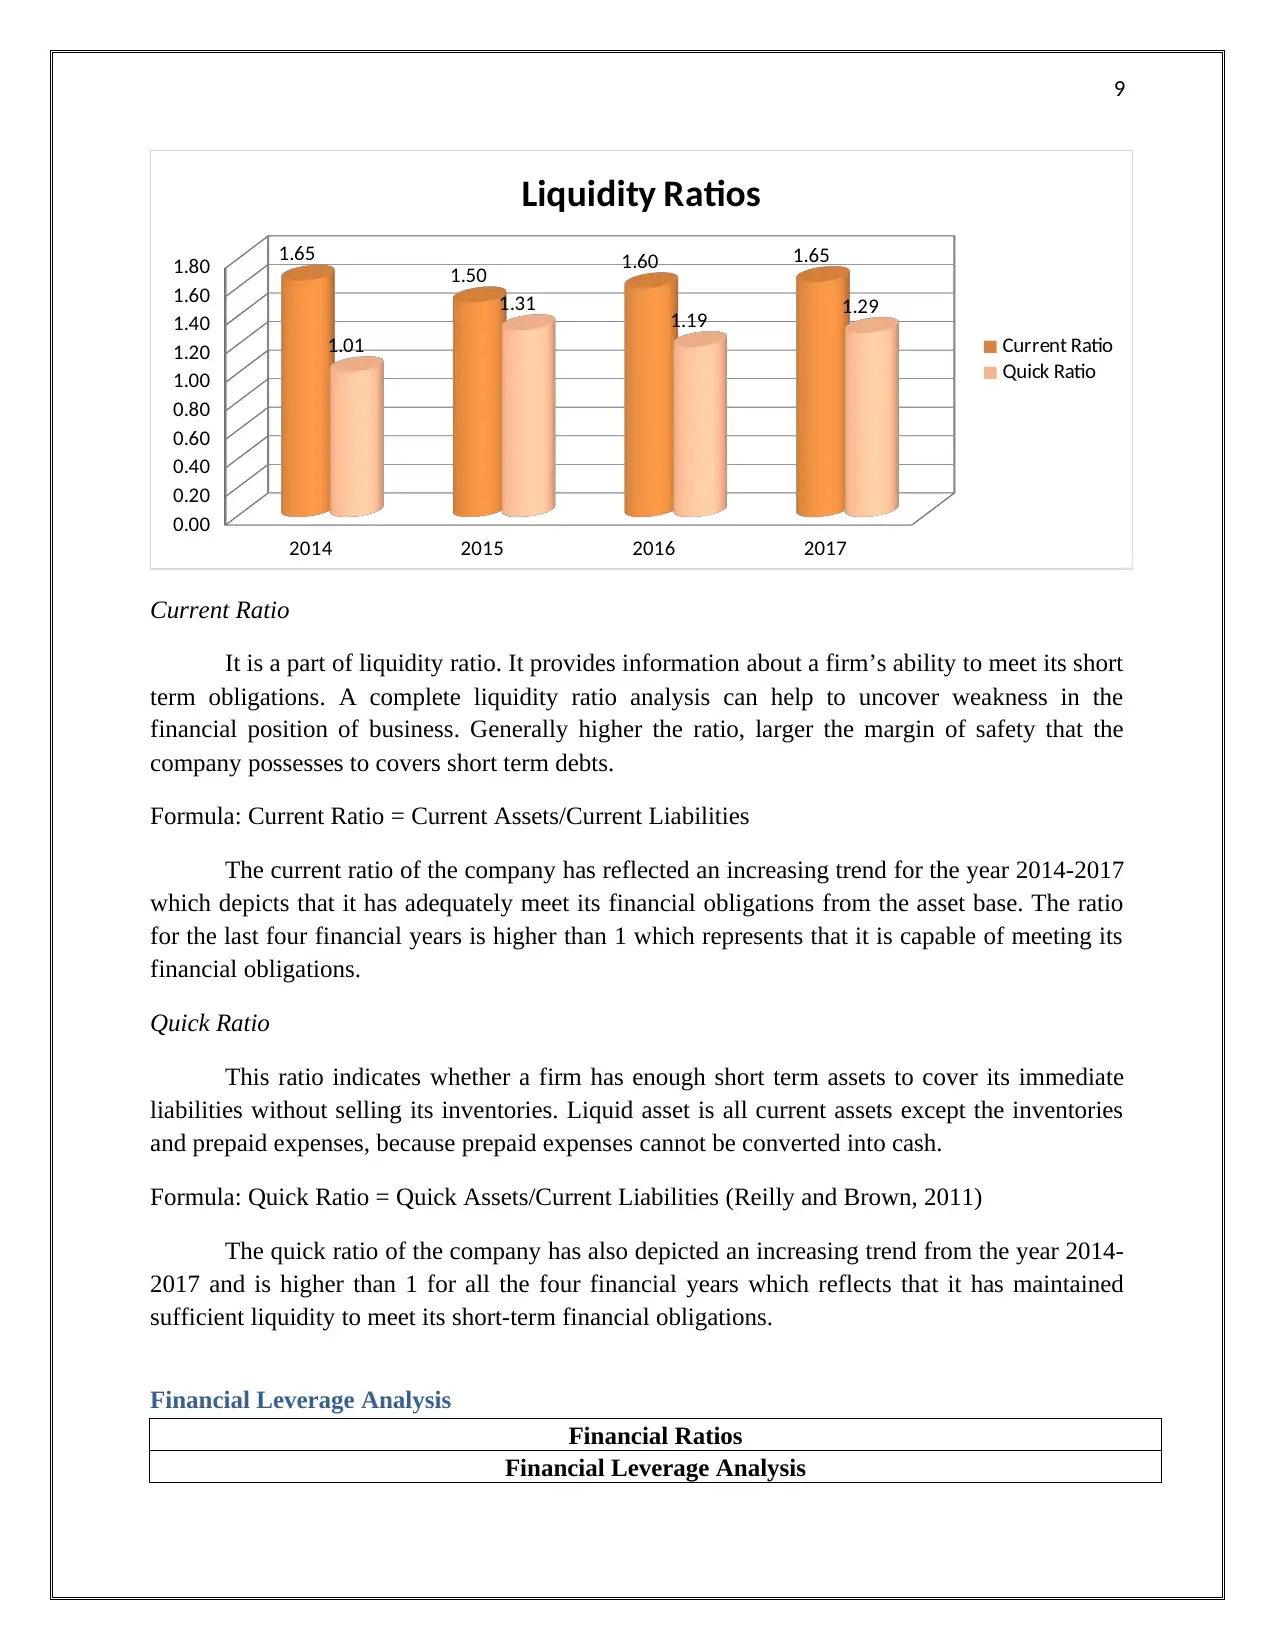
Current Ratio
It is a part of liquidity ratio. It provides information about a firm’s ability to meet its short
term obligations. A complete liquidity ratio analysis can help to uncover weakness in the
financial position of business. Generally higher the ratio, larger the margin of safety that the
company possesses to covers short term debts.
Formula: Current Ratio = Current Assets/Current Liabilities
The current ratio of the company has reflected an increasing trend for the year 2014-2017
which depicts that it has adequately meet its financial obligations from the asset base. The ratio
for the last four financial years is higher than 1 which represents that it is capable of meeting its
financial obligations.
Quick Ratio
This ratio indicates whether a firm has enough short term assets to cover its immediate
liabilities without selling its inventories. Liquid asset is all current assets except the inventories
and prepaid expenses, because prepaid expenses cannot be converted into cash.
Formula: Quick Ratio = Quick Assets/Current Liabilities (Reilly and Brown, 2011)
The quick ratio of the company has also depicted an increasing trend from the year 2014-
2017 and is higher than 1 for all the four financial years which reflects that it has maintained
sufficient liquidity to meet its short-term financial obligations.
Financial Leverage Analysis
Financial Ratios
Financial Leverage Analysis
2014 2015 2016 2017
0.00
0.20
0.40
0.60
0.80
1.00
1.20
1.40
1.60
1.80 1.65
1.50 1.60 1.65
1.01
1.31 1.19 1.29
Liquidity Ratios
Current Ratio
Quick Ratio
Current Ratio
It is a part of liquidity ratio. It provides information about a firm’s ability to meet its short
term obligations. A complete liquidity ratio analysis can help to uncover weakness in the
financial position of business. Generally higher the ratio, larger the margin of safety that the
company possesses to covers short term debts.
Formula: Current Ratio = Current Assets/Current Liabilities
The current ratio of the company has reflected an increasing trend for the year 2014-2017
which depicts that it has adequately meet its financial obligations from the asset base. The ratio
for the last four financial years is higher than 1 which represents that it is capable of meeting its
financial obligations.
Quick Ratio
This ratio indicates whether a firm has enough short term assets to cover its immediate
liabilities without selling its inventories. Liquid asset is all current assets except the inventories
and prepaid expenses, because prepaid expenses cannot be converted into cash.
Formula: Quick Ratio = Quick Assets/Current Liabilities (Reilly and Brown, 2011)
The quick ratio of the company has also depicted an increasing trend from the year 2014-
2017 and is higher than 1 for all the four financial years which reflects that it has maintained
sufficient liquidity to meet its short-term financial obligations.
Financial Leverage Analysis
Financial Ratios
Financial Leverage Analysis
⊘ This is a preview!⊘
Do you want full access?
Subscribe today to unlock all pages.
Trusted by 1+ million students worldwide
10
Particulars Formula 2014
201
5 2016 2017
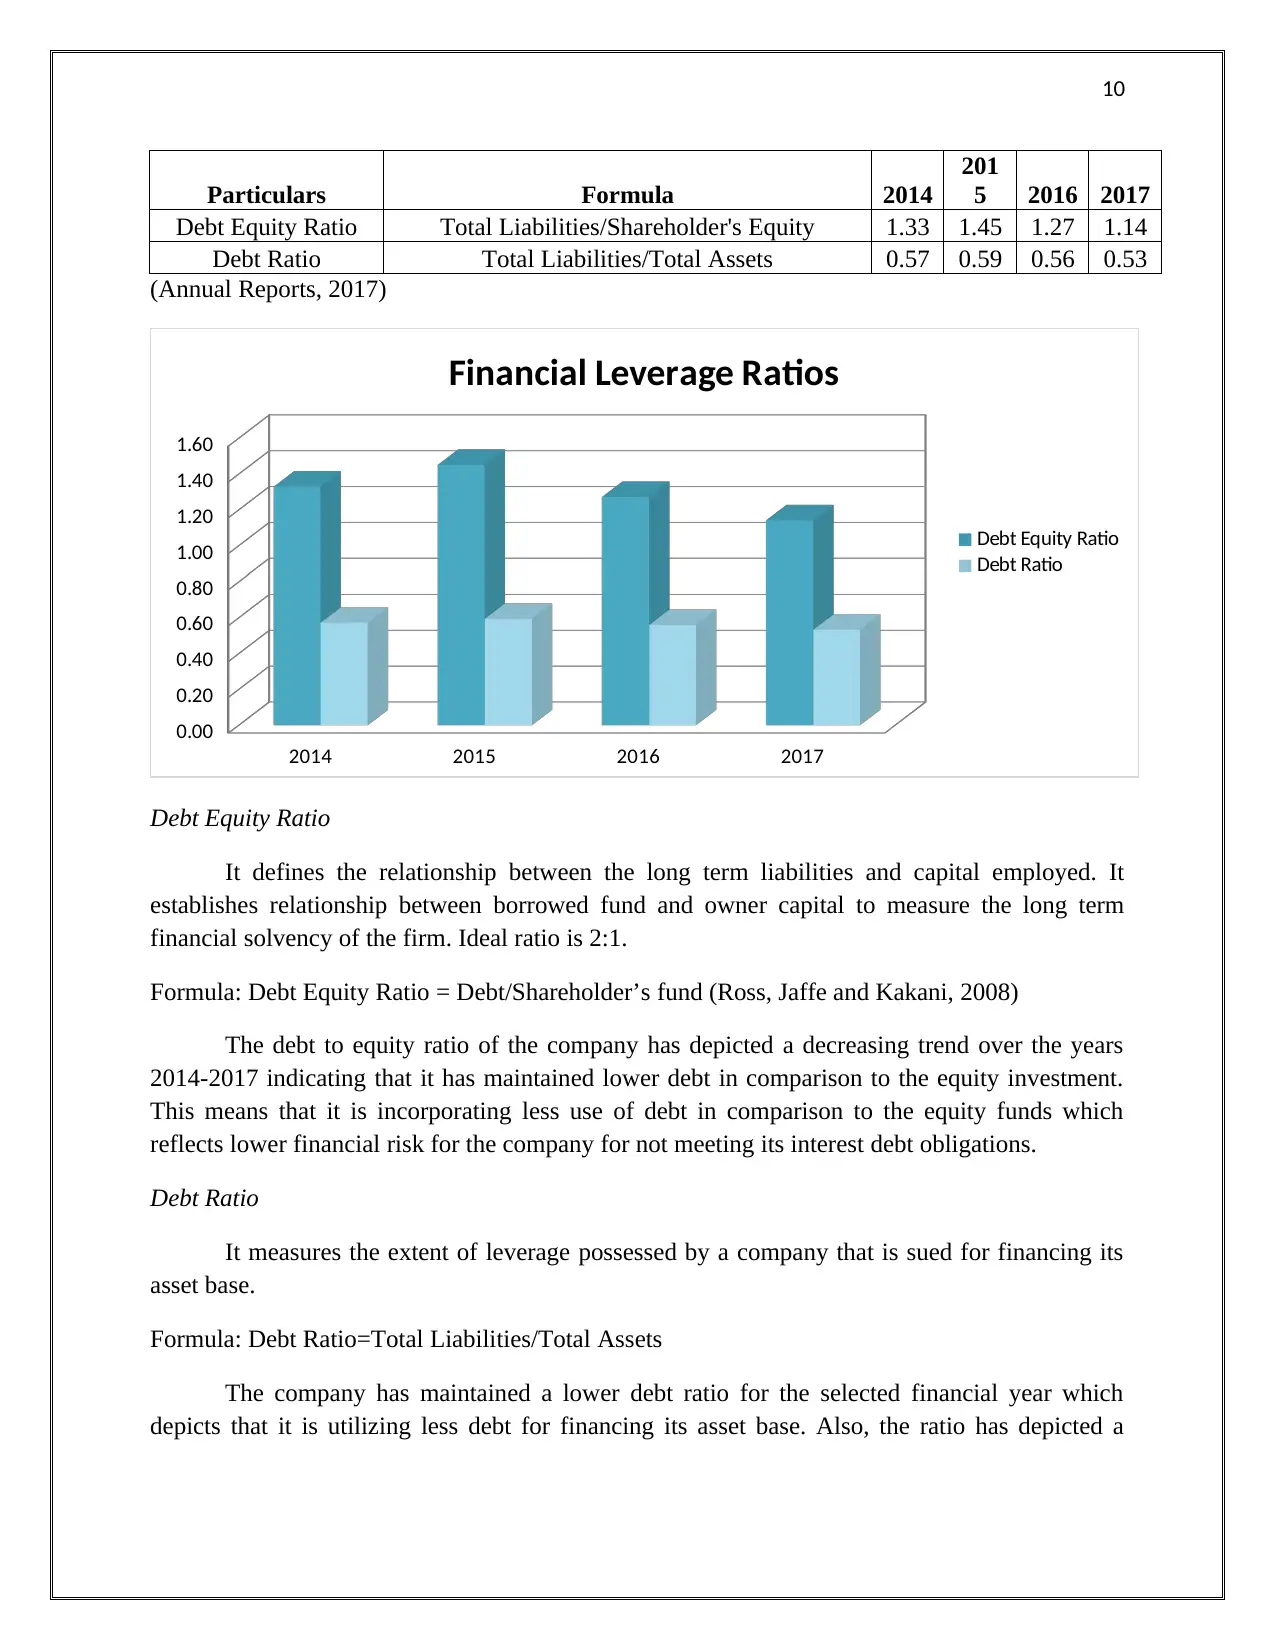
Debt Equity Ratio Total Liabilities/Shareholder's Equity 1.33 1.45 1.27 1.14
Debt Ratio Total Liabilities/Total Assets 0.57 0.59 0.56 0.53
(Annual Reports, 2017)
2014 2015 2016 2017
0.00
0.20
0.40
0.60
0.80
1.00
1.20
1.40
1.60
Financial Leverage Ratios
Debt Equity Ratio
Debt Ratio
Debt Equity Ratio
It defines the relationship between the long term liabilities and capital employed. It
establishes relationship between borrowed fund and owner capital to measure the long term
financial solvency of the firm. Ideal ratio is 2:1.
Formula: Debt Equity Ratio = Debt/Shareholder’s fund (Ross, Jaffe and Kakani, 2008)
The debt to equity ratio of the company has depicted a decreasing trend over the years
2014-2017 indicating that it has maintained lower debt in comparison to the equity investment.
This means that it is incorporating less use of debt in comparison to the equity funds which
reflects lower financial risk for the company for not meeting its interest debt obligations.
Debt Ratio
It measures the extent of leverage possessed by a company that is sued for financing its
asset base.
Formula: Debt Ratio=Total Liabilities/Total Assets
The company has maintained a lower debt ratio for the selected financial year which
depicts that it is utilizing less debt for financing its asset base. Also, the ratio has depicted a
Particulars Formula 2014
201
5 2016 2017
Debt Equity Ratio Total Liabilities/Shareholder's Equity 1.33 1.45 1.27 1.14
Debt Ratio Total Liabilities/Total Assets 0.57 0.59 0.56 0.53
(Annual Reports, 2017)
2014 2015 2016 2017
0.00
0.20
0.40
0.60
0.80
1.00
1.20
1.40
1.60
Financial Leverage Ratios
Debt Equity Ratio
Debt Ratio
Debt Equity Ratio
It defines the relationship between the long term liabilities and capital employed. It
establishes relationship between borrowed fund and owner capital to measure the long term
financial solvency of the firm. Ideal ratio is 2:1.
Formula: Debt Equity Ratio = Debt/Shareholder’s fund (Ross, Jaffe and Kakani, 2008)
The debt to equity ratio of the company has depicted a decreasing trend over the years
2014-2017 indicating that it has maintained lower debt in comparison to the equity investment.
This means that it is incorporating less use of debt in comparison to the equity funds which
reflects lower financial risk for the company for not meeting its interest debt obligations.
Debt Ratio
It measures the extent of leverage possessed by a company that is sued for financing its
asset base.
Formula: Debt Ratio=Total Liabilities/Total Assets
The company has maintained a lower debt ratio for the selected financial year which
depicts that it is utilizing less debt for financing its asset base. Also, the ratio has depicted a
Paraphrase This Document
Need a fresh take? Get an instant paraphrase of this document with our AI Paraphraser
11
decreasing trend which means that there is less financial risk for it to default but it also
represents a doubt regarding the future financial growth prospects of the company.
Efficiency Analysis
Financial Ratios
Efficiency Analysis
Particulars Formula 2014 2015 2016 2017
Accounts
Receivables in Days
Average Account
Receivable*365/Revenue 31.74 31.49 31.58 31.47
Asset Turnover in
days Average total Assets*365/Revenue 833.12 1041.62 975.33 843.38
(Annual Reports, 2017)
Accounts Receivables in Days
The average number of days a company takes to collect payments on goods sold.
Formula: Accounts Receivables in days= 365/ (Average Accounts Receivable/Total value of
credit sales) (Weston and Brigham, 2015)
It can be stated on the basis of the trend of the ratio for the selected financial period that it
has maintained an effective control on the number of days required for collection of its
receivables from the customers. There was no major change in number of days required to
collect the account receivables during the last four years. Rio Tinto takes 1 month to collect all
its receivables that were due on starting of the month. It reflects high efficiency of management
at Rio Tinto. So it can be said that company manages its accounts receivables successfully and
helps to maintain the cash cycle in proper manner.
Asset turnover in day’s ratio
This ratio reflects the use of assets to earn the revenue by the management of the
company. The purpose of this ratio is to evaluate efficiency of the management to make optimum
utilization of resources to earn the maximum sales. This ratio shows times the revenue earned on
total assets for the selected period. This ratio takes average assets put to use within the process to
earn the sales revenue.
Formula: Asset turnover ratio in days: 365/ (Average Total assets/ Net Revenue)
Rio Tinto is the mining industry that requires heavy investment in machinery and many
other assets that makes value of total assets much more than the value of revenue earned by
company. Asset turnover ratio in days has increasing trend during the last four years that shows
Rio Tinto consume more assets to earn the same amount of sales in current as compared to
previous year. It shows management at Rio Tinto does not manage assets in proper manner.
decreasing trend which means that there is less financial risk for it to default but it also
represents a doubt regarding the future financial growth prospects of the company.
Efficiency Analysis
Financial Ratios
Efficiency Analysis
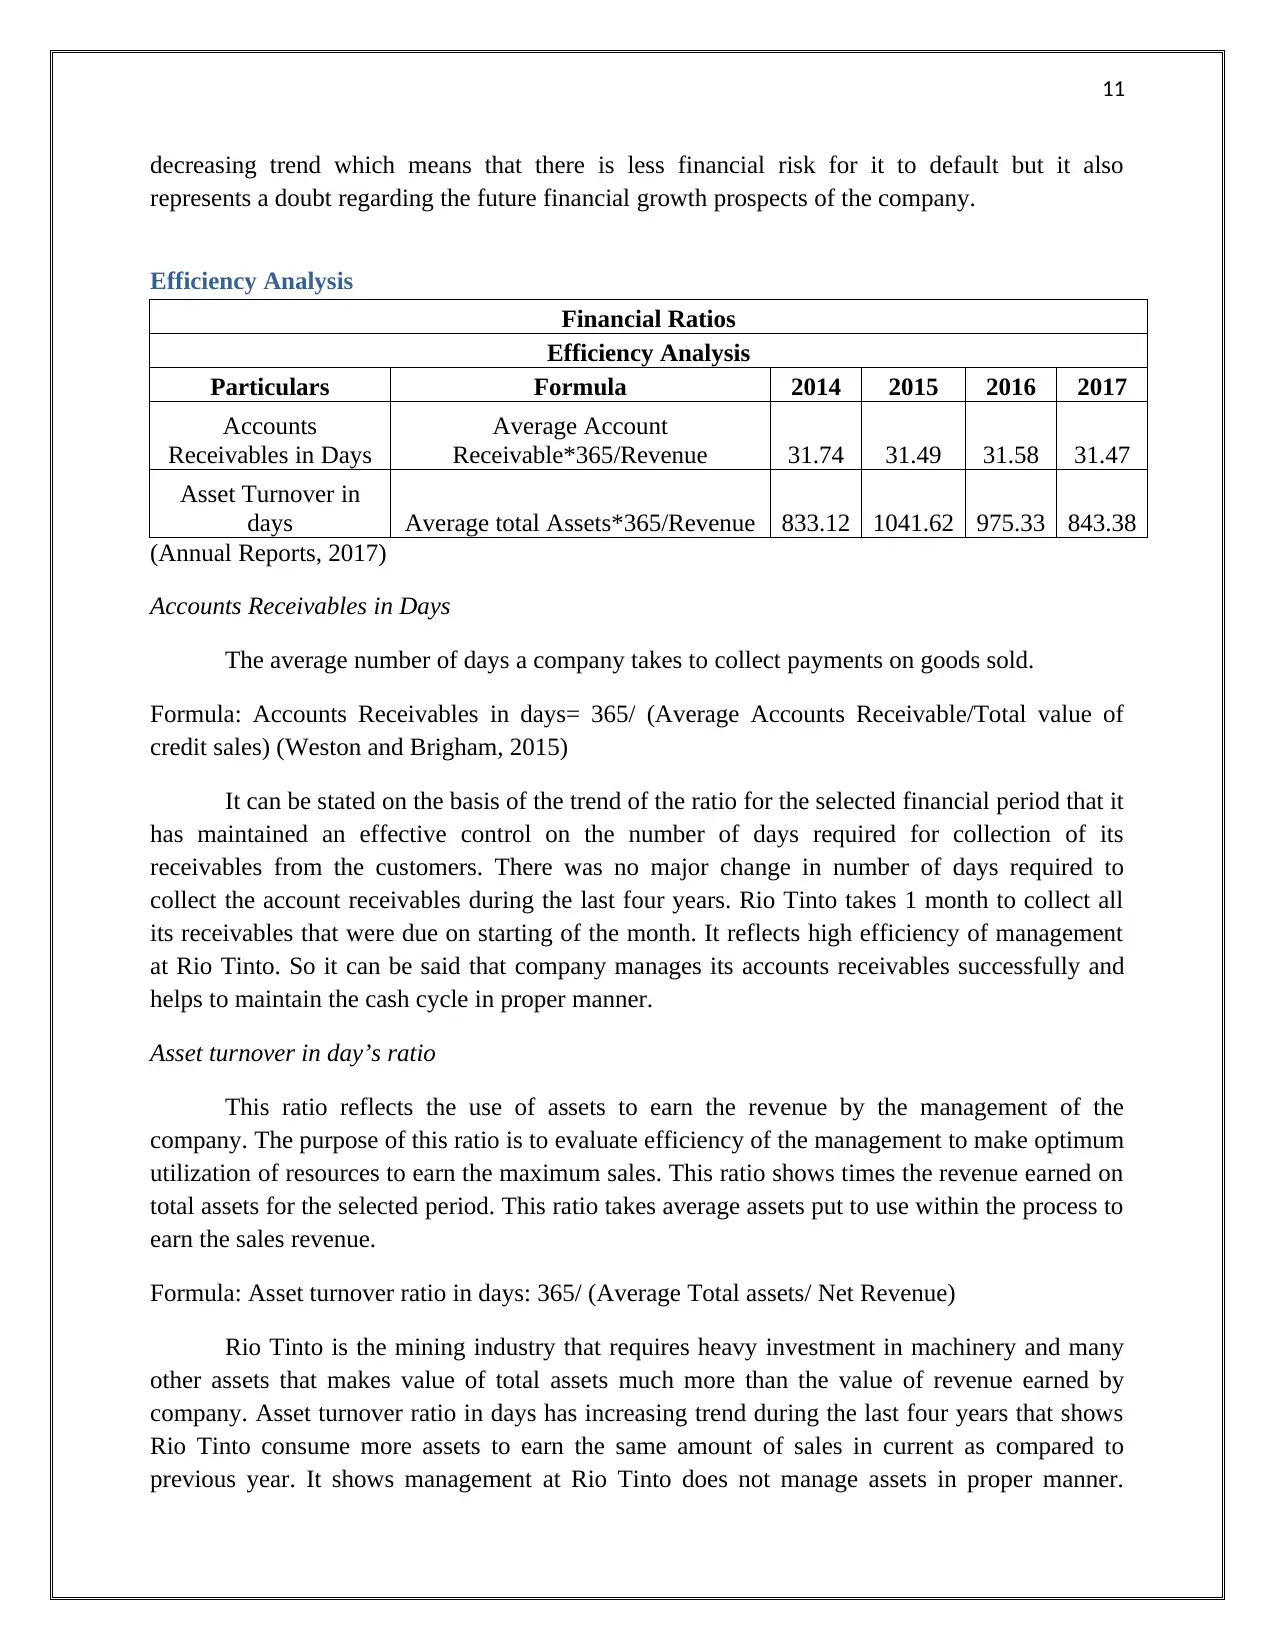
Particulars Formula 2014 2015 2016 2017
Accounts
Receivables in Days
Average Account
Receivable*365/Revenue 31.74 31.49 31.58 31.47
Asset Turnover in
days Average total Assets*365/Revenue 833.12 1041.62 975.33 843.38
(Annual Reports, 2017)
Accounts Receivables in Days
The average number of days a company takes to collect payments on goods sold.
Formula: Accounts Receivables in days= 365/ (Average Accounts Receivable/Total value of
credit sales) (Weston and Brigham, 2015)
It can be stated on the basis of the trend of the ratio for the selected financial period that it
has maintained an effective control on the number of days required for collection of its
receivables from the customers. There was no major change in number of days required to
collect the account receivables during the last four years. Rio Tinto takes 1 month to collect all
its receivables that were due on starting of the month. It reflects high efficiency of management
at Rio Tinto. So it can be said that company manages its accounts receivables successfully and
helps to maintain the cash cycle in proper manner.
Asset turnover in day’s ratio
This ratio reflects the use of assets to earn the revenue by the management of the
company. The purpose of this ratio is to evaluate efficiency of the management to make optimum
utilization of resources to earn the maximum sales. This ratio shows times the revenue earned on
total assets for the selected period. This ratio takes average assets put to use within the process to
earn the sales revenue.
Formula: Asset turnover ratio in days: 365/ (Average Total assets/ Net Revenue)
Rio Tinto is the mining industry that requires heavy investment in machinery and many
other assets that makes value of total assets much more than the value of revenue earned by
company. Asset turnover ratio in days has increasing trend during the last four years that shows
Rio Tinto consume more assets to earn the same amount of sales in current as compared to
previous year. It shows management at Rio Tinto does not manage assets in proper manner.
12
Overall considering the type of industry in which Rio Tinto belongs it can be said that
management needs to make sure that they can put more efforts in utilization of assets and earn
maximum amount of sales.
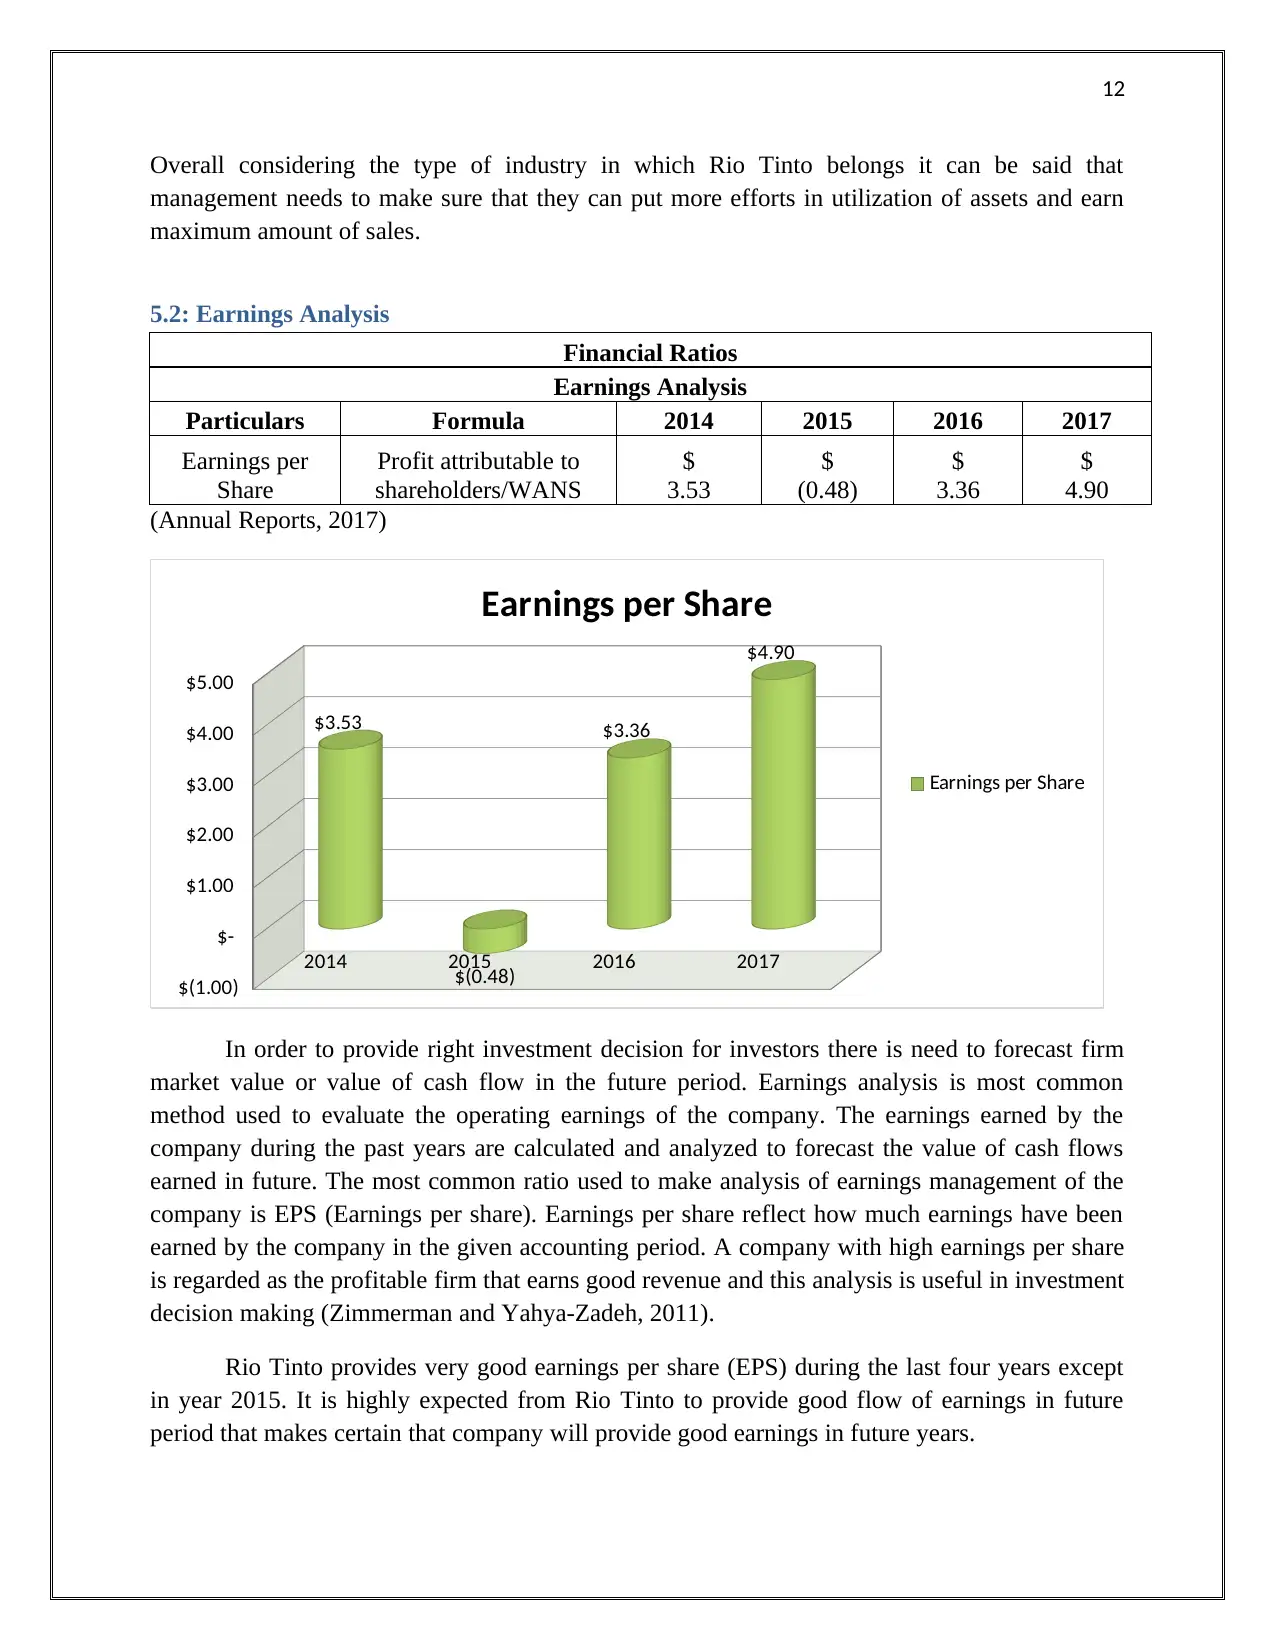
5.2: Earnings Analysis
Financial Ratios
Earnings Analysis
Particulars Formula 2014 2015 2016 2017
Earnings per
Share
Profit attributable to
shareholders/WANS
$
3.53
$
(0.48)
$
3.36
$
4.90
(Annual Reports, 2017)
2014 2015 2016 2017
$(1.00)
$-
$1.00
$2.00
$3.00
$4.00
$5.00
$3.53
$(0.48)
$3.36
$4.90
Earnings per Share
Earnings per Share
In order to provide right investment decision for investors there is need to forecast firm
market value or value of cash flow in the future period. Earnings analysis is most common
method used to evaluate the operating earnings of the company. The earnings earned by the
company during the past years are calculated and analyzed to forecast the value of cash flows
earned in future. The most common ratio used to make analysis of earnings management of the
company is EPS (Earnings per share). Earnings per share reflect how much earnings have been
earned by the company in the given accounting period. A company with high earnings per share
is regarded as the profitable firm that earns good revenue and this analysis is useful in investment
decision making (Zimmerman and Yahya-Zadeh, 2011).
Rio Tinto provides very good earnings per share (EPS) during the last four years except
in year 2015. It is highly expected from Rio Tinto to provide good flow of earnings in future
period that makes certain that company will provide good earnings in future years.
Overall considering the type of industry in which Rio Tinto belongs it can be said that
management needs to make sure that they can put more efforts in utilization of assets and earn
maximum amount of sales.
5.2: Earnings Analysis
Financial Ratios
Earnings Analysis
Particulars Formula 2014 2015 2016 2017
Earnings per
Share
Profit attributable to
shareholders/WANS
$
3.53
$
(0.48)
$
3.36
$
4.90
(Annual Reports, 2017)
2014 2015 2016 2017
$(1.00)
$-
$1.00
$2.00
$3.00
$4.00
$5.00
$3.53
$(0.48)
$3.36
$4.90
Earnings per Share
Earnings per Share
In order to provide right investment decision for investors there is need to forecast firm
market value or value of cash flow in the future period. Earnings analysis is most common
method used to evaluate the operating earnings of the company. The earnings earned by the
company during the past years are calculated and analyzed to forecast the value of cash flows
earned in future. The most common ratio used to make analysis of earnings management of the
company is EPS (Earnings per share). Earnings per share reflect how much earnings have been
earned by the company in the given accounting period. A company with high earnings per share
is regarded as the profitable firm that earns good revenue and this analysis is useful in investment
decision making (Zimmerman and Yahya-Zadeh, 2011).
Rio Tinto provides very good earnings per share (EPS) during the last four years except
in year 2015. It is highly expected from Rio Tinto to provide good flow of earnings in future
period that makes certain that company will provide good earnings in future years.
⊘ This is a preview!⊘
Do you want full access?
Subscribe today to unlock all pages.
Trusted by 1+ million students worldwide
1 out of 20
Related Documents


Your All-in-One AI-Powered Toolkit for Academic Success.
+13062052269
info@desklib.com
Available 24*7 on WhatsApp / Email
![[object Object]](/_next/static/media/star-bottom.7253800d.svg)
Unlock your academic potential
Copyright © 2020–2026 A2Z Services. All Rights Reserved. Developed and managed by ZUCOL.