Financial Interpretation Report: Cochlear Ltd Performance Analysis
VerifiedAdded on 2022/11/28
|12
|2732
|253
Report
AI Summary
This report presents a comprehensive financial interpretation of Cochlear Ltd, analyzing its performance from 2014 to 2018. The analysis includes a detailed examination of profitability ratios (gross profit margin, net profit margin, asset turnover, and return on equity), operational ratios (accounts receivable turnover, inventory turnover), liquidity ratios (current ratio, quick ratio), solvency ratios (debt-to-equity ratio, financial leverage), and market performance ratios. The report compares Cochlear Ltd's financial metrics with industry averages and assesses trends to provide insights into the company's efficiency, solvency, and overall financial health. The report also discusses the company's strategic management, credit policies, and inventory management in relation to its financial performance.
Running head: FINANCIAL INTERPRETATION
Financial Interpretation
Name of the Student:
Name of the University:
Author’s Note:
Financial Interpretation
Name of the Student:
Name of the University:
Author’s Note:
Paraphrase This Document
Need a fresh take? Get an instant paraphrase of this document with our AI Paraphraser
1FINANCIAL INTERPRETATION
Table of Contents
Trend and Cross Sectional Financial Analysis................................................................................2
Profitability Ratio........................................................................................................................2
Operational Ratio.........................................................................................................................4
Liquidity Ratio.............................................................................................................................6
Solvency Ratio.............................................................................................................................7
Market Performance Ratio...........................................................................................................8
References......................................................................................................................................10
2FINANCIAL INTERPRETATION
Trend and Cross Sectional Financial Analysis
The financial or trend analysis for the Cochlear Ltd has been done for the period 2014-
2018 whereby relevant changes in the financials for the company has been taken into
consideration for the company. The changes that were observed for the company in the financial
report will be assessed with the help of quantitative assessment tool namely ratio analysis for the
company whereby changes in the financial analysis for the company for the period 2014-2018
will be taken down into consideration. The analysis of the company will be done based on the
profitability that will be earned by the company, operational efficiency, liquidity, solvency and
market performance ratios for the company .
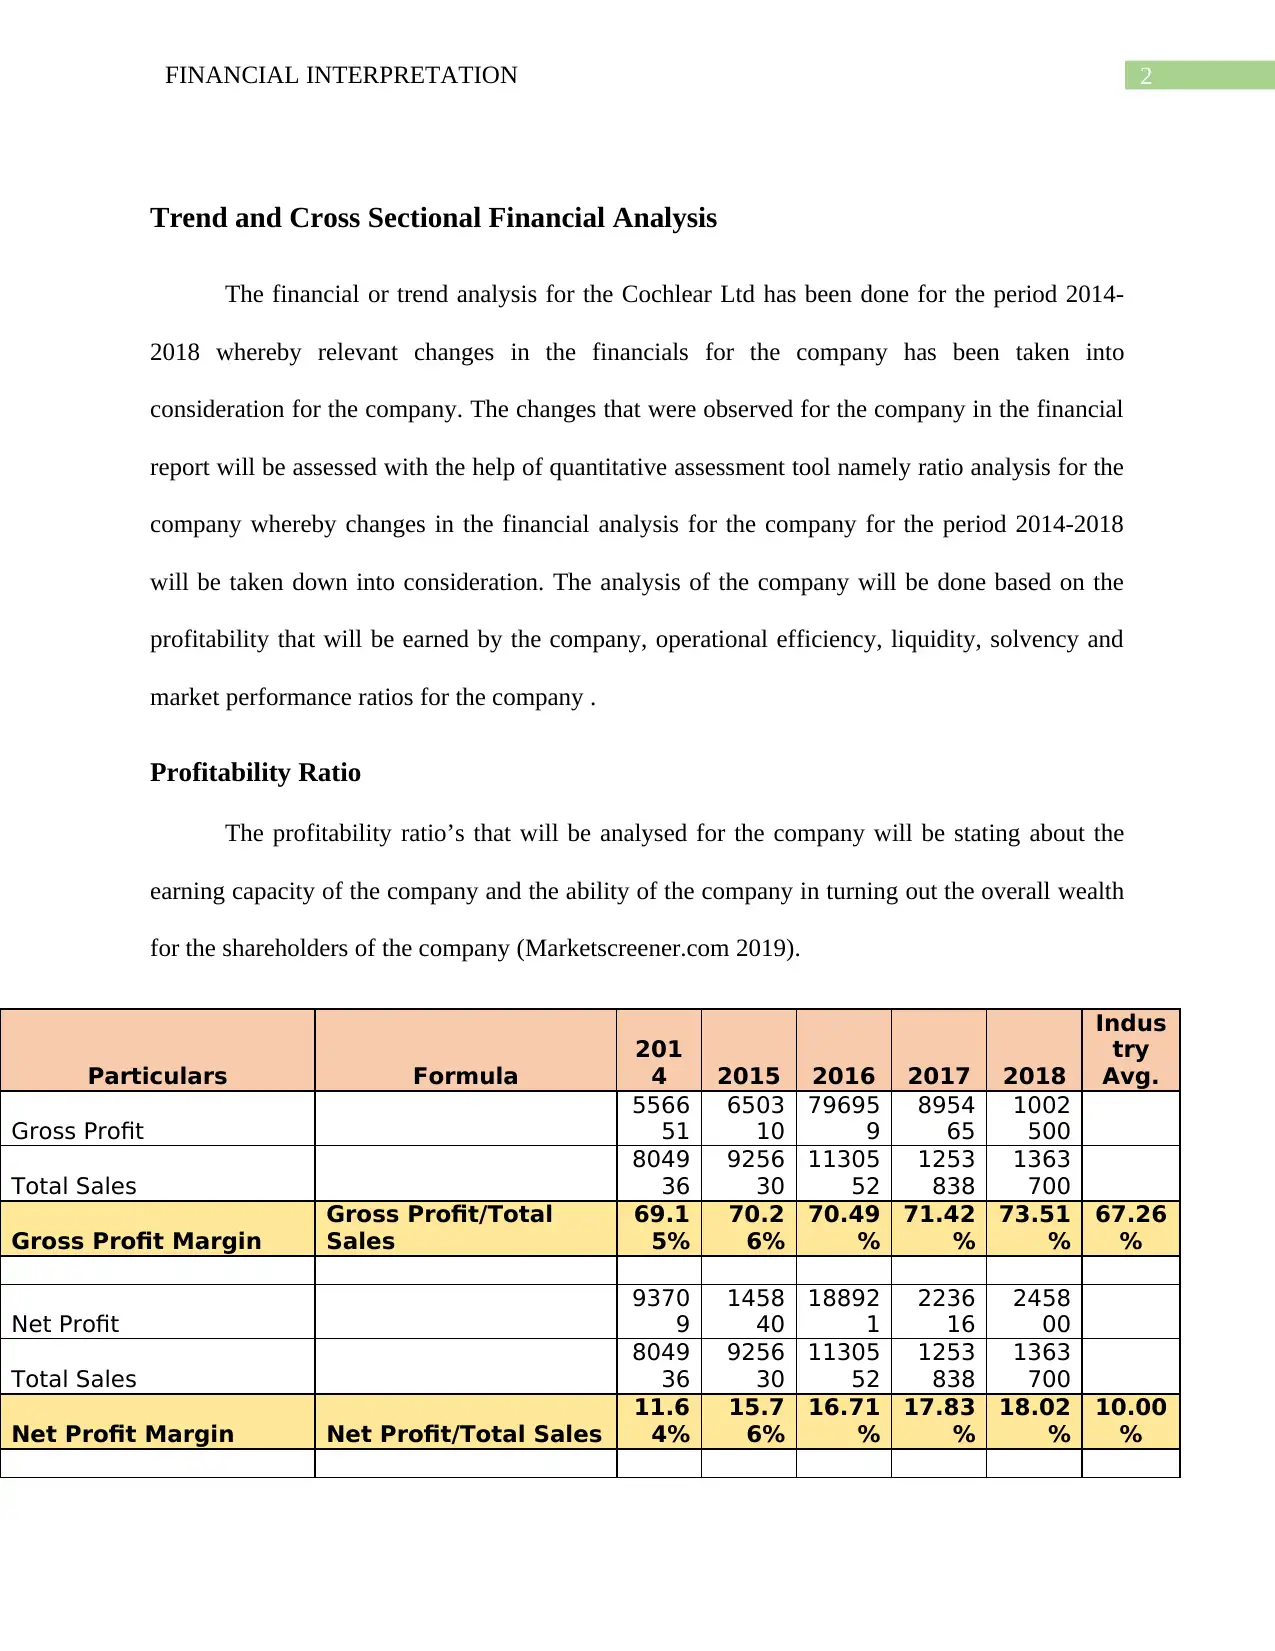
Profitability Ratio
The profitability ratio’s that will be analysed for the company will be stating about the
earning capacity of the company and the ability of the company in turning out the overall wealth
for the shareholders of the company (Marketscreener.com 2019).
Particulars Formula
201
4 2015 2016 2017 2018
Indus
try
Avg.
Gross Profit
5566
51
6503
10
79695
9
8954
65
1002
500
Total Sales
8049
36
9256
30
11305
52
1253
838
1363
700
Gross Profit Margin
Gross Profit/Total
Sales
69.1
5%
70.2
6%
70.49
%
71.42
%
73.51
%
67.26
%
Net Profit
9370
9
1458
40
18892
1
2236
16
2458
00
Total Sales
8049
36
9256
30
11305
52
1253
838
1363
700
Net Profit Margin Net Profit/Total Sales
11.6
4%
15.7
6%
16.71
%
17.83
%
18.02
%
10.00
%
Trend and Cross Sectional Financial Analysis
The financial or trend analysis for the Cochlear Ltd has been done for the period 2014-
2018 whereby relevant changes in the financials for the company has been taken into
consideration for the company. The changes that were observed for the company in the financial
report will be assessed with the help of quantitative assessment tool namely ratio analysis for the
company whereby changes in the financial analysis for the company for the period 2014-2018
will be taken down into consideration. The analysis of the company will be done based on the
profitability that will be earned by the company, operational efficiency, liquidity, solvency and
market performance ratios for the company .
Profitability Ratio
The profitability ratio’s that will be analysed for the company will be stating about the
earning capacity of the company and the ability of the company in turning out the overall wealth
for the shareholders of the company (Marketscreener.com 2019).
Particulars Formula
201
4 2015 2016 2017 2018
Indus
try
Avg.
Gross Profit
5566
51
6503
10
79695
9
8954
65
1002
500
Total Sales
8049
36
9256
30
11305
52
1253
838
1363
700
Gross Profit Margin
Gross Profit/Total
Sales
69.1
5%
70.2
6%
70.49
%
71.42
%
73.51
%
67.26
%
Net Profit
9370
9
1458
40
18892
1
2236
16
2458
00
Total Sales
8049
36
9256
30
11305
52
1253
838
1363
700
Net Profit Margin Net Profit/Total Sales
11.6
4%
15.7
6%
16.71
%
17.83
%
18.02
%
10.00
%
⊘ This is a preview!⊘
Do you want full access?
Subscribe today to unlock all pages.
Trusted by 1+ million students worldwide
3FINANCIAL INTERPRETATION
Total Sales
8049
36
9256
30
11305
52
1253
838
1363
700
Total Assets
7890
36
8690
56
95736
3
1136
359
1156
900
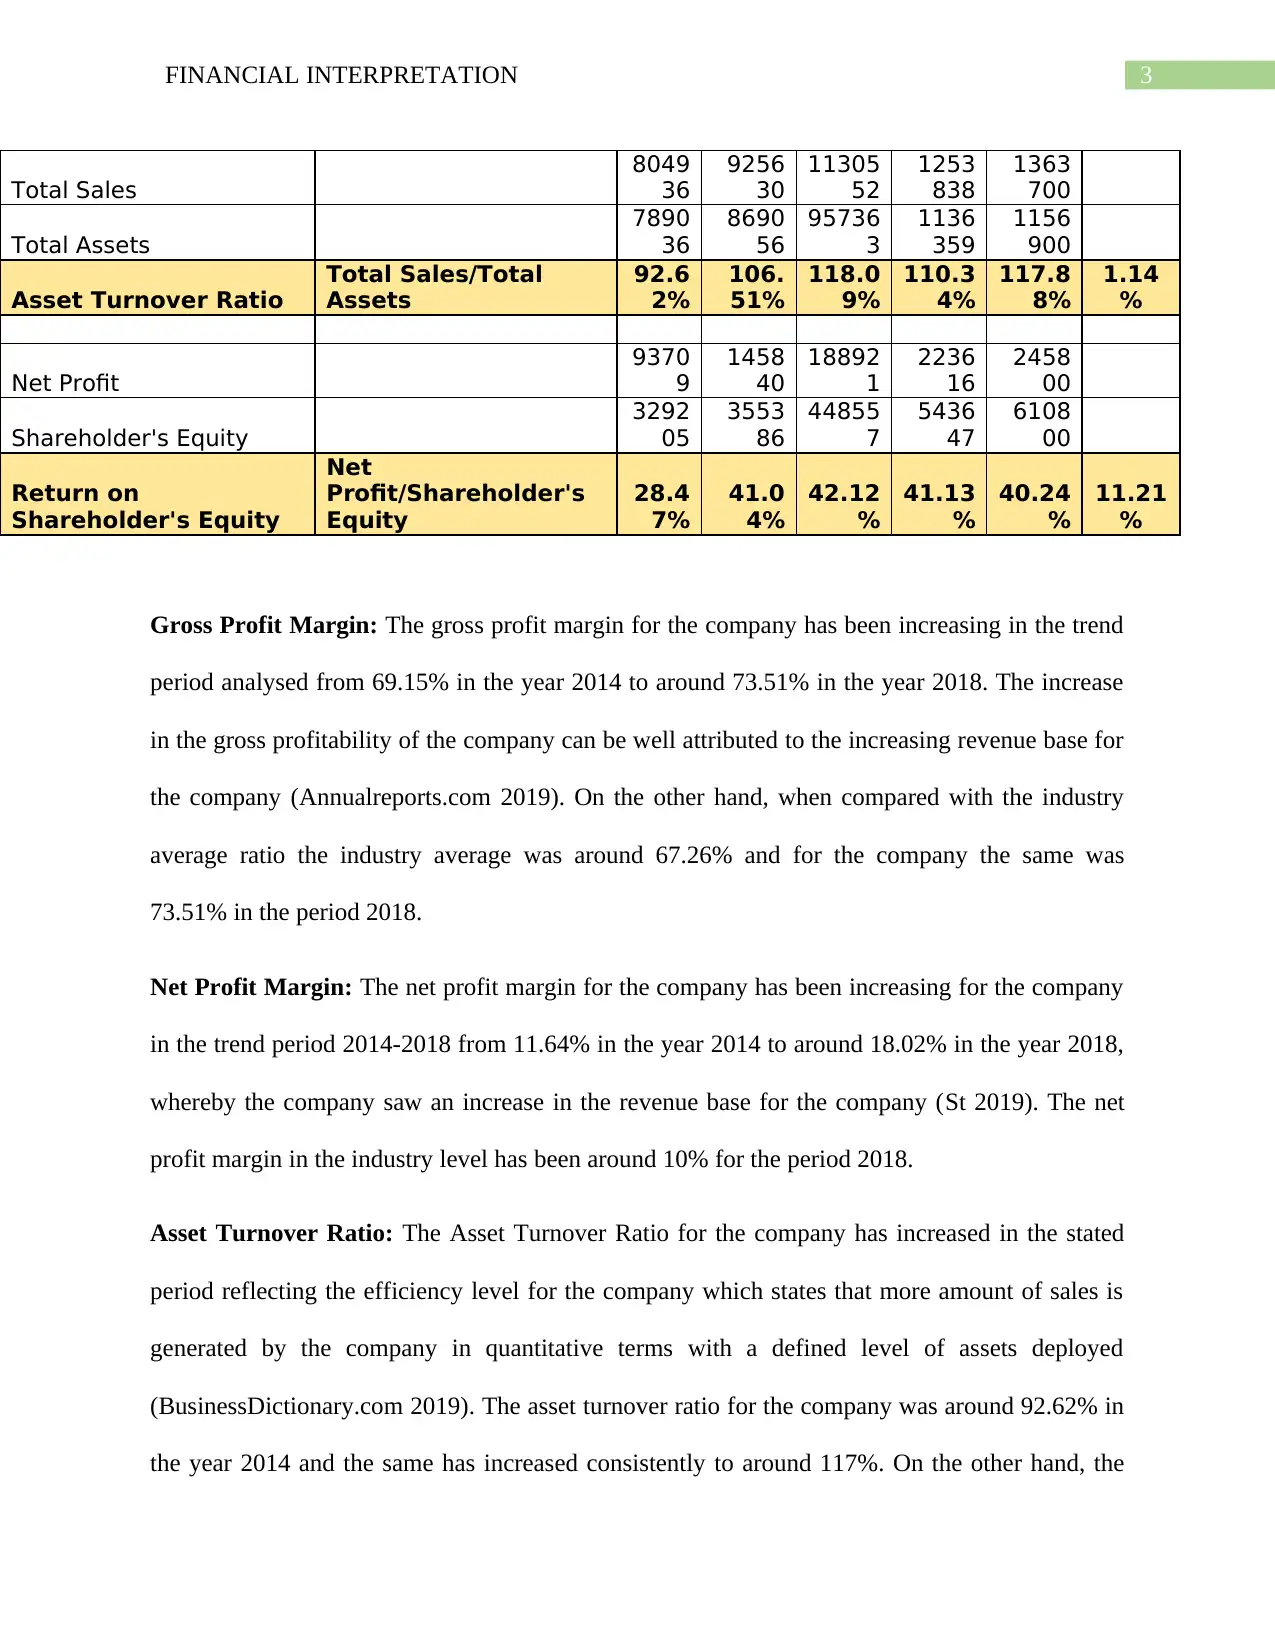
Asset Turnover Ratio
Total Sales/Total
Assets
92.6
2%
106.
51%
118.0
9%
110.3
4%
117.8
8%
1.14
%
Net Profit
9370
9
1458
40
18892
1
2236
16
2458
00
Shareholder's Equity
3292
05
3553
86
44855
7
5436
47
6108
00
Return on
Shareholder's Equity
Net
Profit/Shareholder's
Equity
28.4
7%
41.0
4%
42.12
%
41.13
%
40.24
%
11.21
%
Gross Profit Margin: The gross profit margin for the company has been increasing in the trend
period analysed from 69.15% in the year 2014 to around 73.51% in the year 2018. The increase
in the gross profitability of the company can be well attributed to the increasing revenue base for
the company (Annualreports.com 2019). On the other hand, when compared with the industry
average ratio the industry average was around 67.26% and for the company the same was
73.51% in the period 2018.
Net Profit Margin: The net profit margin for the company has been increasing for the company
in the trend period 2014-2018 from 11.64% in the year 2014 to around 18.02% in the year 2018,
whereby the company saw an increase in the revenue base for the company (St 2019). The net
profit margin in the industry level has been around 10% for the period 2018.
Asset Turnover Ratio: The Asset Turnover Ratio for the company has increased in the stated
period reflecting the efficiency level for the company which states that more amount of sales is
generated by the company in quantitative terms with a defined level of assets deployed
(BusinessDictionary.com 2019). The asset turnover ratio for the company was around 92.62% in
the year 2014 and the same has increased consistently to around 117%. On the other hand, the
Total Sales
8049
36
9256
30
11305
52
1253
838
1363
700
Total Assets
7890
36
8690
56
95736
3
1136
359
1156
900
Asset Turnover Ratio
Total Sales/Total
Assets
92.6
2%
106.
51%
118.0
9%
110.3
4%
117.8
8%
1.14
%
Net Profit
9370
9
1458
40
18892
1
2236
16
2458
00
Shareholder's Equity
3292
05
3553
86
44855
7
5436
47
6108
00
Return on
Shareholder's Equity
Net
Profit/Shareholder's
Equity
28.4
7%
41.0
4%
42.12
%
41.13
%
40.24
%
11.21
%
Gross Profit Margin: The gross profit margin for the company has been increasing in the trend
period analysed from 69.15% in the year 2014 to around 73.51% in the year 2018. The increase
in the gross profitability of the company can be well attributed to the increasing revenue base for
the company (Annualreports.com 2019). On the other hand, when compared with the industry
average ratio the industry average was around 67.26% and for the company the same was
73.51% in the period 2018.
Net Profit Margin: The net profit margin for the company has been increasing for the company
in the trend period 2014-2018 from 11.64% in the year 2014 to around 18.02% in the year 2018,
whereby the company saw an increase in the revenue base for the company (St 2019). The net
profit margin in the industry level has been around 10% for the period 2018.
Asset Turnover Ratio: The Asset Turnover Ratio for the company has increased in the stated
period reflecting the efficiency level for the company which states that more amount of sales is
generated by the company in quantitative terms with a defined level of assets deployed
(BusinessDictionary.com 2019). The asset turnover ratio for the company was around 92.62% in
the year 2014 and the same has increased consistently to around 117%. On the other hand, the
Paraphrase This Document
Need a fresh take? Get an instant paraphrase of this document with our AI Paraphraser
4FINANCIAL INTERPRETATION
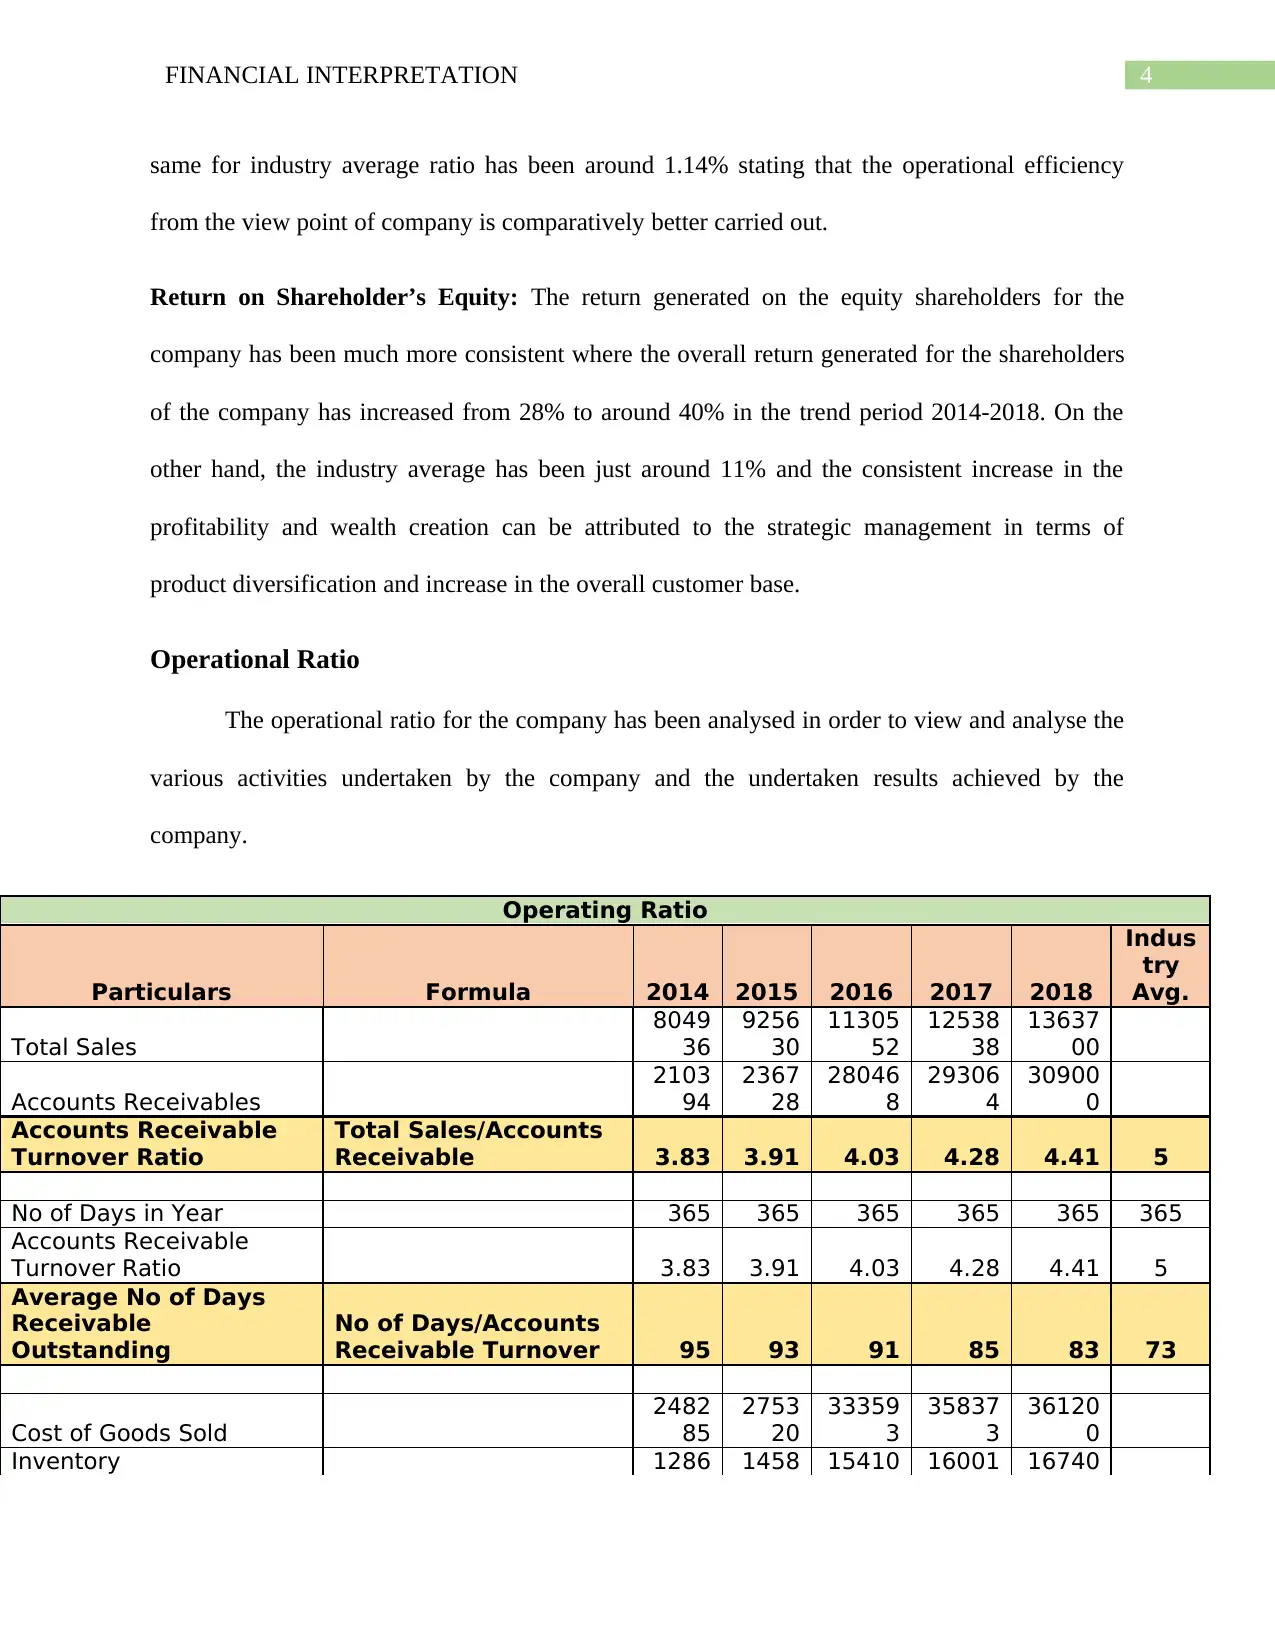
same for industry average ratio has been around 1.14% stating that the operational efficiency
from the view point of company is comparatively better carried out.
Return on Shareholder’s Equity: The return generated on the equity shareholders for the
company has been much more consistent where the overall return generated for the shareholders
of the company has increased from 28% to around 40% in the trend period 2014-2018. On the
other hand, the industry average has been just around 11% and the consistent increase in the
profitability and wealth creation can be attributed to the strategic management in terms of
product diversification and increase in the overall customer base.
Operational Ratio
The operational ratio for the company has been analysed in order to view and analyse the
various activities undertaken by the company and the undertaken results achieved by the
company.
Operating Ratio
Particulars Formula 2014 2015 2016 2017 2018
Indus
try
Avg.
Total Sales
8049
36
9256
30
11305
52
12538
38
13637
00
Accounts Receivables
2103
94
2367
28
28046
8
29306
4
30900
0
Accounts Receivable
Turnover Ratio
Total Sales/Accounts
Receivable 3.83 3.91 4.03 4.28 4.41 5
No of Days in Year 365 365 365 365 365 365
Accounts Receivable
Turnover Ratio 3.83 3.91 4.03 4.28 4.41 5
Average No of Days
Receivable
Outstanding
No of Days/Accounts
Receivable Turnover 95 93 91 85 83 73
Cost of Goods Sold
2482
85
2753
20
33359
3
35837
3
36120
0
Inventory 1286 1458 15410 16001 16740
5FINANCIAL INTERPRETATION
13 61 3 1 0
Inventory Turnover
Ratio
Cost of Goods
Sold/Inventory 1.93 1.89 2.16 2.24 2.16 2.33
No of Days in Year 365 365 365 365 365 365
Inventory Turnover Ratio 1.93 1.89 2.16 2.24 2.16 2.33
Average No of Days
Inventory in Stock
No of Days/Inventory
Turnover Ratio 189 193 169 163 169 157
Accounts Receivable Turnover Ratio: The ratio indicate the ability of the company in
collecting the outstanding amount that is due with the debtors of the company. The ratio
for the company should be showing an increasing trend reflecting the ability of the
company in collecting the due amount and quickly converting the accounts receivable
into cash. The ratio has been around 3.83 times and the same has shown a growth trend to
around 4.41 times in the year 2018 reflecting that the management of the company has
been deploying several credit negotiation terms and better credit terms for collecting the
due receivables. On the other hand, the receivables period for the industry level has been
around 5 times. While, if the same has been seen from daily time period basis the average
number of days taken in collecting the due amount the same has reduced for the company
from 95 days to around 83 days. The industry average has been much more consistent in
this aspect where other companies are taking around 73 days for the purpose of collecting
the due amount. It shows that the management of the company should adopt better
collection policy and terms to match up with the industry levels. Better and quick
collection of the accounts receivable of the company will be allowing the management of
the company avoid the loss of recording credit loss or bad debts in the books of account.
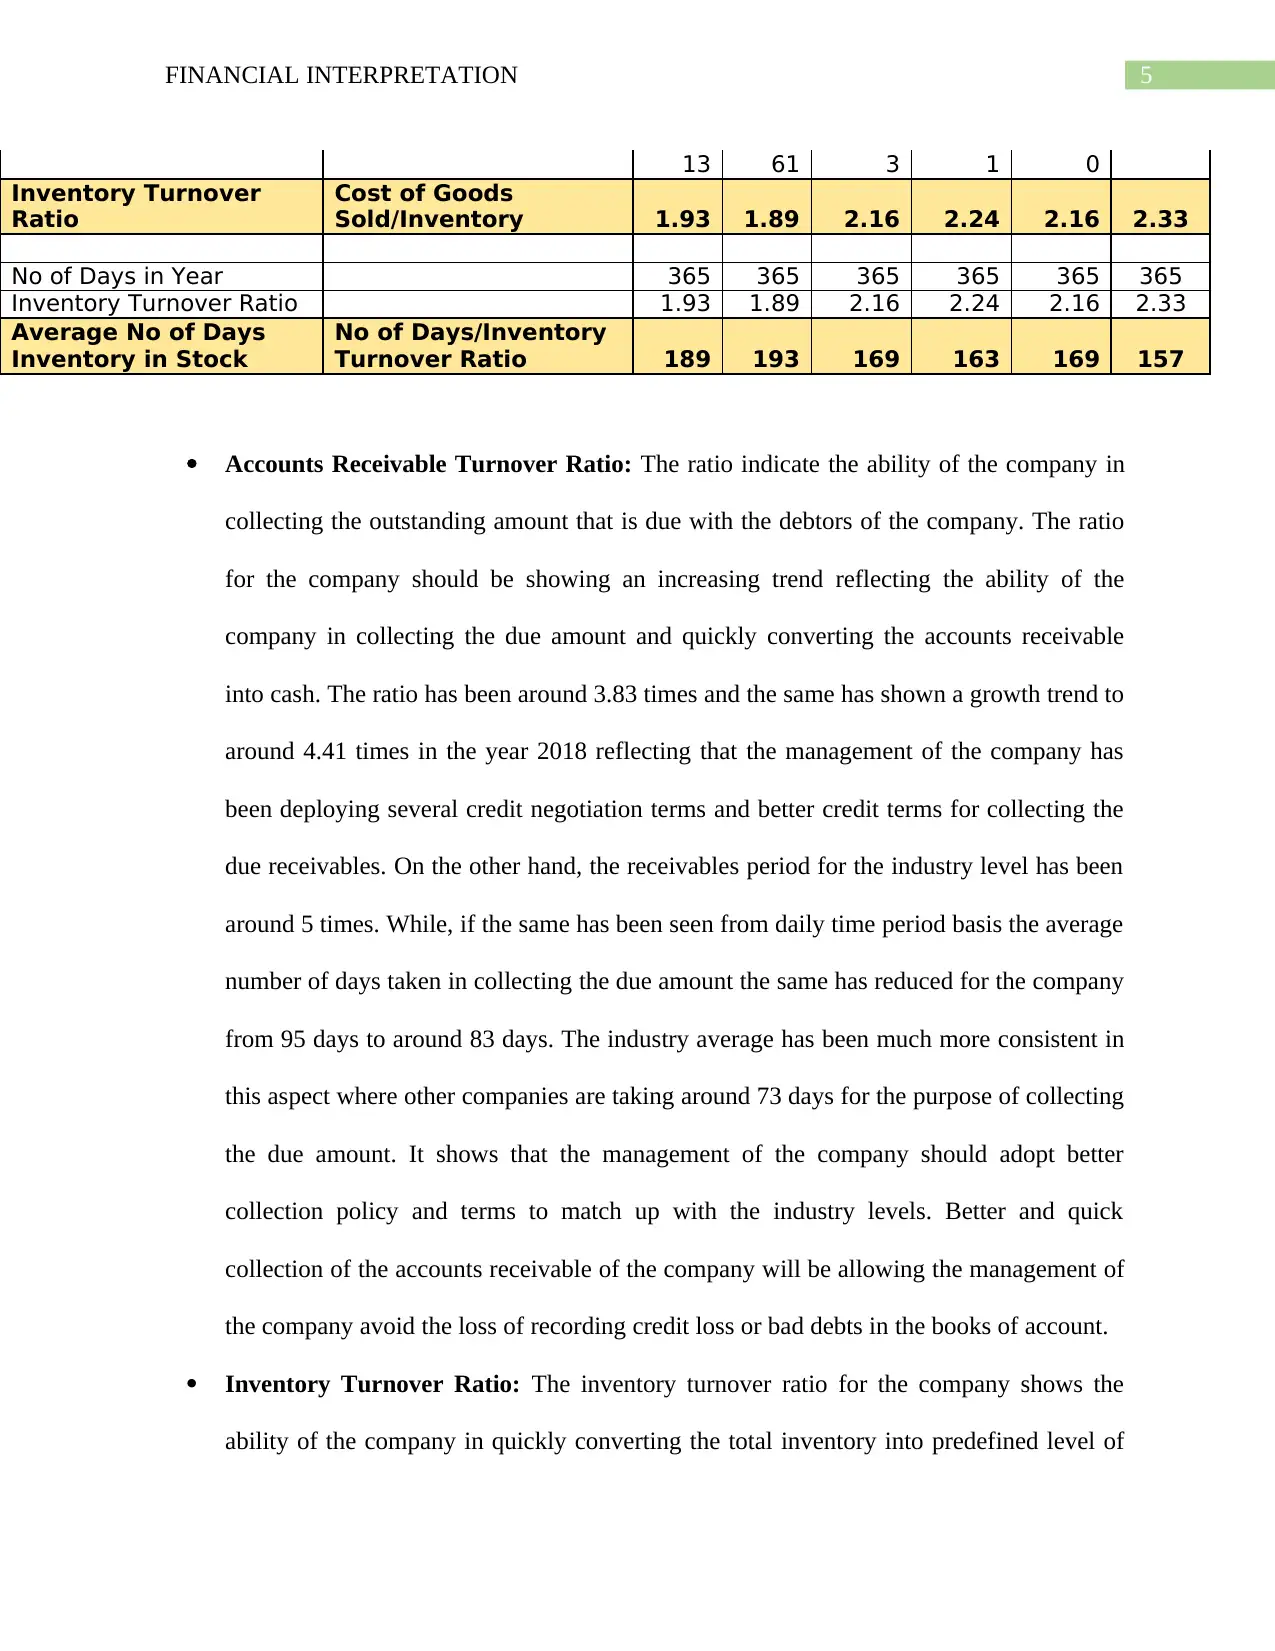
Inventory Turnover Ratio: The inventory turnover ratio for the company shows the
ability of the company in quickly converting the total inventory into predefined level of
13 61 3 1 0
Inventory Turnover
Ratio
Cost of Goods
Sold/Inventory 1.93 1.89 2.16 2.24 2.16 2.33
No of Days in Year 365 365 365 365 365 365
Inventory Turnover Ratio 1.93 1.89 2.16 2.24 2.16 2.33
Average No of Days
Inventory in Stock
No of Days/Inventory
Turnover Ratio 189 193 169 163 169 157
Accounts Receivable Turnover Ratio: The ratio indicate the ability of the company in
collecting the outstanding amount that is due with the debtors of the company. The ratio
for the company should be showing an increasing trend reflecting the ability of the
company in collecting the due amount and quickly converting the accounts receivable
into cash. The ratio has been around 3.83 times and the same has shown a growth trend to
around 4.41 times in the year 2018 reflecting that the management of the company has
been deploying several credit negotiation terms and better credit terms for collecting the
due receivables. On the other hand, the receivables period for the industry level has been
around 5 times. While, if the same has been seen from daily time period basis the average
number of days taken in collecting the due amount the same has reduced for the company
from 95 days to around 83 days. The industry average has been much more consistent in
this aspect where other companies are taking around 73 days for the purpose of collecting
the due amount. It shows that the management of the company should adopt better
collection policy and terms to match up with the industry levels. Better and quick
collection of the accounts receivable of the company will be allowing the management of
the company avoid the loss of recording credit loss or bad debts in the books of account.
Inventory Turnover Ratio: The inventory turnover ratio for the company shows the
ability of the company in quickly converting the total inventory into predefined level of
⊘ This is a preview!⊘
Do you want full access?
Subscribe today to unlock all pages.
Trusted by 1+ million students worldwide
6FINANCIAL INTERPRETATION
sales for the company. The inventory turnover ratio for the company has been increasing
for the company in the trend period from 1.93 times to around 2.33 times in the year
2018. If the given set of numbers are well compared with the industry average then the
same is said to be inconsistency for the company where the ratio was around 2.33 times
(Robinson et al., 2015). The ratio can be better understood with the help of the days taken
by the management of company in converting the inventory into total sales. From the
company’s view point the same was around 189 days and the same was seen decreasing
to around 169 days in the period 2014-2018. The industry average ratio for the company
has been around 157 days stating that the management of the company must look upon
the sales and marketing activity along with the ways deployed in inventory management
of the company.
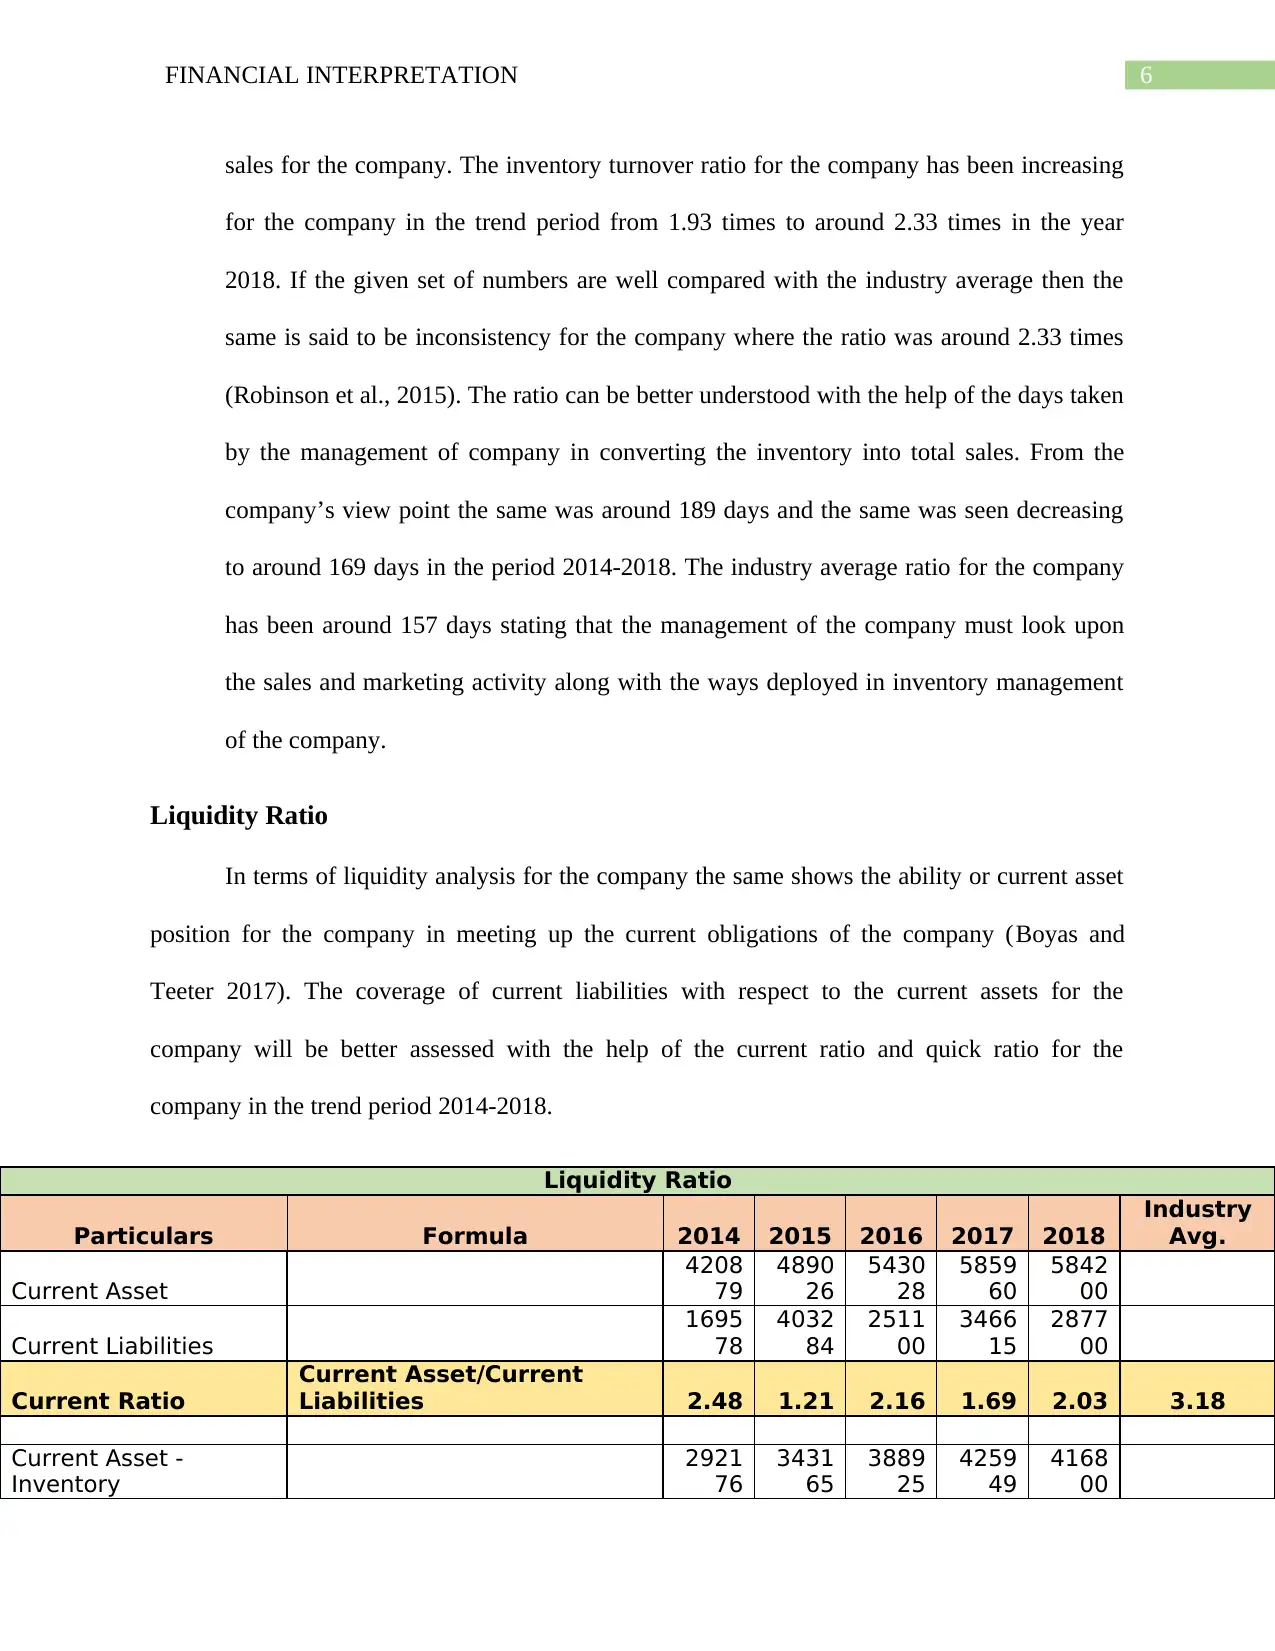
Liquidity Ratio
In terms of liquidity analysis for the company the same shows the ability or current asset
position for the company in meeting up the current obligations of the company (Boyas and
Teeter 2017). The coverage of current liabilities with respect to the current assets for the
company will be better assessed with the help of the current ratio and quick ratio for the
company in the trend period 2014-2018.
Liquidity Ratio
Particulars Formula 2014 2015 2016 2017 2018
Industry
Avg.
Current Asset
4208
79
4890
26
5430
28
5859
60
5842
00
Current Liabilities
1695
78
4032
84
2511
00
3466
15
2877
00
Current Ratio
Current Asset/Current
Liabilities 2.48 1.21 2.16 1.69 2.03 3.18
Current Asset -
Inventory
2921
76
3431
65
3889
25
4259
49
4168
00
sales for the company. The inventory turnover ratio for the company has been increasing
for the company in the trend period from 1.93 times to around 2.33 times in the year
2018. If the given set of numbers are well compared with the industry average then the
same is said to be inconsistency for the company where the ratio was around 2.33 times
(Robinson et al., 2015). The ratio can be better understood with the help of the days taken
by the management of company in converting the inventory into total sales. From the
company’s view point the same was around 189 days and the same was seen decreasing
to around 169 days in the period 2014-2018. The industry average ratio for the company
has been around 157 days stating that the management of the company must look upon
the sales and marketing activity along with the ways deployed in inventory management
of the company.
Liquidity Ratio
In terms of liquidity analysis for the company the same shows the ability or current asset
position for the company in meeting up the current obligations of the company (Boyas and
Teeter 2017). The coverage of current liabilities with respect to the current assets for the
company will be better assessed with the help of the current ratio and quick ratio for the
company in the trend period 2014-2018.
Liquidity Ratio
Particulars Formula 2014 2015 2016 2017 2018
Industry
Avg.
Current Asset
4208
79
4890
26
5430
28
5859
60
5842
00
Current Liabilities
1695
78
4032
84
2511
00
3466
15
2877
00
Current Ratio
Current Asset/Current
Liabilities 2.48 1.21 2.16 1.69 2.03 3.18
Current Asset -
Inventory
2921
76
3431
65
3889
25
4259
49
4168
00
Paraphrase This Document
Need a fresh take? Get an instant paraphrase of this document with our AI Paraphraser
7FINANCIAL INTERPRETATION
Current Liabilities
1695
78
4032
84
2511
00
3466
15
2877
00
Quick Ratio
Liquid Assets/Current
Liabilities 1.72 0.85 1.55 1.23 1.45 2.52
Current Ratio: The current ratio for the company has been around 2.48 times in the year 2014
and the same has consistently decreased to around 2.03 times in the year 2018 stating that liquid
asset management are not done effectively by the company. The company has though maintained
a adequate amount of current assets with respect to the current liabilities of the company if seen
from a standard view point. However, it is important to note that the same changes from industry
to industry perspective where relevant trend of ratio here is around 3.18 times. The high current
ratio from the industry perspective states that the working capital required here is very high so
that the company can effectively carry out the operations of the company.
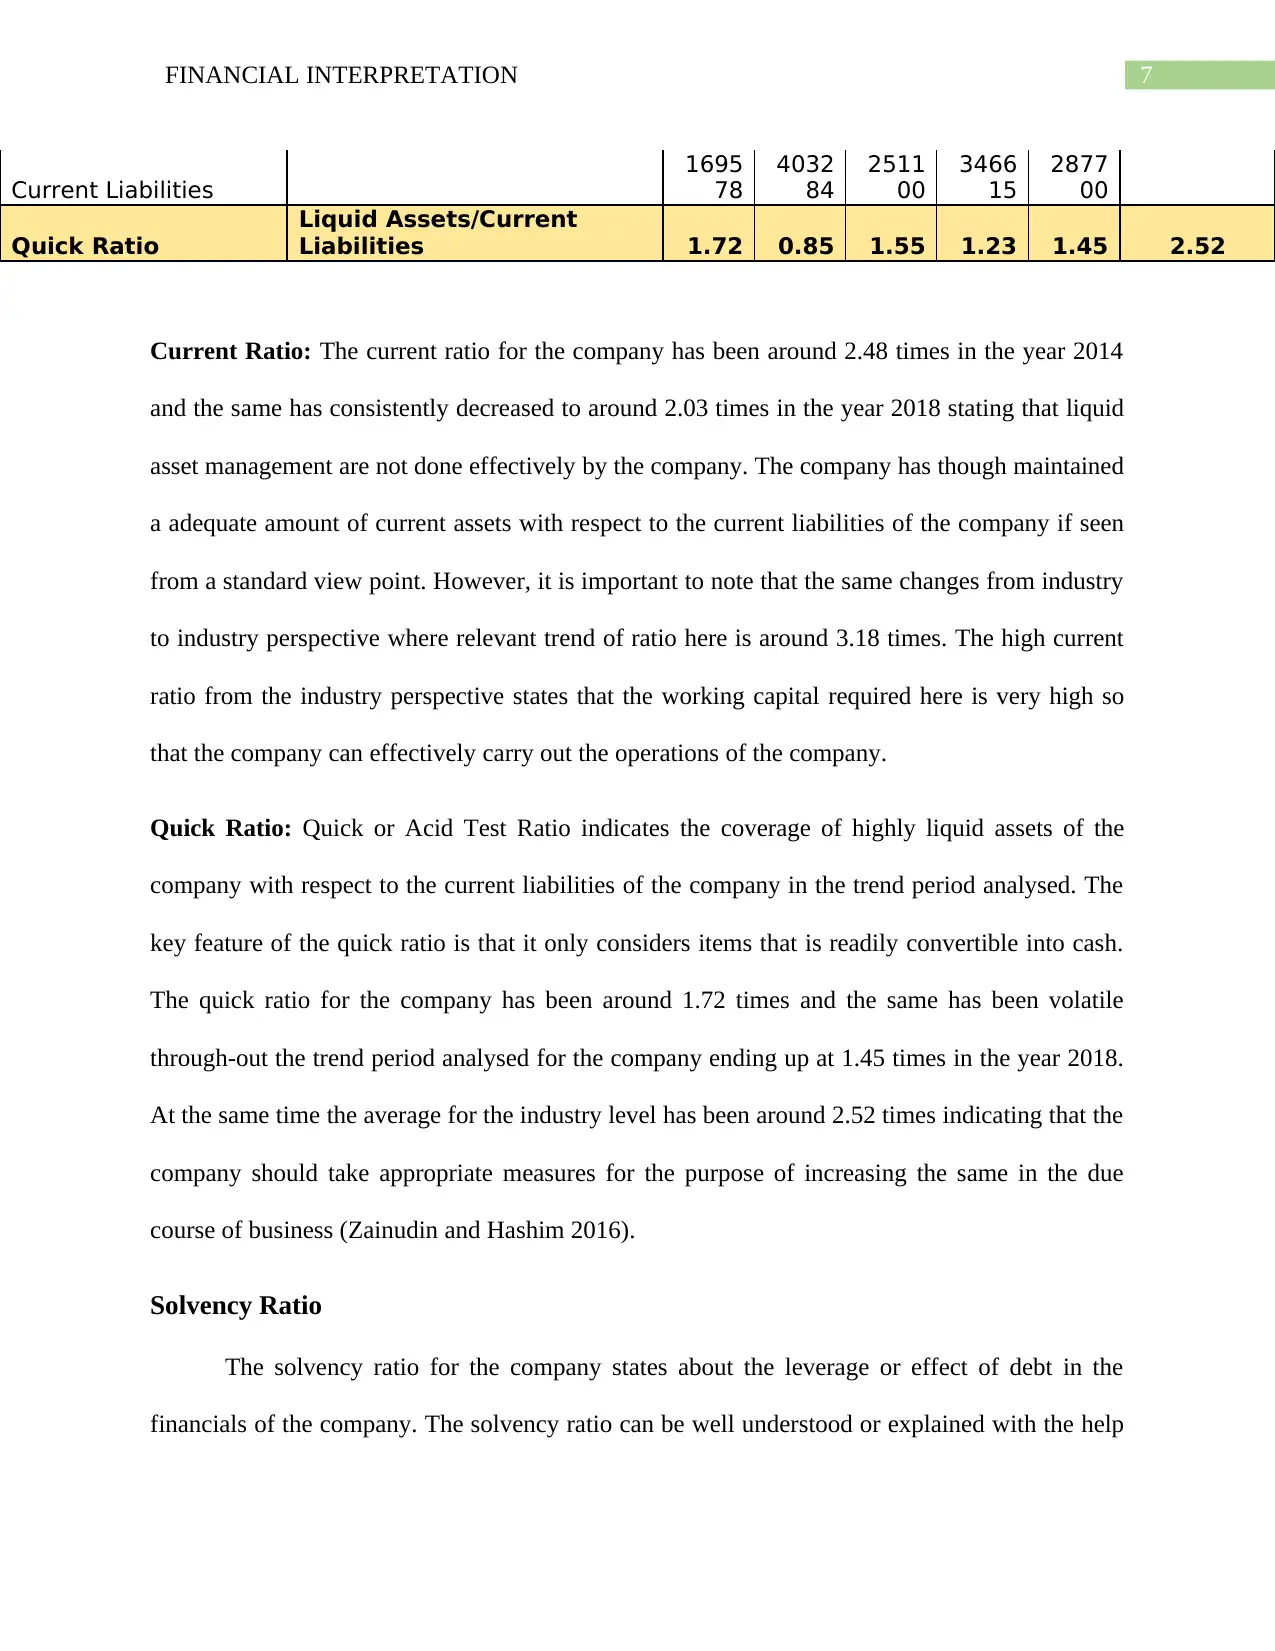
Quick Ratio: Quick or Acid Test Ratio indicates the coverage of highly liquid assets of the
company with respect to the current liabilities of the company in the trend period analysed. The
key feature of the quick ratio is that it only considers items that is readily convertible into cash.
The quick ratio for the company has been around 1.72 times and the same has been volatile
through-out the trend period analysed for the company ending up at 1.45 times in the year 2018.
At the same time the average for the industry level has been around 2.52 times indicating that the
company should take appropriate measures for the purpose of increasing the same in the due
course of business (Zainudin and Hashim 2016).
Solvency Ratio
The solvency ratio for the company states about the leverage or effect of debt in the
financials of the company. The solvency ratio can be well understood or explained with the help
Current Liabilities
1695
78
4032
84
2511
00
3466
15
2877
00
Quick Ratio
Liquid Assets/Current
Liabilities 1.72 0.85 1.55 1.23 1.45 2.52
Current Ratio: The current ratio for the company has been around 2.48 times in the year 2014
and the same has consistently decreased to around 2.03 times in the year 2018 stating that liquid
asset management are not done effectively by the company. The company has though maintained
a adequate amount of current assets with respect to the current liabilities of the company if seen
from a standard view point. However, it is important to note that the same changes from industry
to industry perspective where relevant trend of ratio here is around 3.18 times. The high current
ratio from the industry perspective states that the working capital required here is very high so
that the company can effectively carry out the operations of the company.
Quick Ratio: Quick or Acid Test Ratio indicates the coverage of highly liquid assets of the
company with respect to the current liabilities of the company in the trend period analysed. The
key feature of the quick ratio is that it only considers items that is readily convertible into cash.
The quick ratio for the company has been around 1.72 times and the same has been volatile
through-out the trend period analysed for the company ending up at 1.45 times in the year 2018.
At the same time the average for the industry level has been around 2.52 times indicating that the
company should take appropriate measures for the purpose of increasing the same in the due
course of business (Zainudin and Hashim 2016).
Solvency Ratio
The solvency ratio for the company states about the leverage or effect of debt in the
financials of the company. The solvency ratio can be well understood or explained with the help
8FINANCIAL INTERPRETATION
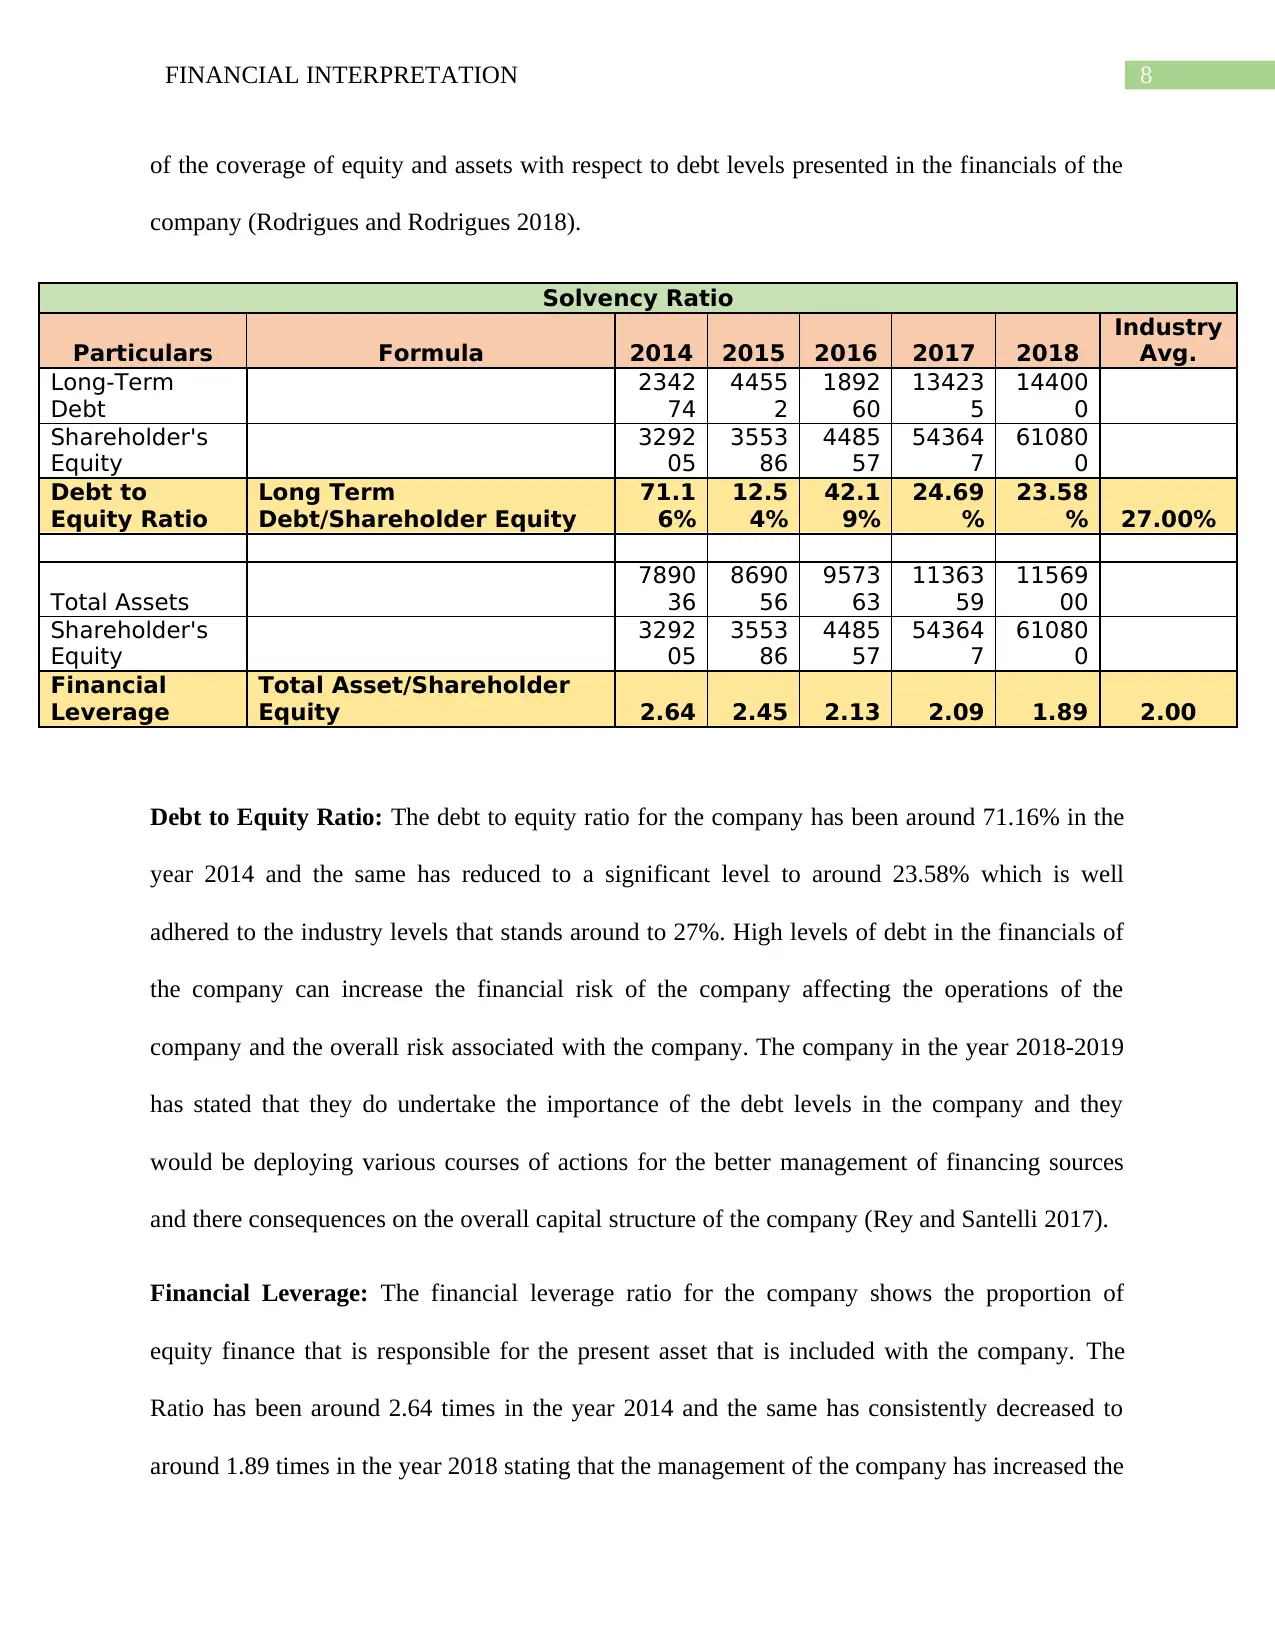
of the coverage of equity and assets with respect to debt levels presented in the financials of the
company (Rodrigues and Rodrigues 2018).
Solvency Ratio
Particulars Formula 2014 2015 2016 2017 2018
Industry
Avg.
Long-Term
Debt
2342
74
4455
2
1892
60
13423
5
14400
0
Shareholder's
Equity
3292
05
3553
86
4485
57
54364
7
61080
0
Debt to
Equity Ratio
Long Term
Debt/Shareholder Equity
71.1
6%
12.5
4%
42.1
9%
24.69
%
23.58
% 27.00%
Total Assets
7890
36
8690
56
9573
63
11363
59
11569
00
Shareholder's
Equity
3292
05
3553
86
4485
57
54364
7
61080
0
Financial
Leverage
Total Asset/Shareholder
Equity 2.64 2.45 2.13 2.09 1.89 2.00
Debt to Equity Ratio: The debt to equity ratio for the company has been around 71.16% in the
year 2014 and the same has reduced to a significant level to around 23.58% which is well
adhered to the industry levels that stands around to 27%. High levels of debt in the financials of
the company can increase the financial risk of the company affecting the operations of the
company and the overall risk associated with the company. The company in the year 2018-2019
has stated that they do undertake the importance of the debt levels in the company and they
would be deploying various courses of actions for the better management of financing sources
and there consequences on the overall capital structure of the company (Rey and Santelli 2017).
Financial Leverage: The financial leverage ratio for the company shows the proportion of
equity finance that is responsible for the present asset that is included with the company. The
Ratio has been around 2.64 times in the year 2014 and the same has consistently decreased to
around 1.89 times in the year 2018 stating that the management of the company has increased the
⊘ This is a preview!⊘
Do you want full access?
Subscribe today to unlock all pages.
Trusted by 1+ million students worldwide
9FINANCIAL INTERPRETATION
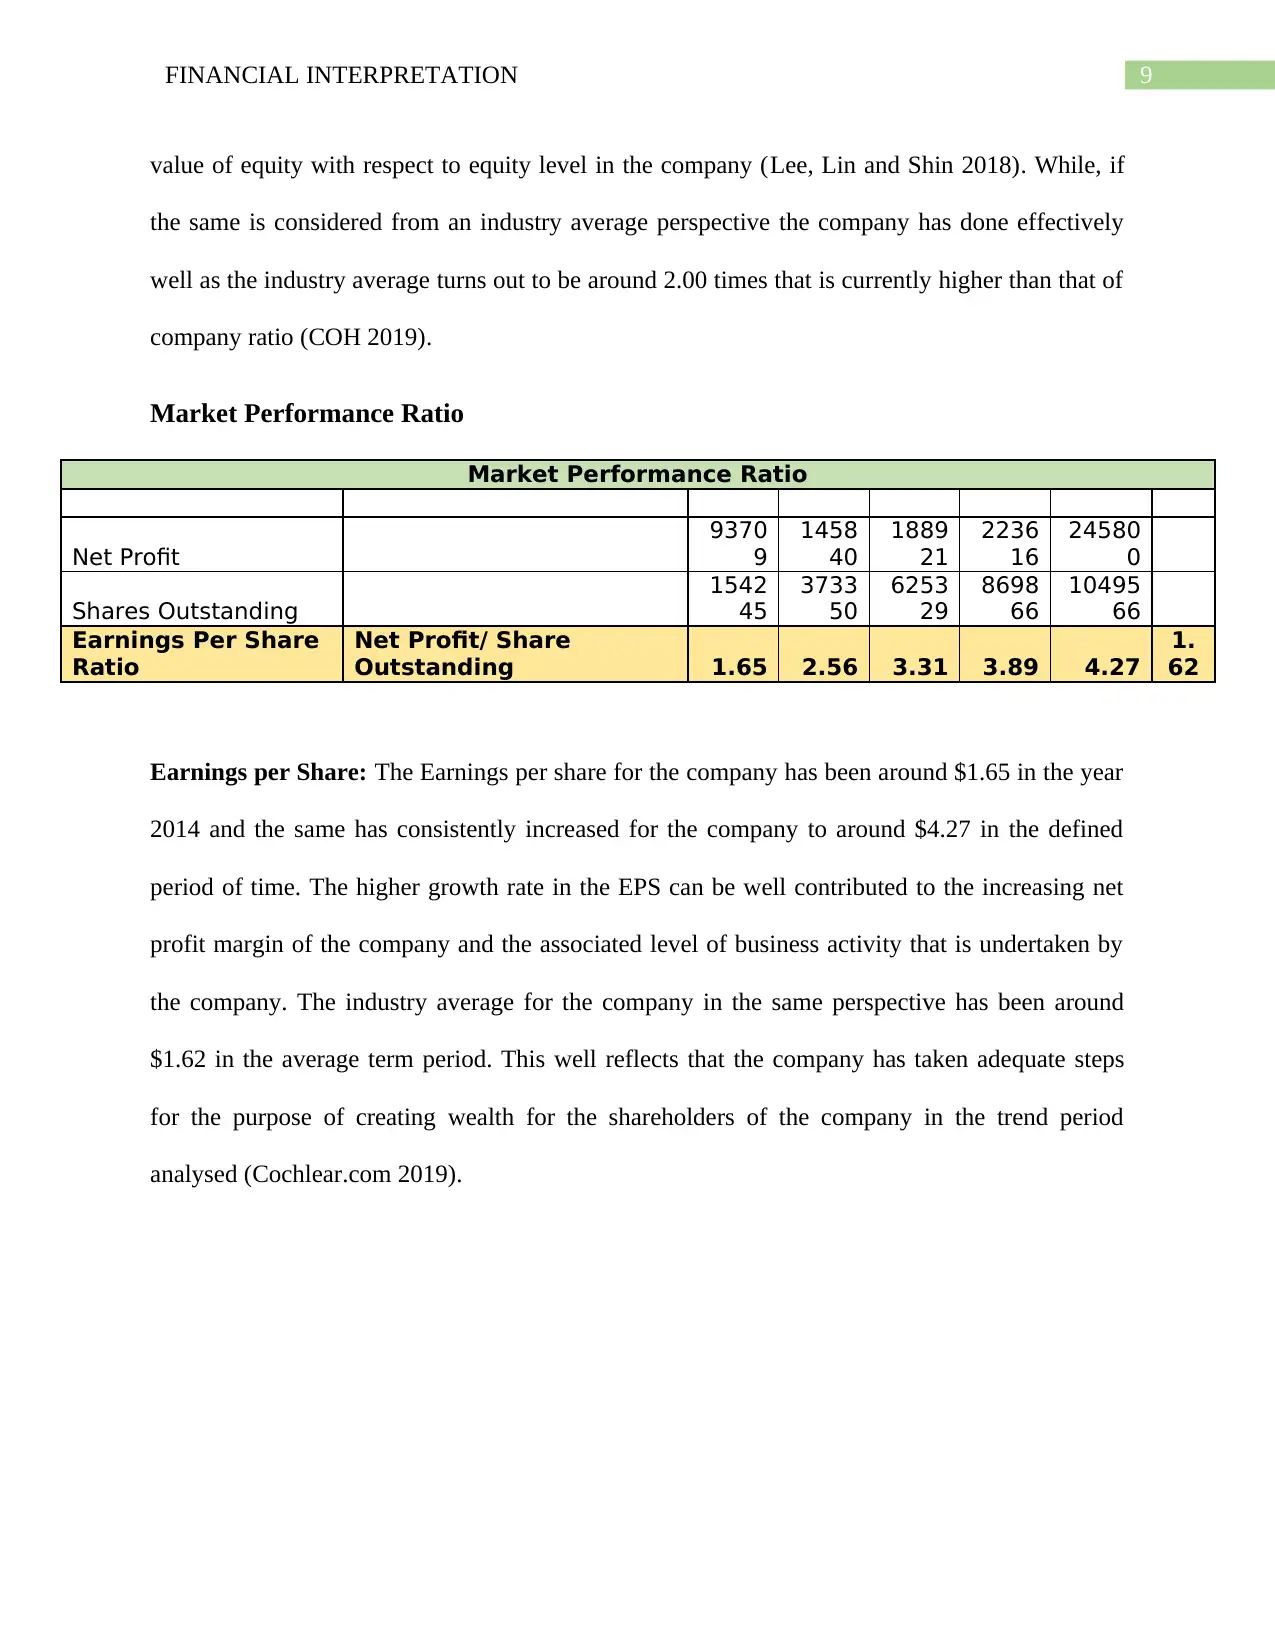
value of equity with respect to equity level in the company (Lee, Lin and Shin 2018). While, if
the same is considered from an industry average perspective the company has done effectively
well as the industry average turns out to be around 2.00 times that is currently higher than that of
company ratio (COH 2019).
Market Performance Ratio
Market Performance Ratio
Net Profit
9370
9
1458
40
1889
21
2236
16
24580
0
Shares Outstanding
1542
45
3733
50
6253
29
8698
66
10495
66
Earnings Per Share
Ratio
Net Profit/ Share
Outstanding 1.65 2.56 3.31 3.89 4.27
1.
62
Earnings per Share: The Earnings per share for the company has been around $1.65 in the year
2014 and the same has consistently increased for the company to around $4.27 in the defined
period of time. The higher growth rate in the EPS can be well contributed to the increasing net
profit margin of the company and the associated level of business activity that is undertaken by
the company. The industry average for the company in the same perspective has been around
$1.62 in the average term period. This well reflects that the company has taken adequate steps
for the purpose of creating wealth for the shareholders of the company in the trend period
analysed (Cochlear.com 2019).
Paraphrase This Document
Need a fresh take? Get an instant paraphrase of this document with our AI Paraphraser
10FINANCIAL INTERPRETATION
References
(COH), C. 2019. Cochlear Ltd (COH) Financial Ratios. [online] Investing.com. Available at:
https://www.investing.com/equities/cochlear-limited-ratios [Accessed 8 Sep. 2019].
Annualreports.com. 2019. [online] Available at:
http://www.annualreports.com/HostedData/AnnualReports/PDF/ASX_COH_2018.pdf [Accessed
8 Sep. 2019].
Boyas, E. and Teeter, R., 2017. Teaching Financial Ratio Analysis using XBRL.
In Developments in Business Simulation and Experiential Learning: Proceedings of the Annual
ABSEL conference (Vol. 44, No. 1).
BusinessDictionary.com. 2019. What are operating ratios? definition and meaning. [online]
Available at: http://www.businessdictionary.com/definition/operating-ratios.html [Accessed 8
Sep. 2019].
Cochlear.com. 2019. [online] Available at: https://www.cochlear.com/2a3956c0-f09d-4ce7-
a8c9-8b0ddccf1999/en_corporate_annualreport2015_financial_1.54mb.pdf?
MOD=AJPERES&CONVERT_TO=url&CACHEID=ROOTWORKSPACE-
2a3956c0-f09d-4ce7-a8c9-8b0ddccf1999-l5rAnvz [Accessed 8 Sep. 2019].
Lee, P.T.W., Lin, C.W. and Shin, S.H., 2018. Financial performance evaluation of shipping
companies using entropy and grey relation analysis. In Multi-Criteria Decision Making in
Maritime Studies and Logistics (pp. 219-247). Springer, Cham.
11FINANCIAL INTERPRETATION
Marketscreener.com. 2019. COCHLEAR LIMITED : Financial Data Forecasts Estimates and
Expectations | COH | AU000000COH5 | MarketScreener. [online] Available at:
https://www.marketscreener.com/COCHLEAR-LIMITED-6491483/financials/ [Accessed 8 Sep.
2019].
Rey, A. and Santelli, F., 2017. The relationship between financial ratios and sporting
performance in Italy‟ s Serie A. International Journal of Business and Management, 12(12),
pp.53-63.
Robinson, T.R., Henry, E., Pirie, W.L. and Broihahn, M.A., 2015. International financial
statement analysis. John Wiley & Sons.
Rodrigues, L. and Rodrigues, L., 2018. Economic-financial performance of the Brazilian
sugarcane energy industry: An empirical evaluation using financial ratio, cluster and
discriminant analysis. Biomass and bioenergy, 108, pp.289-296.
St, S. 2019. Is Cochlear Limited (ASX:COH) A Financially Strong Company?. [online] Simply
Wall St. Available at: https://simplywall.st/stocks/au/healthcare/asx-coh/cochlear-shares/news/is-
cochlear-limited-asxcoh-a-financially-strong-company/ [Accessed 8 Sep. 2019].
Zainudin, E.F. and Hashim, H.A., 2016. Detecting fraudulent financial reporting using financial
ratio. Journal of Financial Reporting and Accounting, 14(2), pp.266-278.
⊘ This is a preview!⊘
Do you want full access?
Subscribe today to unlock all pages.
Trusted by 1+ million students worldwide
1 out of 12
Related Documents


Your All-in-One AI-Powered Toolkit for Academic Success.
+13062052269
info@desklib.com
Available 24*7 on WhatsApp / Email
![[object Object]](/_next/static/media/star-bottom.7253800d.svg)
Unlock your academic potential
Copyright © 2020–2026 A2Z Services. All Rights Reserved. Developed and managed by ZUCOL.