Financial Investments in Practice: Portfolio Analysis and Strategy
VerifiedAdded on 2023/06/12
|29
|3355
|113
Report
AI Summary
This report provides a comprehensive analysis of a financial investment portfolio, focusing on macroeconomic and industry analysis, fundamental and technical analysis of selected stocks (Royal Mail PLC, Sainsbury’s Plc, and BT Group Plc), and portfolio formation. The macroeconomic analysis evaluates the UK economy using indicators like CPI, GDP, and unemployment figures. Industry analysis justifies the selection of stocks from different sectors based on business cycle phases. Fundamental analysis assesses the strengths of each company, while technical analysis interprets stock trends using FTSE 100 index and individual stock graphs. The report also discusses the yield curve and the inclusion of bonds in the equity portfolio, culminating in the formation of an optimized portfolio and its evaluation.

FINANCIAL
INVESTMENTS IN
PRACTICE COURSEWORK
INVESTMENTS IN
PRACTICE COURSEWORK
Paraphrase This Document
Need a fresh take? Get an instant paraphrase of this document with our AI Paraphraser

Table of Contents
Factsheet of the Portfolio.............................................................................................................3
Macroeconomic analysis.............................................................................................................4
Industry Analysis.........................................................................................................................5
Fundamental analysis...................................................................................................................6
Technical analysis........................................................................................................................9
Short discussion over current yield curve while adding a bond to equity portfolio..................11
Portfolio formation....................................................................................................................13
REFERENCES..............................................................................................................................16
APPENDICES...............................................................................................................................18
Appendix A: Royal Mail PLC: Discounted Free Cash Flow Spreadsheet................................18
Appendix B: Sainsbury’s Plc Discounted Free Cash Flow Spreadsheet...................................20
Appendix C: BT Group Plc Discounted Free Cash Flow Spreadsheet.....................................22
APPENDIX – D: Price Multiples Model Spreadsheet..............................................................24
Appendix E: Portfolio Optimisation Spreadsheet......................................................................25
Appendix F: Portfolio Evaluation Spreadsheet.........................................................................29
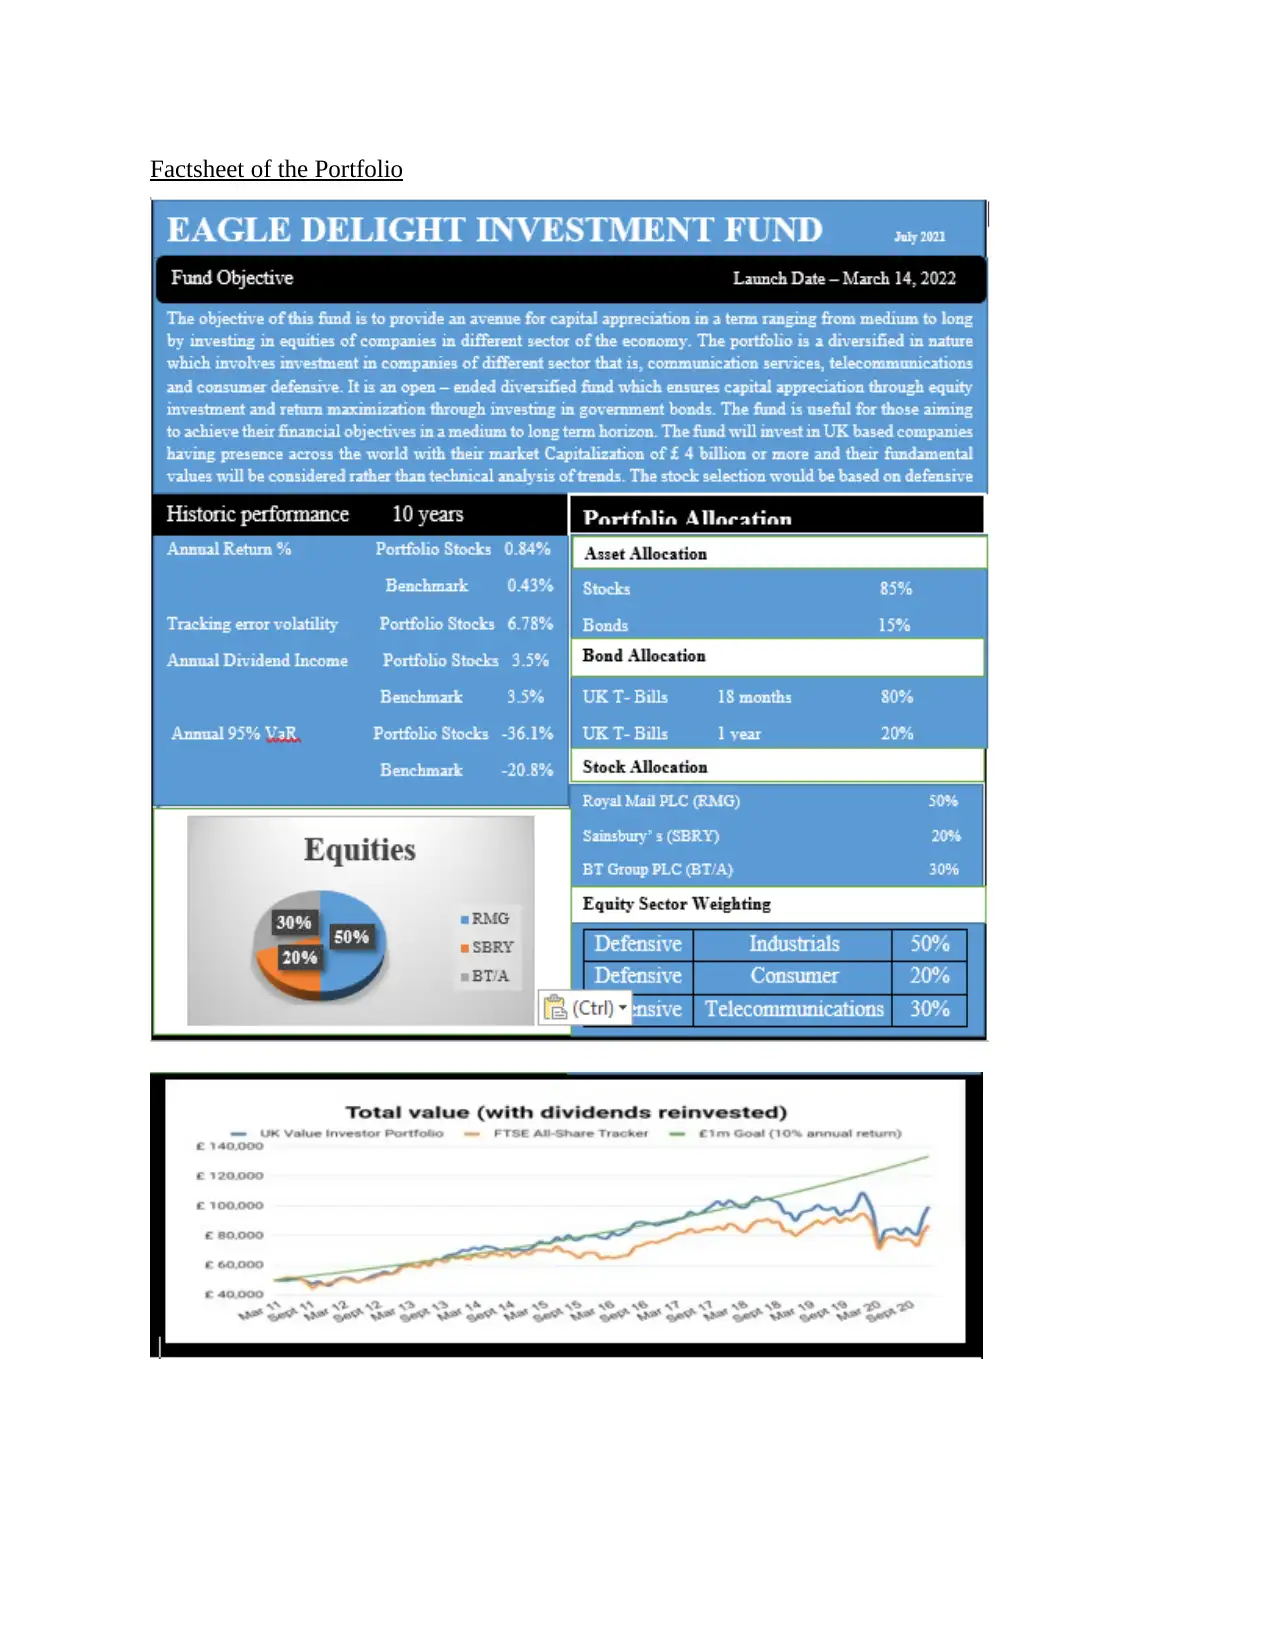
Factsheet of the Portfolio
⊘ This is a preview!⊘
Do you want full access?
Subscribe today to unlock all pages.
Trusted by 1+ million students worldwide
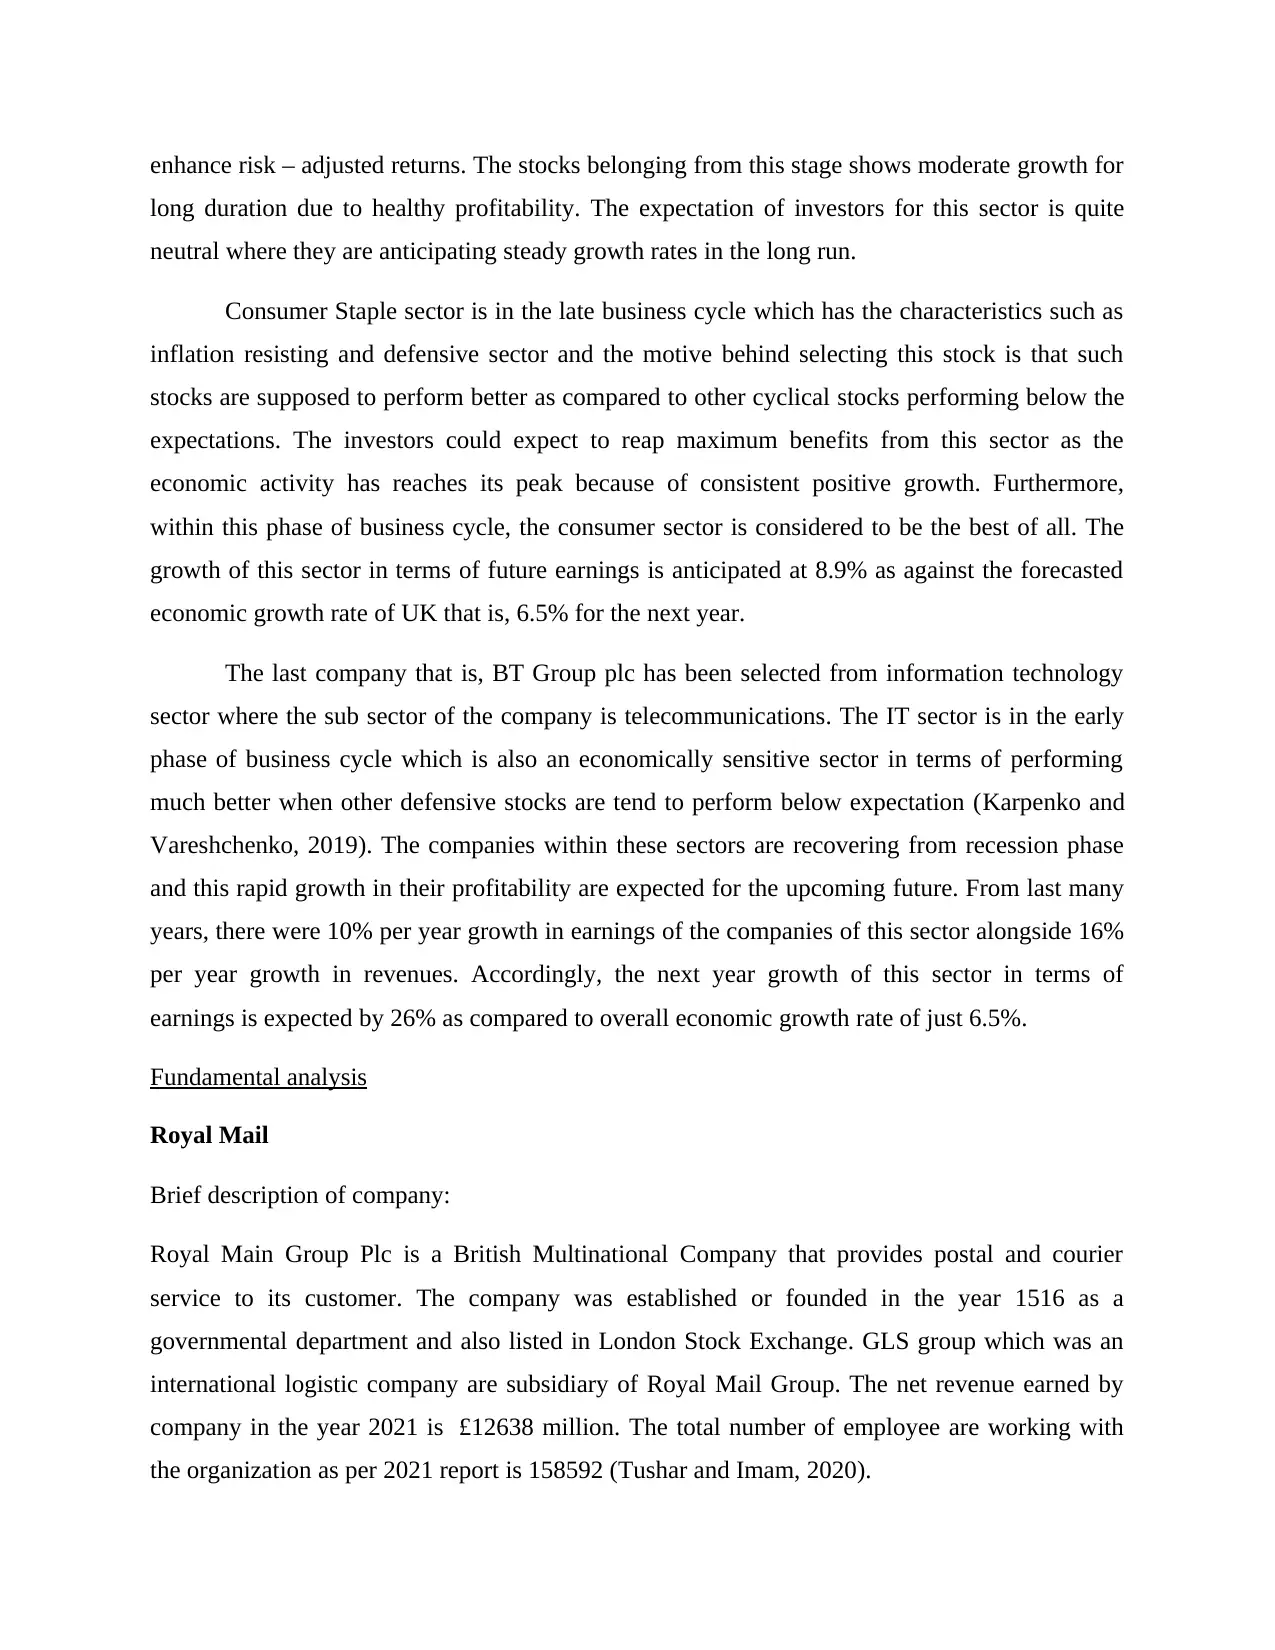
Macroeconomic analysis
To study the economy as a whole, the macroeconomics as a branch of economic helps
investors in doing so. Furthermore, there are several economic indicators which can be defined
as a piece of economic data that allows an investor to analyze and interpret the present and future
possibilities of investments. For evaluating UK economy’s health and suitability for making
future investments, the following economic indicators are necessarily required to be analyzed.
Consumer Price Index: This economic indicator facilitates measurement of aggregate price level
existing within an economy by taking into account a bundle of goods and services that are
commonly bought or consumed (Madhavi, 2020). Through this indicator or economic measure,
the changes taking place within the purchasing power of economy’s currency can be determined.
The UK’s CPI has rose by 5.5% in the last 12 months ending at January 2022 which indicates the
rise in the price level of goods and services consumed by citizens such as house, food, medical,
transportation, etc.
Gross domestic product: GDP of any economy is considered as the most important indicator of
the overall economic health and performance during the past years. Accordingly, the economy of
UK has $3.44 trillion GDP for the year 2021 which results in gaining 5th rank across the
economies of the world in terms of GDP where the growth in it as compared to previous year
was identified as 6.76%. The positive growth rate of UK GDP indicates that the economic health
and performance of UK has been improving as compared to the health and performance in
previous year which was -9.85 in terms of GDP growth rate.
Unemployment figure: There is an increase in the rate of unemployment within the economy of
UK from 4.6% in the year 2020 to 4.9% in the year 2021. The rising unemployment in an
economy may results in homelessness, poverty, debt and housing stress for the citizens
(Yankovyi and et.al., 2021). Accordingly, there must be an impact over the viewpoint of
investors with regard to making additional investments within different sectors of the economy
and companies therein. The reason behind such resistant from investment is that the rising
unemployment leads to reduction in production of products and services by businesses.
Paraphrase This Document
Need a fresh take? Get an instant paraphrase of this document with our AI Paraphraser
Industry Analysis
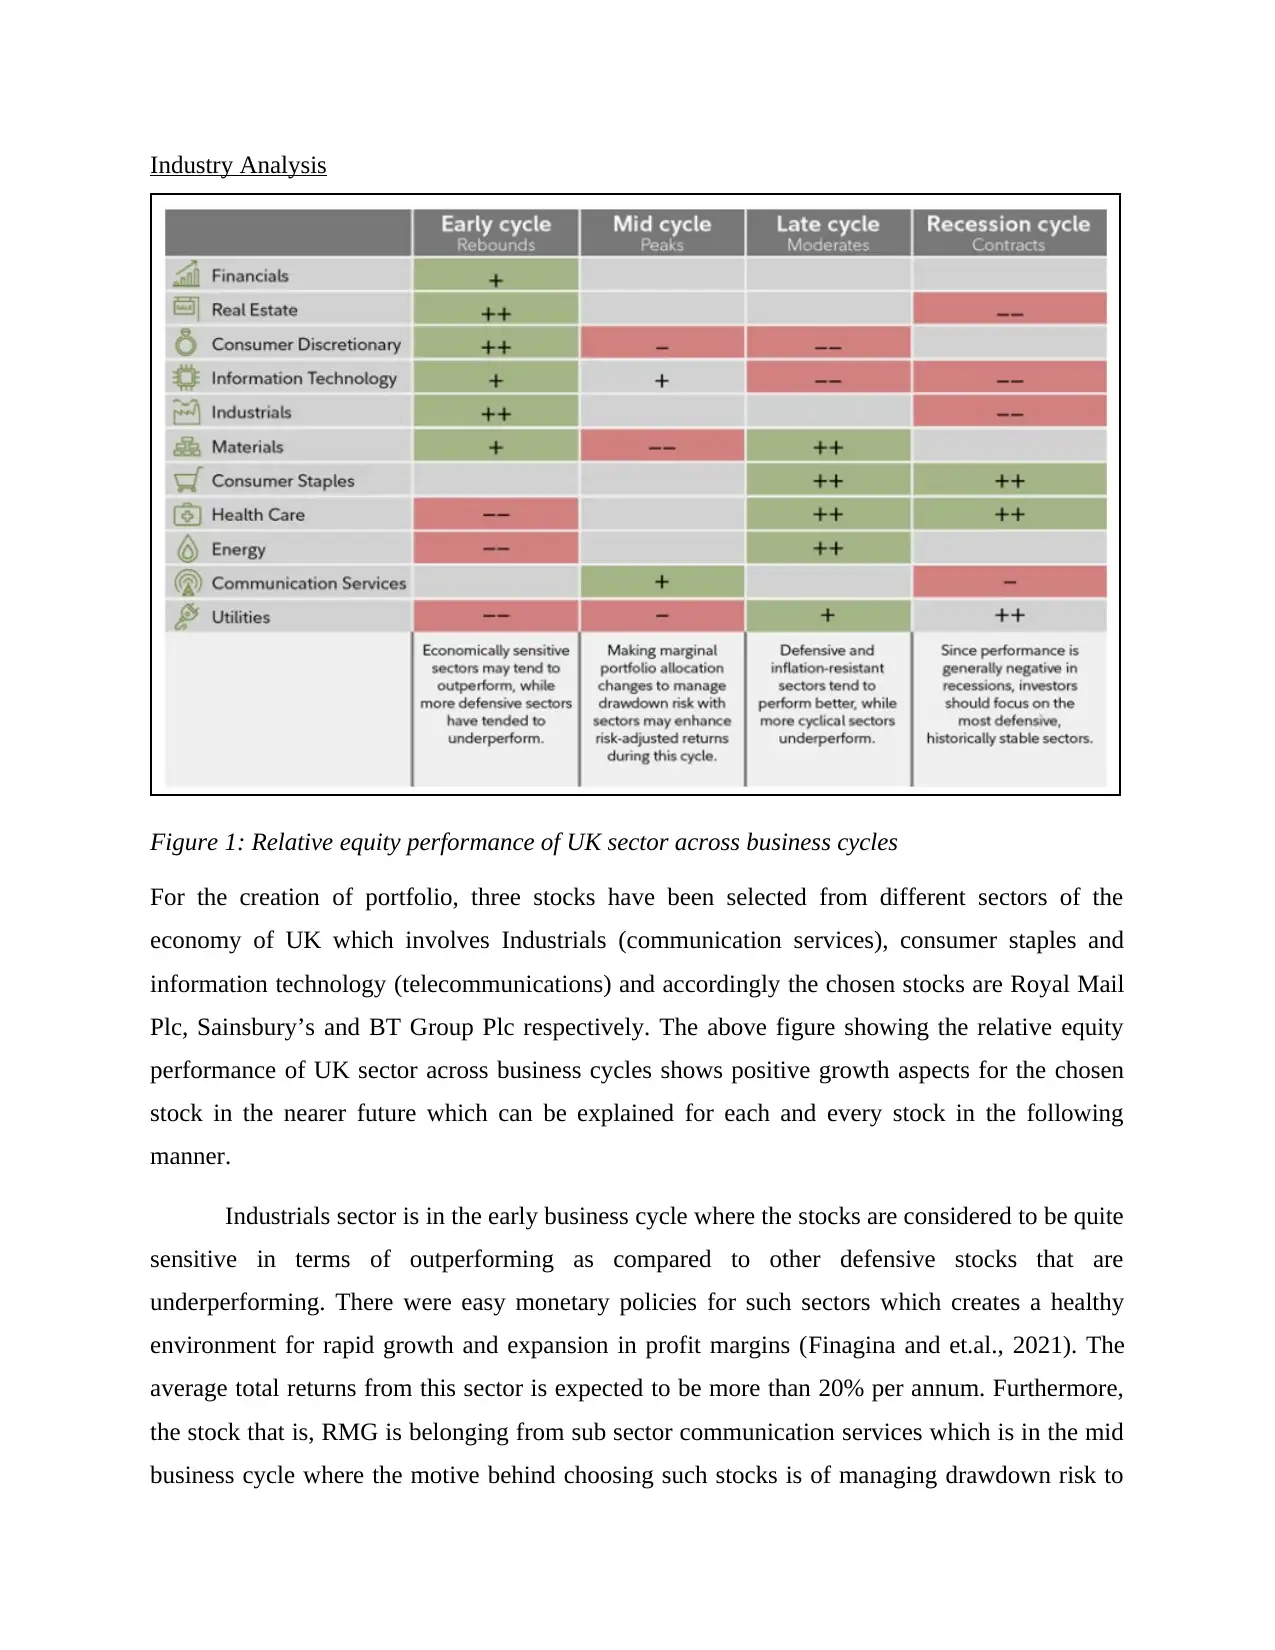
Figure 1: Relative equity performance of UK sector across business cycles
For the creation of portfolio, three stocks have been selected from different sectors of the
economy of UK which involves Industrials (communication services), consumer staples and
information technology (telecommunications) and accordingly the chosen stocks are Royal Mail
Plc, Sainsbury’s and BT Group Plc respectively. The above figure showing the relative equity
performance of UK sector across business cycles shows positive growth aspects for the chosen
stock in the nearer future which can be explained for each and every stock in the following
manner.
Industrials sector is in the early business cycle where the stocks are considered to be quite
sensitive in terms of outperforming as compared to other defensive stocks that are
underperforming. There were easy monetary policies for such sectors which creates a healthy
environment for rapid growth and expansion in profit margins (Finagina and et.al., 2021). The
average total returns from this sector is expected to be more than 20% per annum. Furthermore,
the stock that is, RMG is belonging from sub sector communication services which is in the mid
business cycle where the motive behind choosing such stocks is of managing drawdown risk to
enhance risk – adjusted returns. The stocks belonging from this stage shows moderate growth for
long duration due to healthy profitability. The expectation of investors for this sector is quite
neutral where they are anticipating steady growth rates in the long run.
Consumer Staple sector is in the late business cycle which has the characteristics such as
inflation resisting and defensive sector and the motive behind selecting this stock is that such
stocks are supposed to perform better as compared to other cyclical stocks performing below the
expectations. The investors could expect to reap maximum benefits from this sector as the
economic activity has reaches its peak because of consistent positive growth. Furthermore,
within this phase of business cycle, the consumer sector is considered to be the best of all. The
growth of this sector in terms of future earnings is anticipated at 8.9% as against the forecasted
economic growth rate of UK that is, 6.5% for the next year.
The last company that is, BT Group plc has been selected from information technology
sector where the sub sector of the company is telecommunications. The IT sector is in the early
phase of business cycle which is also an economically sensitive sector in terms of performing
much better when other defensive stocks are tend to perform below expectation (Karpenko and
Vareshchenko, 2019). The companies within these sectors are recovering from recession phase
and this rapid growth in their profitability are expected for the upcoming future. From last many
years, there were 10% per year growth in earnings of the companies of this sector alongside 16%
per year growth in revenues. Accordingly, the next year growth of this sector in terms of
earnings is expected by 26% as compared to overall economic growth rate of just 6.5%.
Fundamental analysis
Royal Mail
Brief description of company:
Royal Main Group Plc is a British Multinational Company that provides postal and courier
service to its customer. The company was established or founded in the year 1516 as a
governmental department and also listed in London Stock Exchange. GLS group which was an
international logistic company are subsidiary of Royal Mail Group. The net revenue earned by
company in the year 2021 is £12638 million. The total number of employee are working with
the organization as per 2021 report is 158592 (Tushar and Imam, 2020).
⊘ This is a preview!⊘
Do you want full access?
Subscribe today to unlock all pages.
Trusted by 1+ million students worldwide
Strength:
The rating of RMG stock is 7 which indicate that investors should buy this stock in order
to earn high returns. It is stated that if the stock rating is 1 that investors should buy it, if
its rating is 2 that investors should hold it and if the rating is 7 that investors should buy
stocks.
The price earnings ratio of RMG stock is 3.96 which is low. The low price earnings ratio
of the company state that if the investors buy that stock than they will receive an
attractive amount of value from the company in the form of returns.
BT Group
Brief description of company:
BT Group is a British multinational telecommunication holding company having headquarter in
London, England. The company have its operation in more than 180 countries and is listed in
London Stock Exchange. BT Group is basically the largest provider of fixed line, broadband and
mobile service in the UK. The company was founded in the year 1846. The net revenue earned
by BT Group in the year 2021 was £21.370 billion. The total number of employees working with
BT Group are 99700 as per 2021 report.
Strength:
The stock of BT Group is basically trading at undemanding forward price earnings ratio
multiple of just 10. Also, the company support a potential dividend yield of 3.9% in the
current year which indicate that BT is one of the best stocks to buy for the investors.
As per the Wall street Analysts, the stock of BT Group is covered under Class A stock
which means that investors should buy the stocks of BT Group. This indicate that the
stock has the ability to outperform the market in the term of growth and health (Gabriel
and et.al., 2018).
Paraphrase This Document
Need a fresh take? Get an instant paraphrase of this document with our AI Paraphraser
J Sainsbury Plc
Brief description of company:
J Sainsbury Plc., trading as Sainsbury in the London Stock Exchange is one of the second largest
chain of supermarket in UK. The company was founded in the year 1869 and have its
headquarter in London, UK. The total number of shop the company have all over UK is 1428
shops and also have 16% share in the supermarket sector. The closest competitor of Sainsbury is
Tesco and Walmart. The net revenue earned by Sainsbury in the year 2021 was £29.048 billion.
The total number of employee working with the organization is 180000.
Strength:
As per Wall Street analysts, the investors should hold J Sainsbury stock because there are
currently 1 sell rating, 3 hold rating and 2 buy rating. As the hold rating is highest so the
investors should hold the stocks because company will outperform in future (Kahn,
2018).
The beta of J Sainsbury stock is 0.26 which indicate that investors would except it to be
2.6% as volatile as the market. It means a market return of 10% would mean a 2.6% gain
for the company. This also means that the company stock is only 26% risky as the index
(Guo and Wang, 2019).
Technical analysis
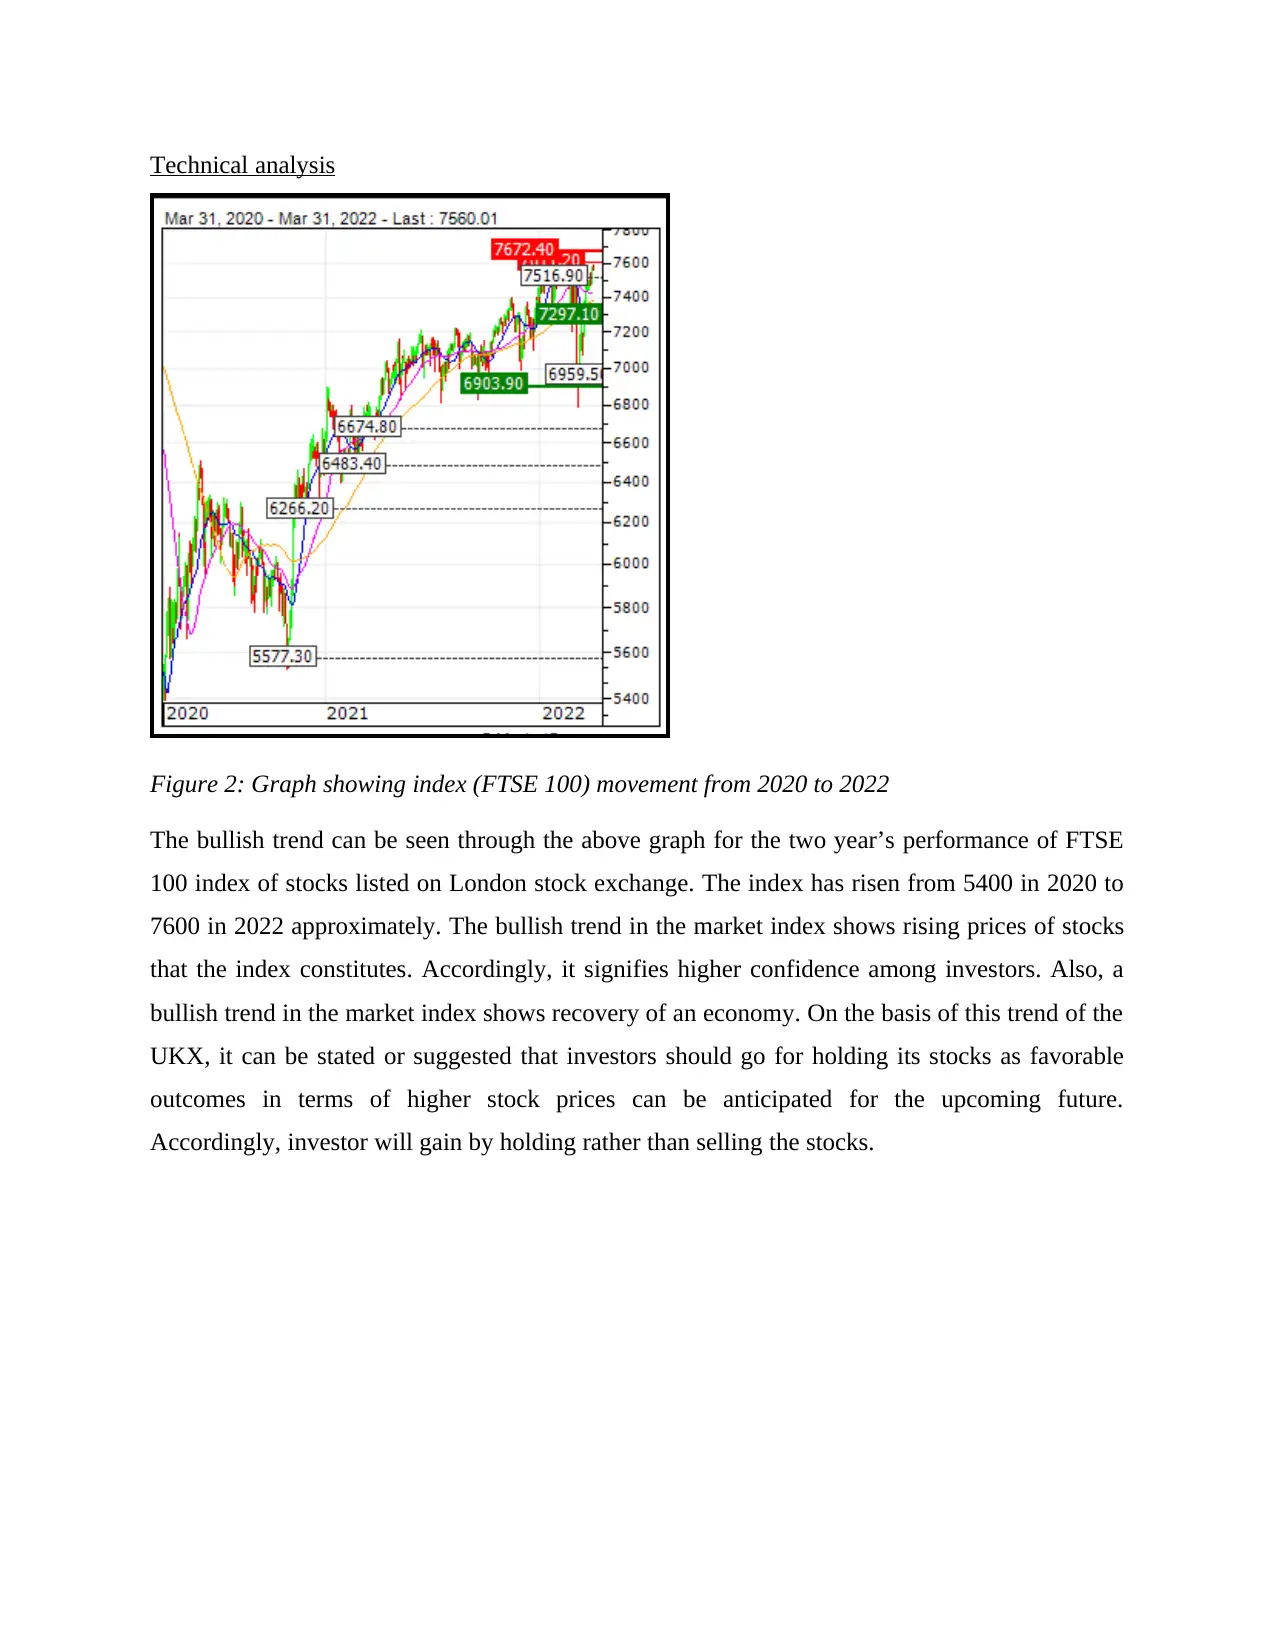
Figure 2: Graph showing index (FTSE 100) movement from 2020 to 2022
The bullish trend can be seen through the above graph for the two year’s performance of FTSE
100 index of stocks listed on London stock exchange. The index has risen from 5400 in 2020 to
7600 in 2022 approximately. The bullish trend in the market index shows rising prices of stocks
that the index constitutes. Accordingly, it signifies higher confidence among investors. Also, a
bullish trend in the market index shows recovery of an economy. On the basis of this trend of the
UKX, it can be stated or suggested that investors should go for holding its stocks as favorable
outcomes in terms of higher stock prices can be anticipated for the upcoming future.
Accordingly, investor will gain by holding rather than selling the stocks.
⊘ This is a preview!⊘
Do you want full access?
Subscribe today to unlock all pages.
Trusted by 1+ million students worldwide
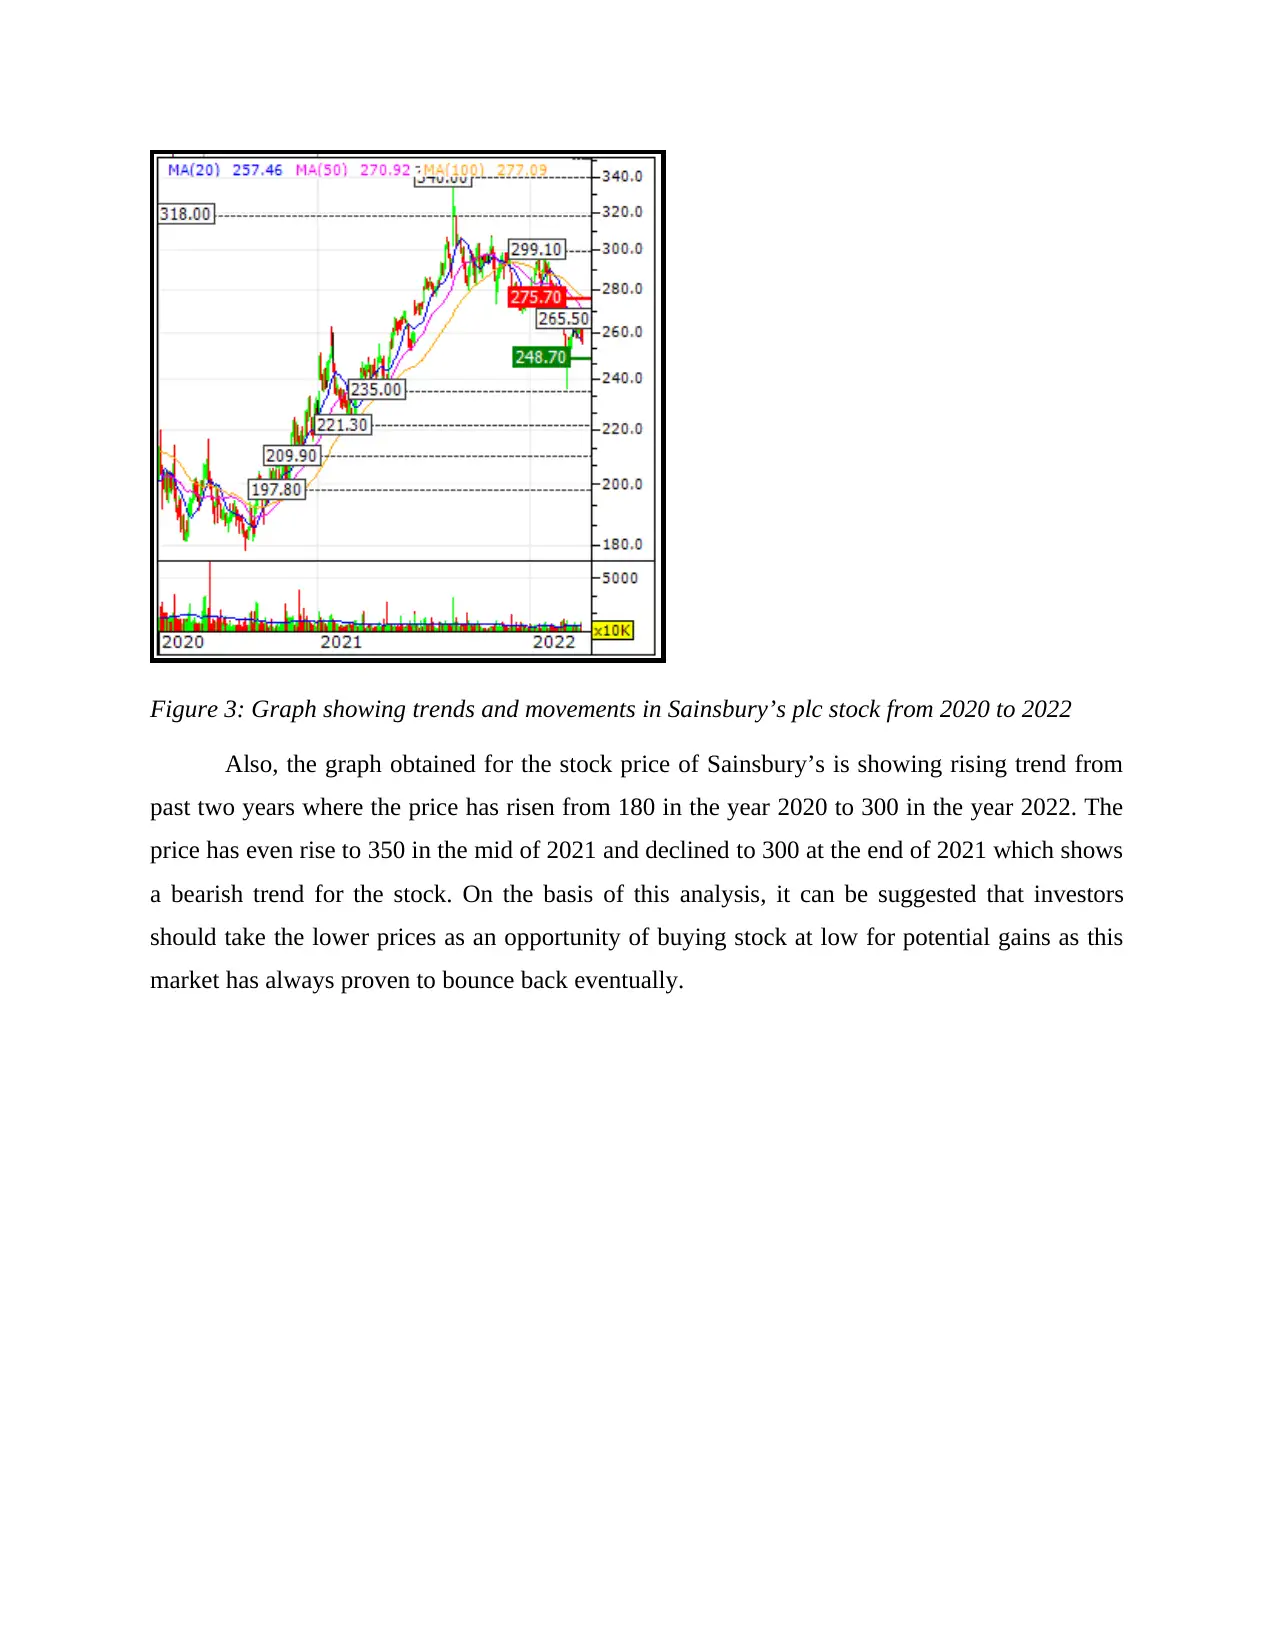
Figure 3: Graph showing trends and movements in Sainsbury’s plc stock from 2020 to 2022
Also, the graph obtained for the stock price of Sainsbury’s is showing rising trend from
past two years where the price has risen from 180 in the year 2020 to 300 in the year 2022. The
price has even rise to 350 in the mid of 2021 and declined to 300 at the end of 2021 which shows
a bearish trend for the stock. On the basis of this analysis, it can be suggested that investors
should take the lower prices as an opportunity of buying stock at low for potential gains as this
market has always proven to bounce back eventually.
Paraphrase This Document
Need a fresh take? Get an instant paraphrase of this document with our AI Paraphraser
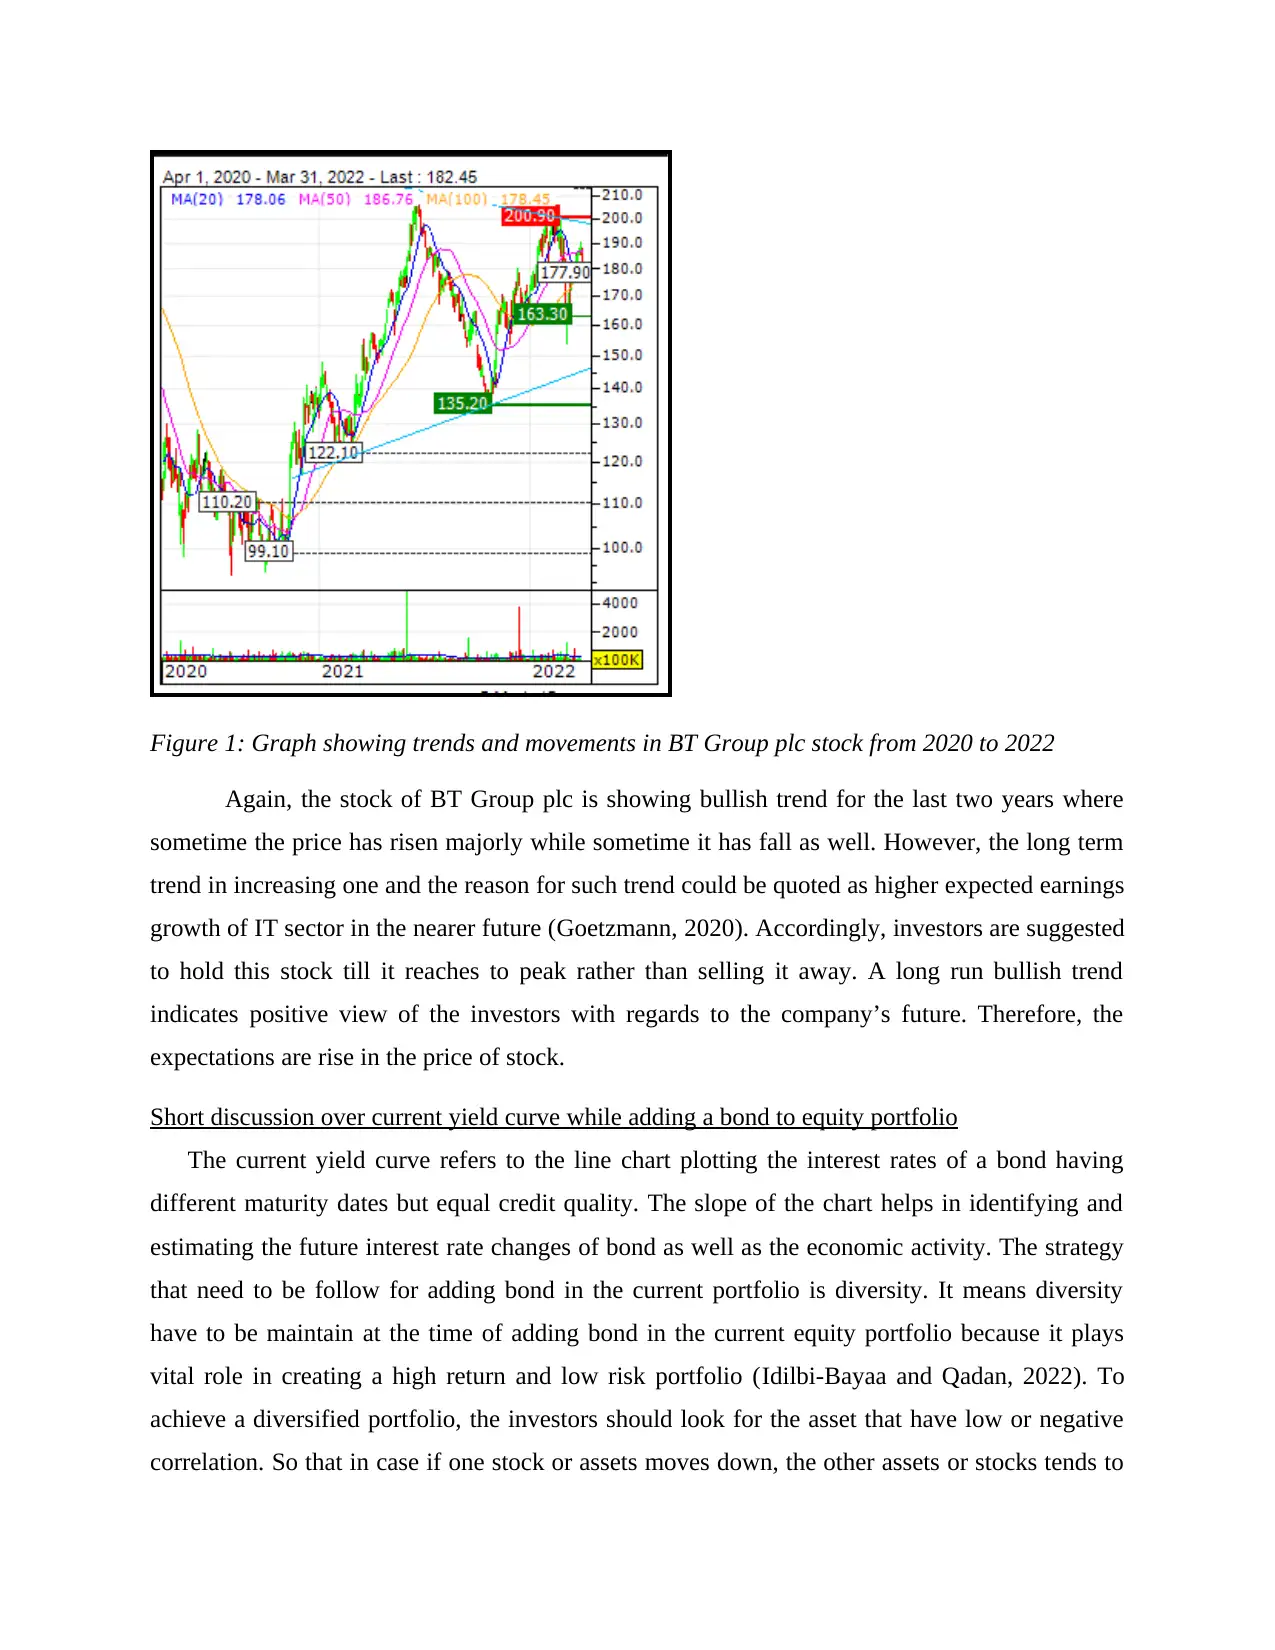
Figure 1: Graph showing trends and movements in BT Group plc stock from 2020 to 2022
Again, the stock of BT Group plc is showing bullish trend for the last two years where
sometime the price has risen majorly while sometime it has fall as well. However, the long term
trend in increasing one and the reason for such trend could be quoted as higher expected earnings
growth of IT sector in the nearer future (Goetzmann, 2020). Accordingly, investors are suggested
to hold this stock till it reaches to peak rather than selling it away. A long run bullish trend
indicates positive view of the investors with regards to the company’s future. Therefore, the
expectations are rise in the price of stock.
Short discussion over current yield curve while adding a bond to equity portfolio
The current yield curve refers to the line chart plotting the interest rates of a bond having
different maturity dates but equal credit quality. The slope of the chart helps in identifying and
estimating the future interest rate changes of bond as well as the economic activity. The strategy
that need to be follow for adding bond in the current portfolio is diversity. It means diversity
have to be maintain at the time of adding bond in the current equity portfolio because it plays
vital role in creating a high return and low risk portfolio (Idilbi-Bayaa and Qadan, 2022). To
achieve a diversified portfolio, the investors should look for the asset that have low or negative
correlation. So that in case if one stock or assets moves down, the other assets or stocks tends to
counteract it. Thus, the diversity decision has to be properly taken by the investors in order to
add bonds in the current equity portfolio.
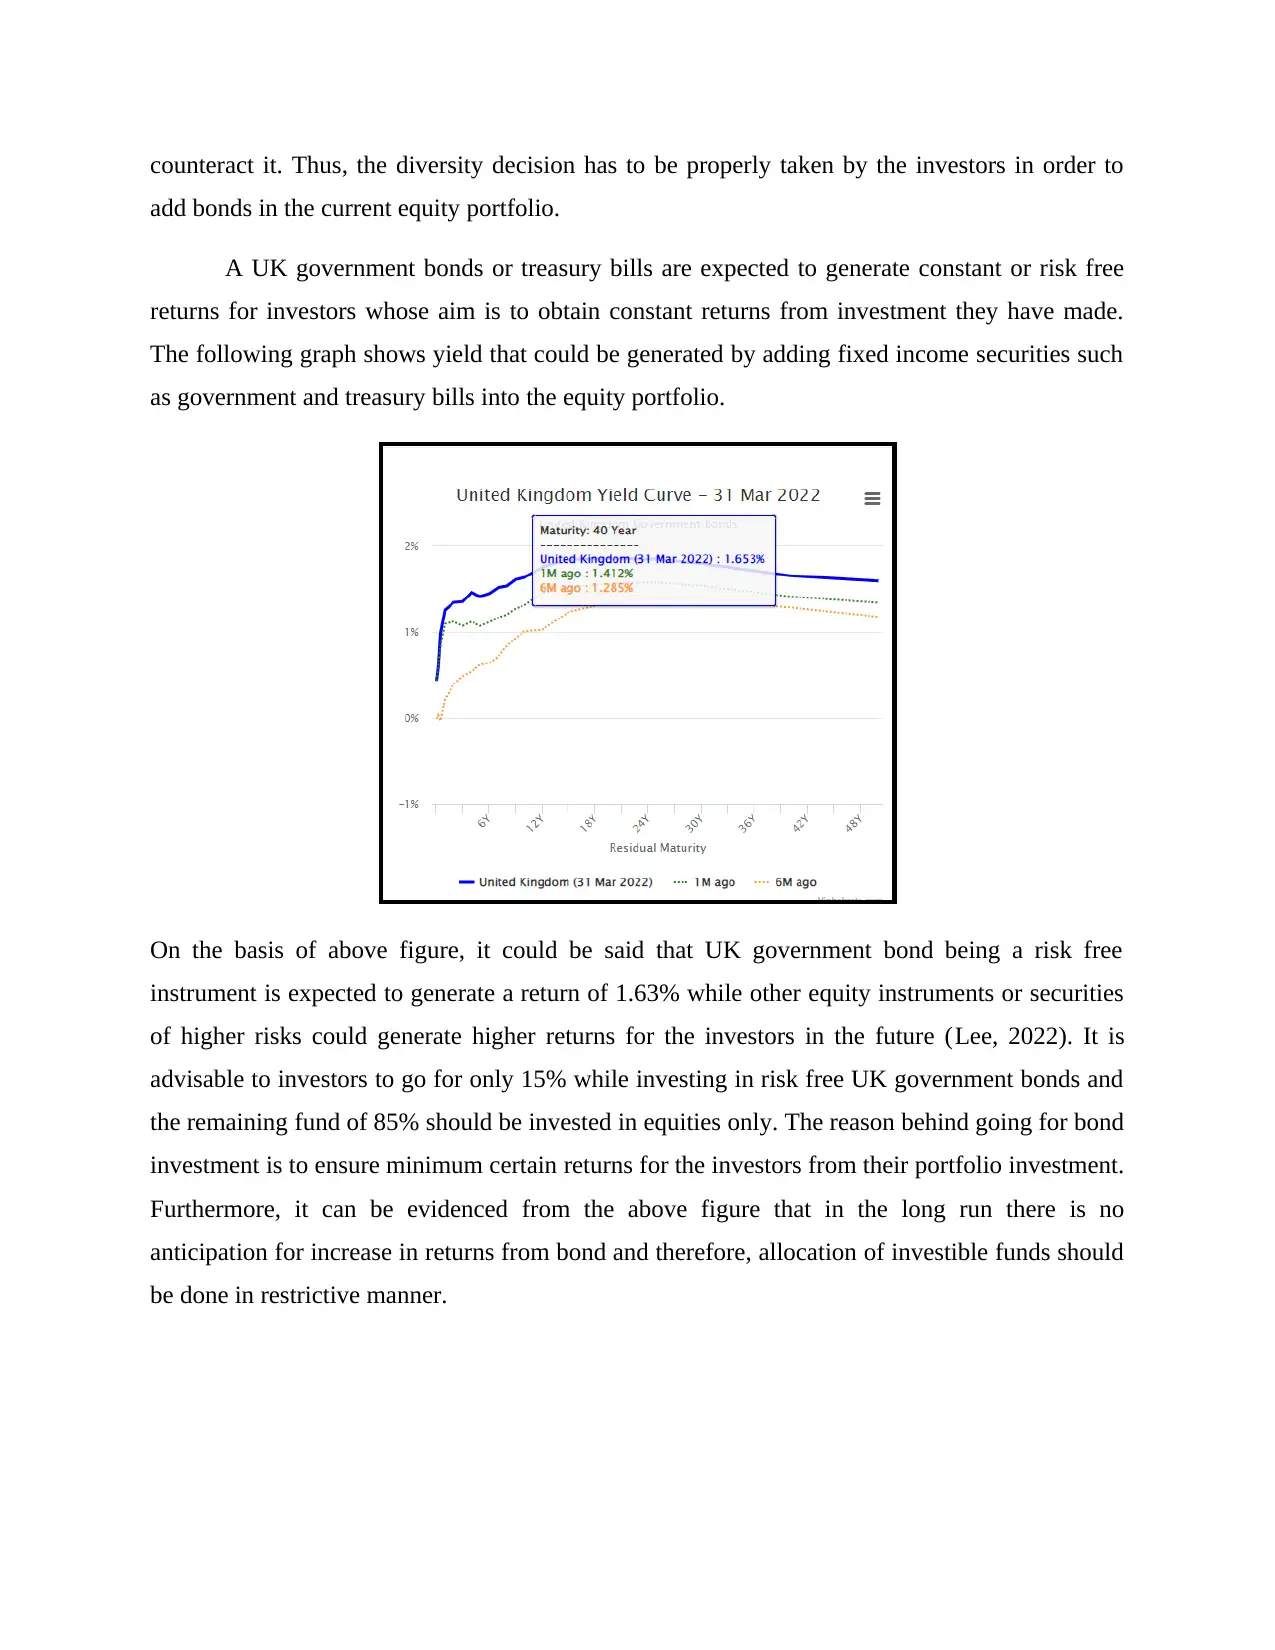
A UK government bonds or treasury bills are expected to generate constant or risk free
returns for investors whose aim is to obtain constant returns from investment they have made.
The following graph shows yield that could be generated by adding fixed income securities such
as government and treasury bills into the equity portfolio.
On the basis of above figure, it could be said that UK government bond being a risk free
instrument is expected to generate a return of 1.63% while other equity instruments or securities
of higher risks could generate higher returns for the investors in the future (Lee, 2022). It is
advisable to investors to go for only 15% while investing in risk free UK government bonds and
the remaining fund of 85% should be invested in equities only. The reason behind going for bond
investment is to ensure minimum certain returns for the investors from their portfolio investment.
Furthermore, it can be evidenced from the above figure that in the long run there is no
anticipation for increase in returns from bond and therefore, allocation of investible funds should
be done in restrictive manner.
add bonds in the current equity portfolio.
A UK government bonds or treasury bills are expected to generate constant or risk free
returns for investors whose aim is to obtain constant returns from investment they have made.
The following graph shows yield that could be generated by adding fixed income securities such
as government and treasury bills into the equity portfolio.
On the basis of above figure, it could be said that UK government bond being a risk free
instrument is expected to generate a return of 1.63% while other equity instruments or securities
of higher risks could generate higher returns for the investors in the future (Lee, 2022). It is
advisable to investors to go for only 15% while investing in risk free UK government bonds and
the remaining fund of 85% should be invested in equities only. The reason behind going for bond
investment is to ensure minimum certain returns for the investors from their portfolio investment.
Furthermore, it can be evidenced from the above figure that in the long run there is no
anticipation for increase in returns from bond and therefore, allocation of investible funds should
be done in restrictive manner.
⊘ This is a preview!⊘
Do you want full access?
Subscribe today to unlock all pages.
Trusted by 1+ million students worldwide
1 out of 29
Related Documents


Your All-in-One AI-Powered Toolkit for Academic Success.
+13062052269
info@desklib.com
Available 24*7 on WhatsApp / Email
![[object Object]](/_next/static/media/star-bottom.7253800d.svg)
Unlock your academic potential
Copyright © 2020–2025 A2Z Services. All Rights Reserved. Developed and managed by ZUCOL.