Financial Investments in Practice - Desklib
VerifiedAdded on 2023/06/12
|27
|3827
|146
AI Summary
This article provides insights on financial investments in practice with a focus on macroeconomic analysis, industry analysis, fundamental analysis, technical analysis, and portfolio formation. It also includes a short discussion on the current yield curve for the UK Government treasury bills. The article covers Unilever Plc, Shell Plc, and Associated British Foods, and is relevant for students studying finance, economics, and related courses.
Contribute Materials
Your contribution can guide someone’s learning journey. Share your
documents today.

FINANCIAL
INVESTMENTS IN
PRACTICE
INVESTMENTS IN
PRACTICE
Secure Best Marks with AI Grader
Need help grading? Try our AI Grader for instant feedback on your assignments.
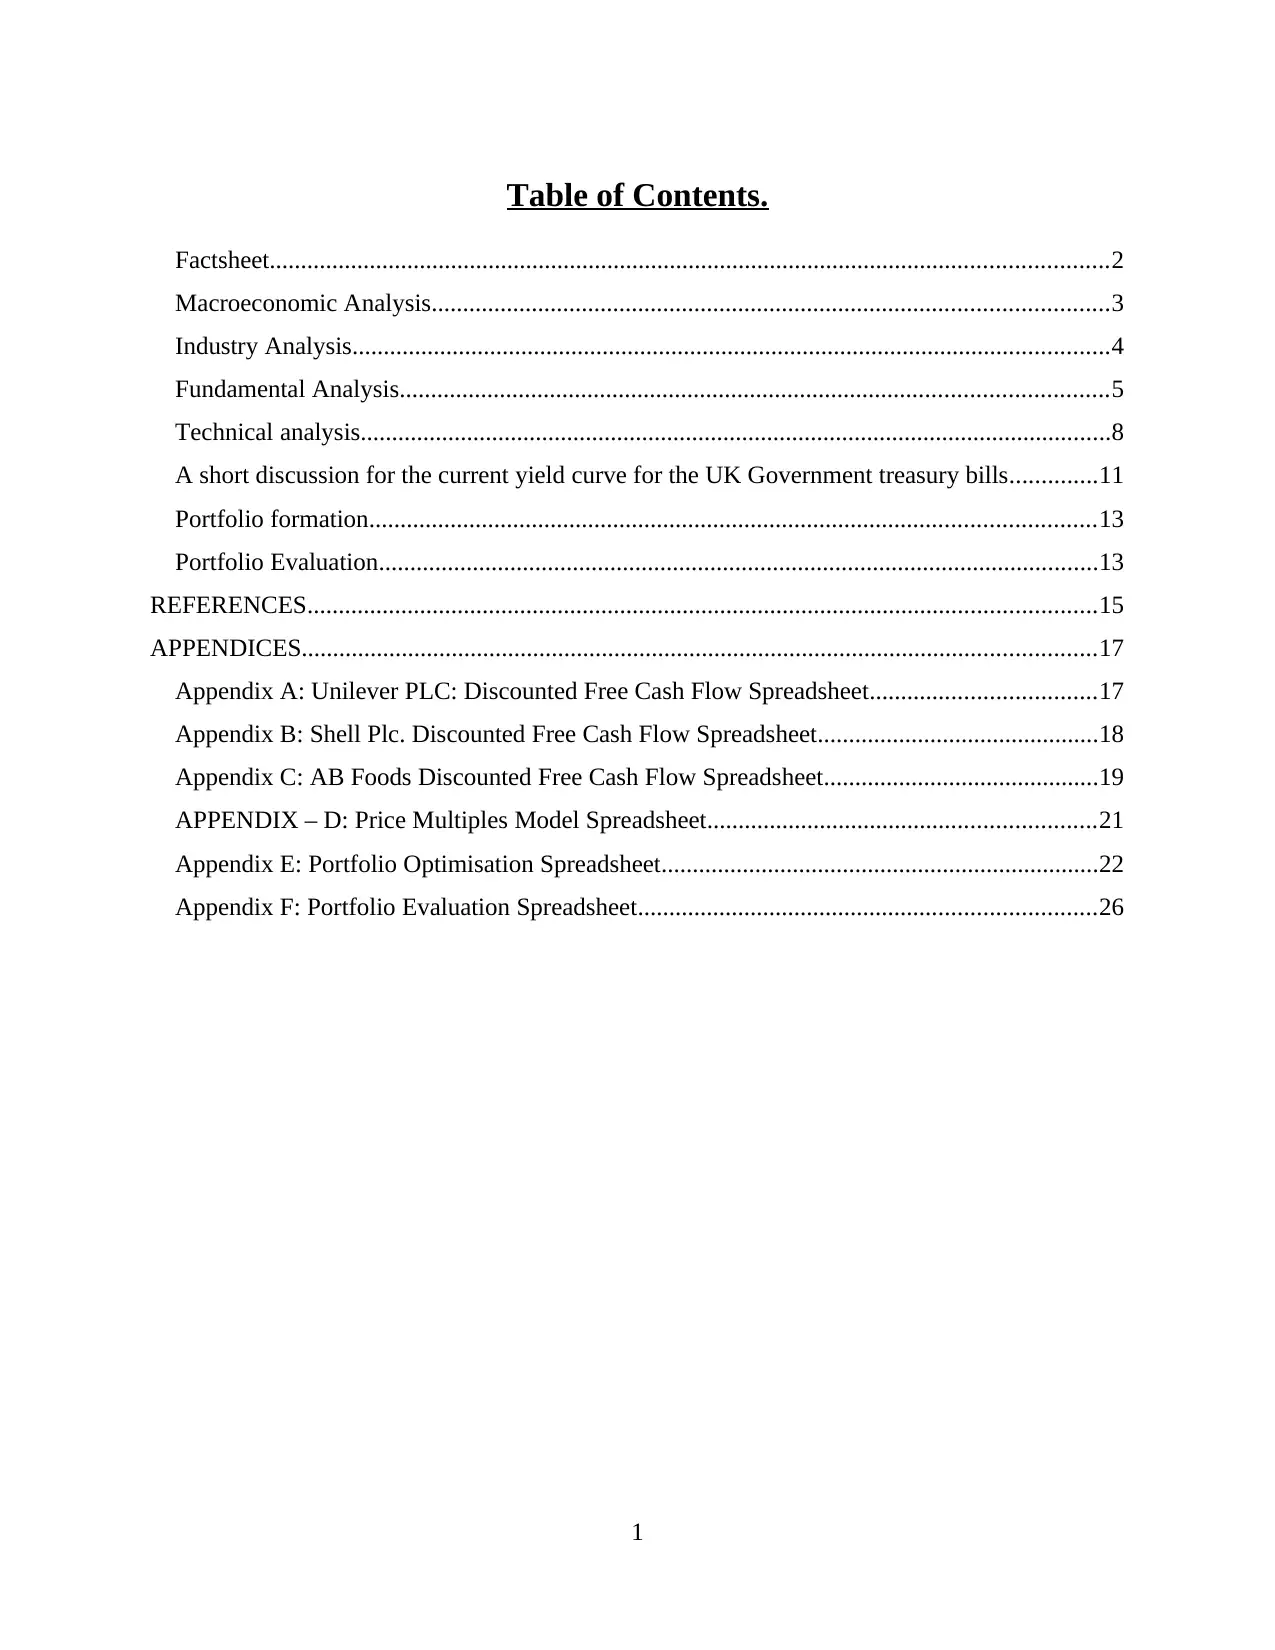
Table of Contents.
Factsheet......................................................................................................................................2
Macroeconomic Analysis............................................................................................................3
Industry Analysis.........................................................................................................................4
Fundamental Analysis.................................................................................................................5
Technical analysis........................................................................................................................8
A short discussion for the current yield curve for the UK Government treasury bills..............11
Portfolio formation....................................................................................................................13
Portfolio Evaluation...................................................................................................................13
REFERENCES..............................................................................................................................15
APPENDICES...............................................................................................................................17
Appendix A: Unilever PLC: Discounted Free Cash Flow Spreadsheet....................................17
Appendix B: Shell Plc. Discounted Free Cash Flow Spreadsheet.............................................18
Appendix C: AB Foods Discounted Free Cash Flow Spreadsheet............................................19
APPENDIX – D: Price Multiples Model Spreadsheet..............................................................21
Appendix E: Portfolio Optimisation Spreadsheet......................................................................22
Appendix F: Portfolio Evaluation Spreadsheet.........................................................................26
1
Factsheet
Macroeconomic Analysis
Macroeconomic is basically a branch of economic with the help of which investors can
study the economy as a whole. Further, an economic indicator is a piece of economic data with
the help of which an investor can analyse or interpret current as well as future investment
2
Macroeconomic Analysis
Macroeconomic is basically a branch of economic with the help of which investors can
study the economy as a whole. Further, an economic indicator is a piece of economic data with
the help of which an investor can analyse or interpret current as well as future investment
2
possibilities. In order to judge the overall health of UK economy, the following economic
indicators need to be analysed:
Consumer Price Index: This is an indicator which is used to measure and analyse the
changes in the level of prices of goods and services over time in reference to population acquires.
The CPI of UK rose by 5.5% in the 12 months to January 2022 which means that prices of the
goods and services consumed by people such as food, transportation, medical, house etc. are
increasing (Kurpayanidi, 2020).
Gross Domestic Product: This is also most significant indicator of economy which help
the investors to analyse health of economy. The GDP of UK economy in the year 2021 is $3.44
trillion with the 5th rank all over world and GDP growth of 7.5%. This indicates that the health of
UK economy is improving as compared to year 2020 where the GDP growth rate of UK is -
9.8%.
Unemployment Figure: The unemployment rate of UK has reached to 4.9% in the year
2021 as compared to 4.6% in the year 2020 (Kurpayanidi, 2020). Such increase in the
unemployment rate may leads to poverty, debt, homelessness and housing stress which
ultimately affect the investors viewpoint to invest in companies. It is because the increase in
unemployment rate will lead to decline in business products and services.
3
Secure Best Marks with AI Grader
Need help grading? Try our AI Grader for instant feedback on your assignments.
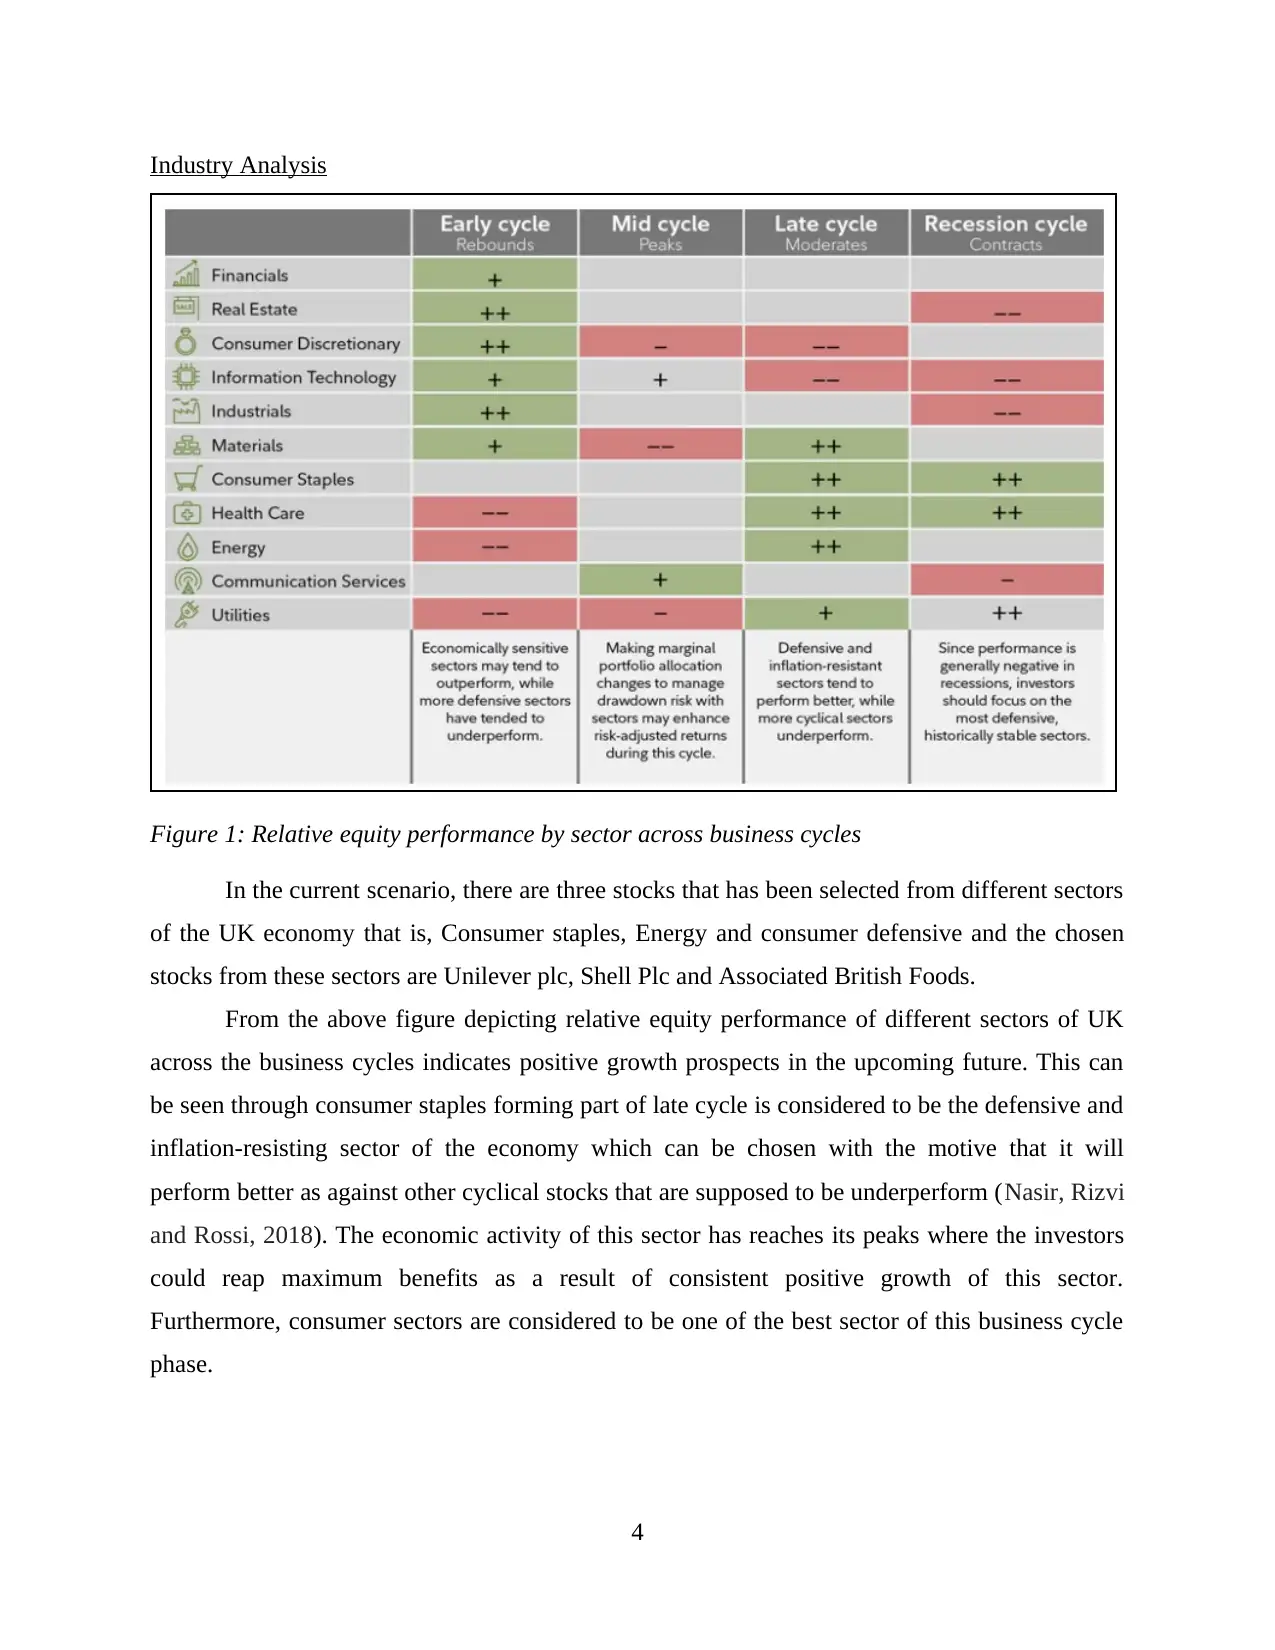
Industry Analysis
Figure 1: Relative equity performance by sector across business cycles
In the current scenario, there are three stocks that has been selected from different sectors
of the UK economy that is, Consumer staples, Energy and consumer defensive and the chosen
stocks from these sectors are Unilever plc, Shell Plc and Associated British Foods.
From the above figure depicting relative equity performance of different sectors of UK
across the business cycles indicates positive growth prospects in the upcoming future. This can
be seen through consumer staples forming part of late cycle is considered to be the defensive and
inflation-resisting sector of the economy which can be chosen with the motive that it will
perform better as against other cyclical stocks that are supposed to be underperform (Nasir, Rizvi
and Rossi, 2018). The economic activity of this sector has reaches its peaks where the investors
could reap maximum benefits as a result of consistent positive growth of this sector.
Furthermore, consumer sectors are considered to be one of the best sector of this business cycle
phase.
4
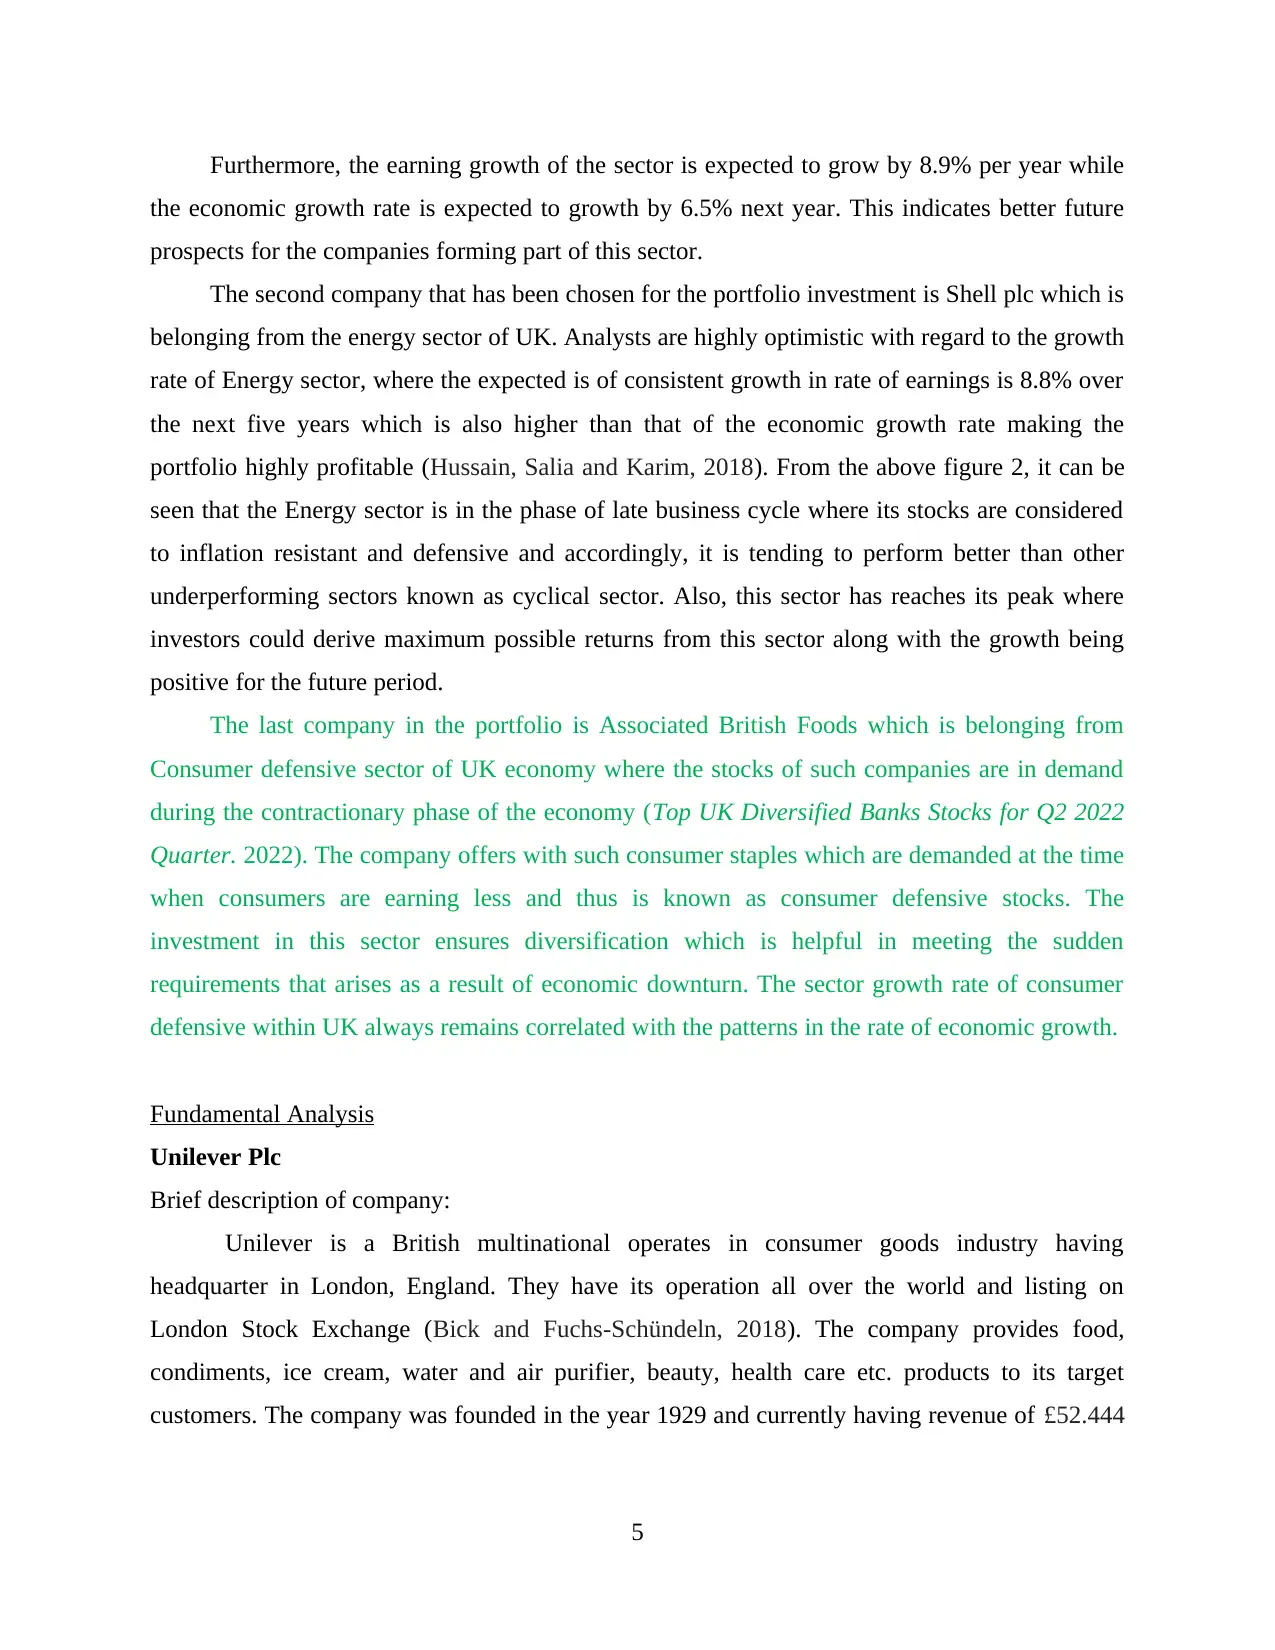
Furthermore, the earning growth of the sector is expected to grow by 8.9% per year while
the economic growth rate is expected to growth by 6.5% next year. This indicates better future
prospects for the companies forming part of this sector.
The second company that has been chosen for the portfolio investment is Shell plc which is
belonging from the energy sector of UK. Analysts are highly optimistic with regard to the growth
rate of Energy sector, where the expected is of consistent growth in rate of earnings is 8.8% over
the next five years which is also higher than that of the economic growth rate making the
portfolio highly profitable (Hussain, Salia and Karim, 2018). From the above figure 2, it can be
seen that the Energy sector is in the phase of late business cycle where its stocks are considered
to inflation resistant and defensive and accordingly, it is tending to perform better than other
underperforming sectors known as cyclical sector. Also, this sector has reaches its peak where
investors could derive maximum possible returns from this sector along with the growth being
positive for the future period.
The last company in the portfolio is Associated British Foods which is belonging from
Consumer defensive sector of UK economy where the stocks of such companies are in demand
during the contractionary phase of the economy (Top UK Diversified Banks Stocks for Q2 2022
Quarter. 2022). The company offers with such consumer staples which are demanded at the time
when consumers are earning less and thus is known as consumer defensive stocks. The
investment in this sector ensures diversification which is helpful in meeting the sudden
requirements that arises as a result of economic downturn. The sector growth rate of consumer
defensive within UK always remains correlated with the patterns in the rate of economic growth.
Fundamental Analysis
Unilever Plc
Brief description of company:
Unilever is a British multinational operates in consumer goods industry having
headquarter in London, England. They have its operation all over the world and listing on
London Stock Exchange (Bick and Fuchs-Schündeln, 2018). The company provides food,
condiments, ice cream, water and air purifier, beauty, health care etc. products to its target
customers. The company was founded in the year 1929 and currently having revenue of £52.444
5
billion and net income of £6.621 billion as per 2021 report. Total number of employee work with
Unilever is 149000 in year 2021.
Strength:
Unilever operates in nearly 190 countries all over the world and has top and large
customer base.
Its research and development are heavily funded and managed.
It has distinct competitive advantage because of its flexible pricing strategies and best
distribution channel.
The company has a value score of B which indicates a good pick for those investors who
are dedicated towards recognising higher value from their investment, that is, value
investors. Further, prospects of the company in terms of growth and health indicates it
ability to outperform the market and accordingly, have a growth score A.
Shell Plc
Brief description of company:
Shell Plc is a British multinational organization having operation in oil and gas industry
with headquarter in London, UK. By revenue and profits it is one of the largest companies all
over the world. It provides oil and gas to the consumers and having market capitalization of £156
billion. The company was founded in the year 1907 and now have around 44000 service station
all around the world. The net income and sales revenue of Shell plc in the year 2021 is US$ 20.6
billion and US$ 261.5 billion respectively. Total number of employee work with Shell plc in the
year 2021 is 86000 (Ashimov and et.al., 2020).
Strength:
They are continuously trying to reduce the carbon footprint and greenhouse emission via
improving its technology.
The company have its service station in more than 70 countries all around the world and
is one of the biggest oil company in the world.
Shell plc is having a tag of oil and gas company which is seen as a good investment
opportunity for many as the sector is showing positive growth prospects in the upcoming
6
Paraphrase This Document
Need a fresh take? Get an instant paraphrase of this document with our AI Paraphraser
future which is higher than that of the whole UK economic growth (Consumer Staples
Stocks List UK 2022 (LSE). 2022).
AB foods
Brief description of company:
Associated British foods is a UK based multinational retail and food processing company
which is headquartered in London, England. The market capitalization of the company is US $
17.08 billion as per the current market condition of the company and the value of assets held by
the company as of September 2021 was US $ 22.03 trillion. The company was founded 87 years
ago in 1935 and its shares are currently traded on London Stock exchange along with being one
of the constituents of FTSE 100 index. The revenue generated by the company in the year 2021
was US $ 18.11 billion while the net income in the same year was US $649.65 million.
Strength:
As per the ratings of stock analysts, the stock of AB foods has received consensus rating
of buy which indicates strong buy due analysts’ expectation and consensus for this stock.
The expectation of analysts here means the return derived from the stock will far exceed
the return provided by the whole stock market.
As per the stock market research analysts, the stock has secured great hold and buy
ratings even knowing the fact that the shares of AB foods have lost up to 20% of its
value. This shows that the stock still has sufficient worth for buy recommendation.
7
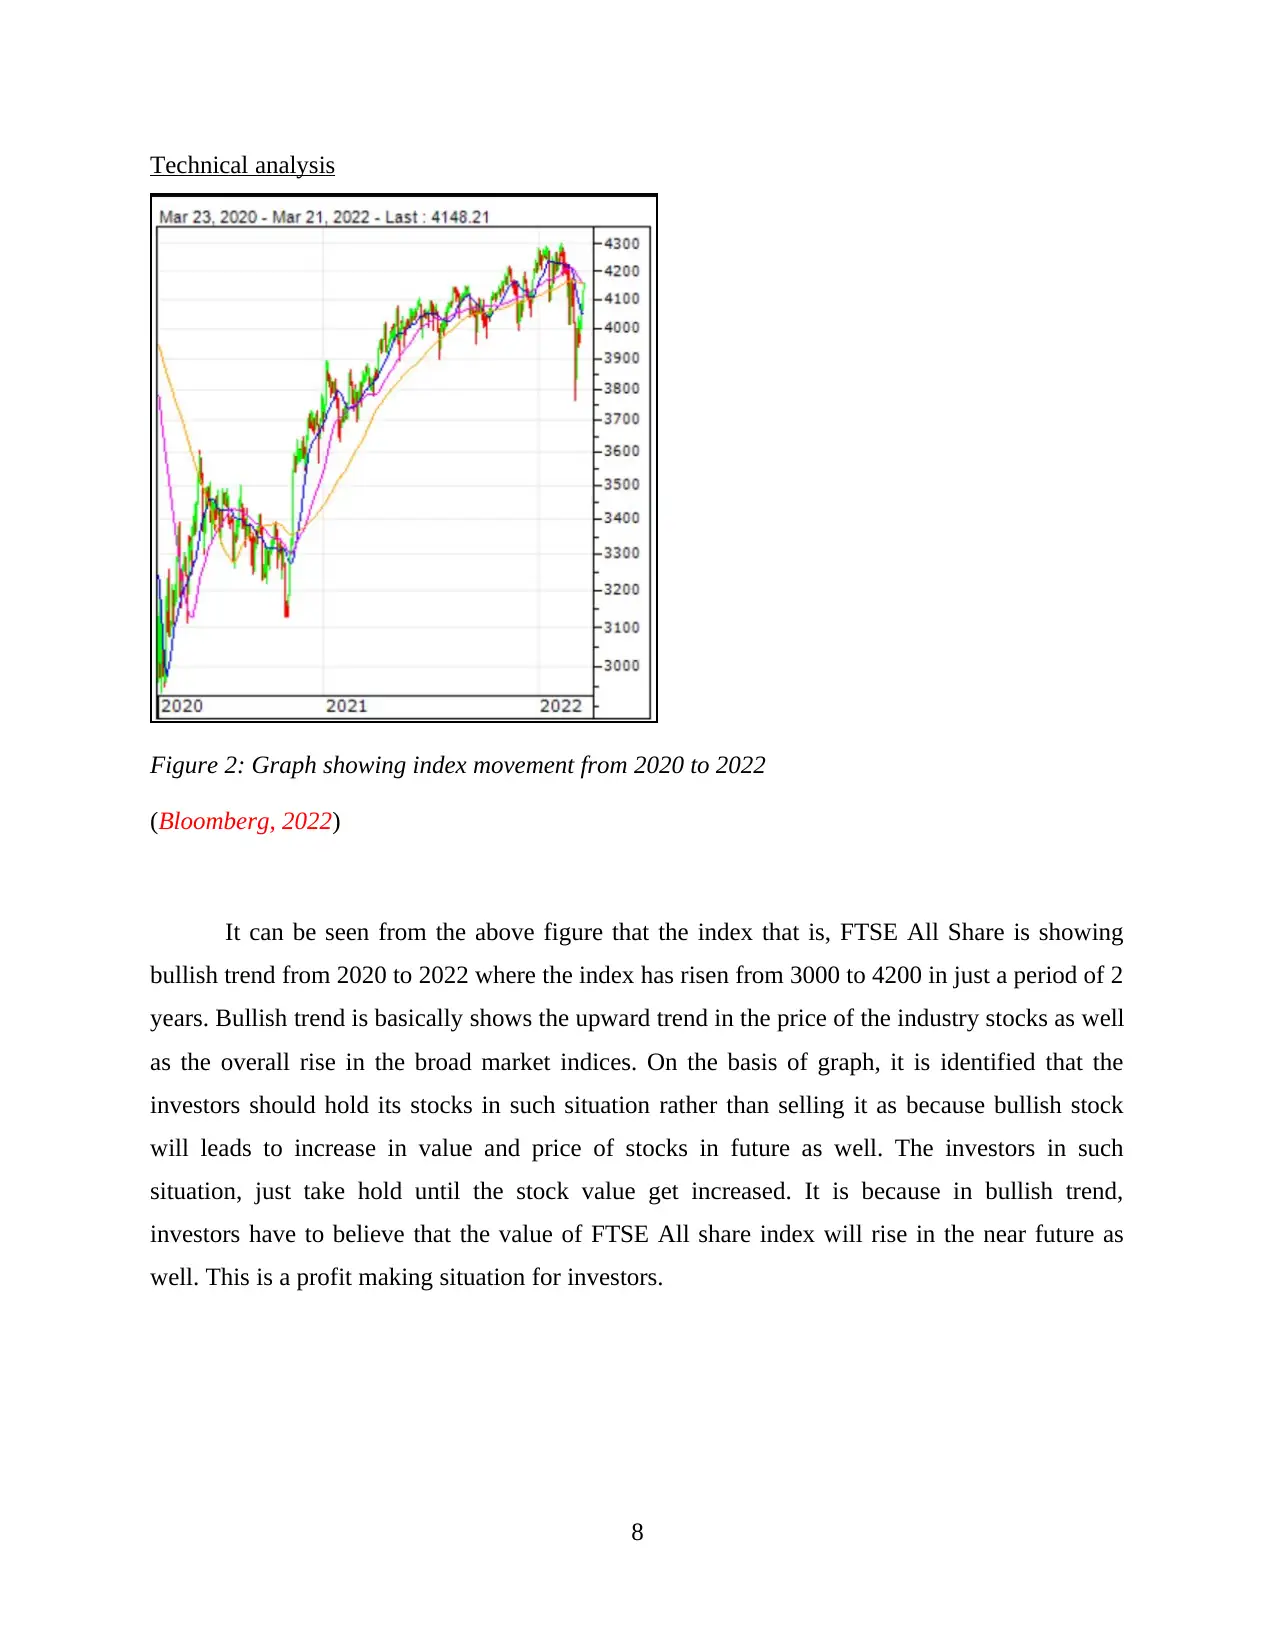
Technical analysis
Figure 2: Graph showing index movement from 2020 to 2022
(Bloomberg, 2022)
It can be seen from the above figure that the index that is, FTSE All Share is showing
bullish trend from 2020 to 2022 where the index has risen from 3000 to 4200 in just a period of 2
years. Bullish trend is basically shows the upward trend in the price of the industry stocks as well
as the overall rise in the broad market indices. On the basis of graph, it is identified that the
investors should hold its stocks in such situation rather than selling it as because bullish stock
will leads to increase in value and price of stocks in future as well. The investors in such
situation, just take hold until the stock value get increased. It is because in bullish trend,
investors have to believe that the value of FTSE All share index will rise in the near future as
well. This is a profit making situation for investors.
8
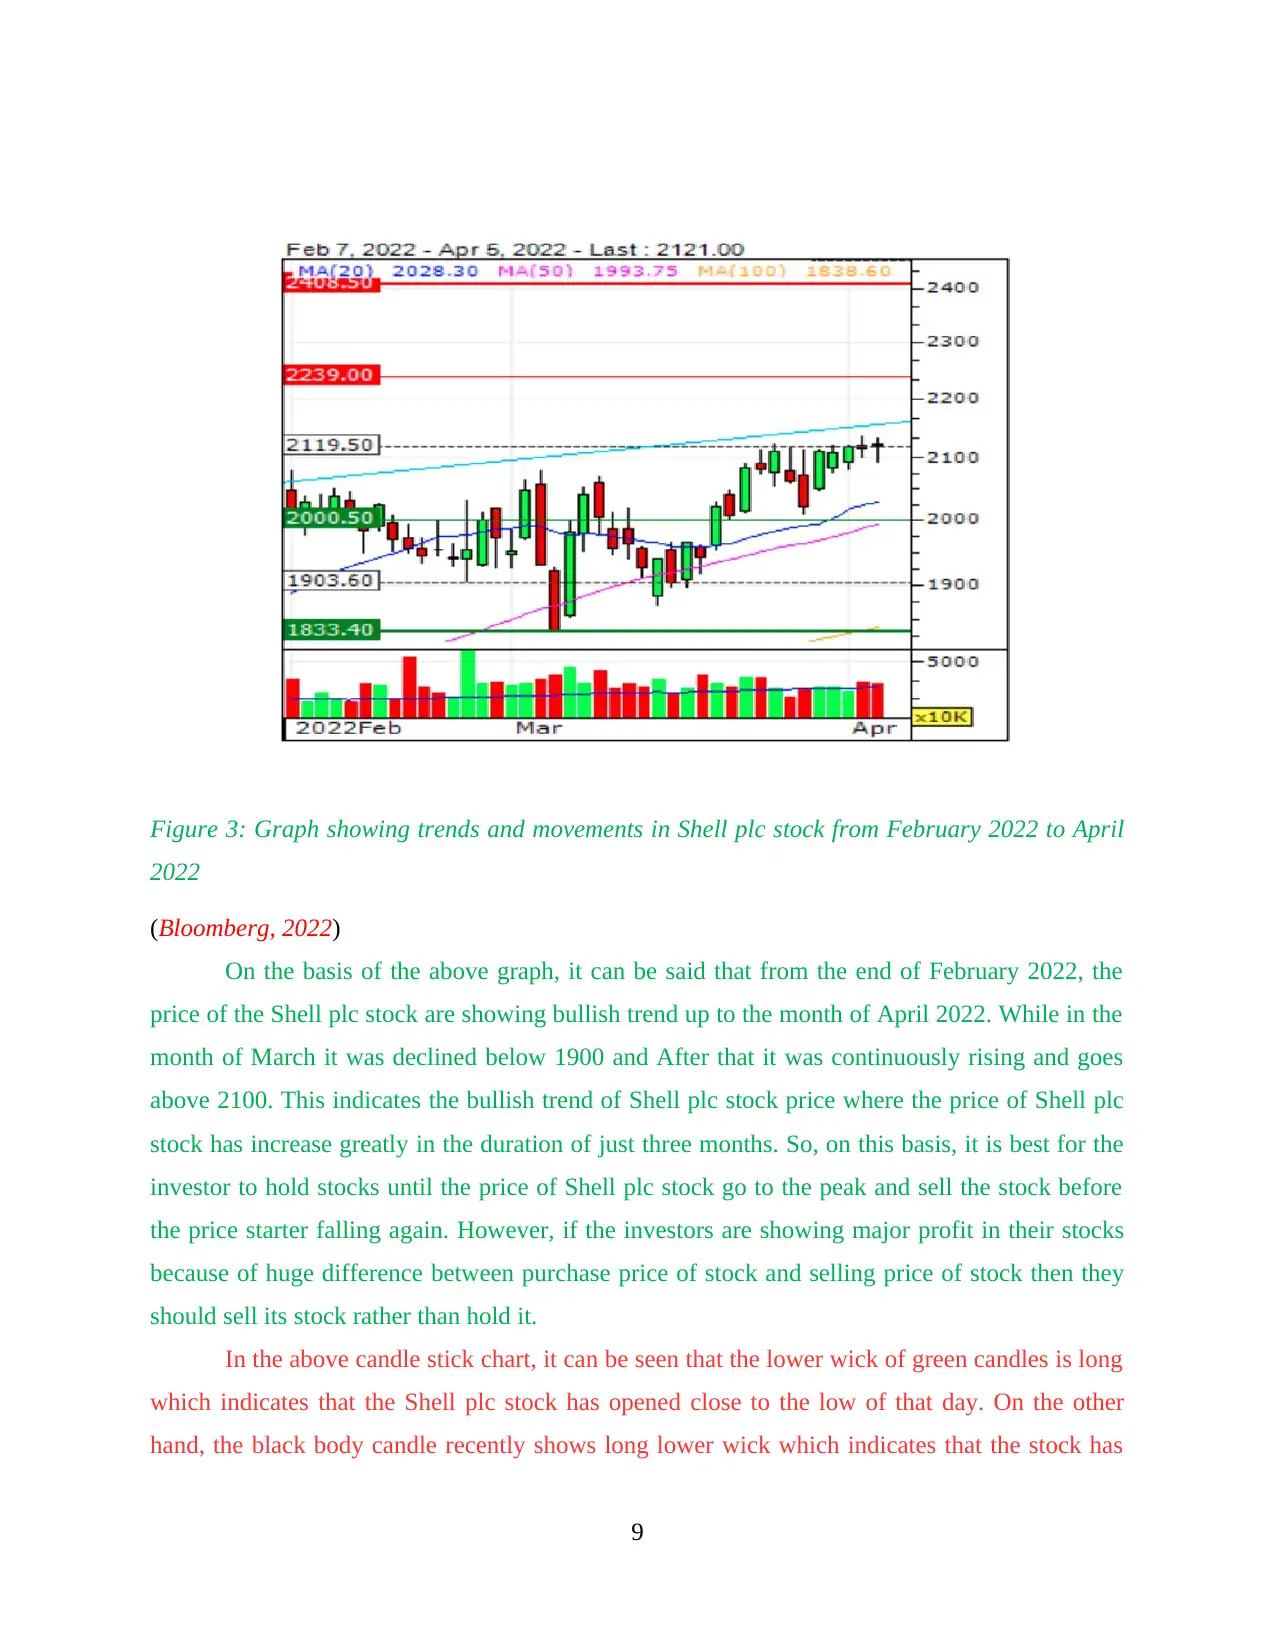
Figure 3: Graph showing trends and movements in Shell plc stock from February 2022 to April
2022
(Bloomberg, 2022)
On the basis of the above graph, it can be said that from the end of February 2022, the
price of the Shell plc stock are showing bullish trend up to the month of April 2022. While in the
month of March it was declined below 1900 and After that it was continuously rising and goes
above 2100. This indicates the bullish trend of Shell plc stock price where the price of Shell plc
stock has increase greatly in the duration of just three months. So, on this basis, it is best for the
investor to hold stocks until the price of Shell plc stock go to the peak and sell the stock before
the price starter falling again. However, if the investors are showing major profit in their stocks
because of huge difference between purchase price of stock and selling price of stock then they
should sell its stock rather than hold it.
In the above candle stick chart, it can be seen that the lower wick of green candles is long
which indicates that the Shell plc stock has opened close to the low of that day. On the other
hand, the black body candle recently shows long lower wick which indicates that the stock has
9
Secure Best Marks with AI Grader
Need help grading? Try our AI Grader for instant feedback on your assignments.
closed near to the low of that day. Also, the support price triggering for buy is found out to be
1903.6 while the resistance price triggering for sell is found out to be 2119.50 for the stock of
Shell plc. This has been determined through the dotted line indicating support ans resistance in
the above candle stick chart of the Shell plc.
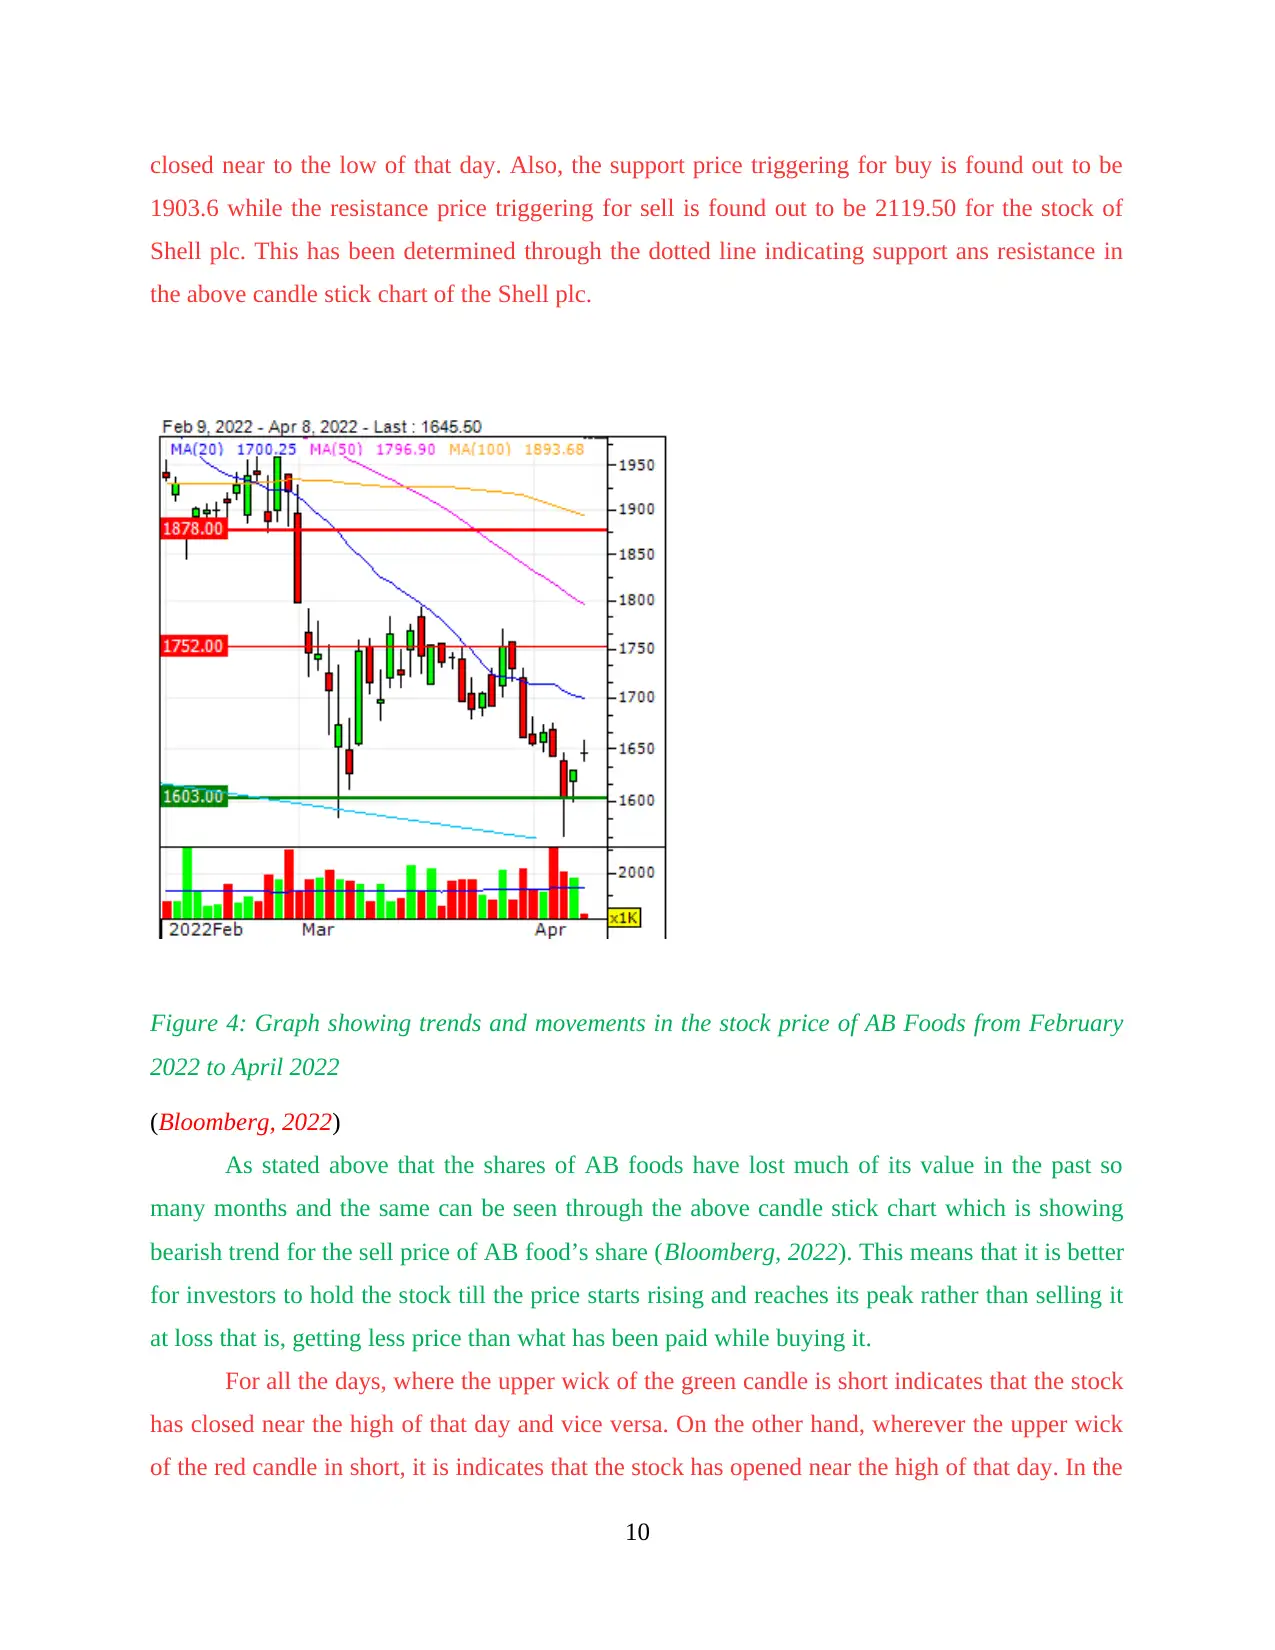
Figure 4: Graph showing trends and movements in the stock price of AB Foods from February
2022 to April 2022
(Bloomberg, 2022)
As stated above that the shares of AB foods have lost much of its value in the past so
many months and the same can be seen through the above candle stick chart which is showing
bearish trend for the sell price of AB food’s share (Bloomberg, 2022). This means that it is better
for investors to hold the stock till the price starts rising and reaches its peak rather than selling it
at loss that is, getting less price than what has been paid while buying it.
For all the days, where the upper wick of the green candle is short indicates that the stock
has closed near the high of that day and vice versa. On the other hand, wherever the upper wick
of the red candle in short, it is indicates that the stock has opened near the high of that day. In the
10
1903.6 while the resistance price triggering for sell is found out to be 2119.50 for the stock of
Shell plc. This has been determined through the dotted line indicating support ans resistance in
the above candle stick chart of the Shell plc.
Figure 4: Graph showing trends and movements in the stock price of AB Foods from February
2022 to April 2022
(Bloomberg, 2022)
As stated above that the shares of AB foods have lost much of its value in the past so
many months and the same can be seen through the above candle stick chart which is showing
bearish trend for the sell price of AB food’s share (Bloomberg, 2022). This means that it is better
for investors to hold the stock till the price starts rising and reaches its peak rather than selling it
at loss that is, getting less price than what has been paid while buying it.
For all the days, where the upper wick of the green candle is short indicates that the stock
has closed near the high of that day and vice versa. On the other hand, wherever the upper wick
of the red candle in short, it is indicates that the stock has opened near the high of that day. In the
10
above figure, it can be seen that currently, the lower wick of red candle is long which indicates
that the stock of AB foods has closed near to the low of that day. Also, for the most recent day,
the lower wick of green wick is long which indicates the stock has opened near to the low of that
day.
Support act as floor price while resistance act as a ceiling price of a stock. The support is
always below the current market price and thus trigger to buy while resistance is always above
the current market price of a stock and accordingly trigger to sell. The support price in the above
figure was identified as 1603 while resistance price was found out as 1752 for the shares of AB
foods.
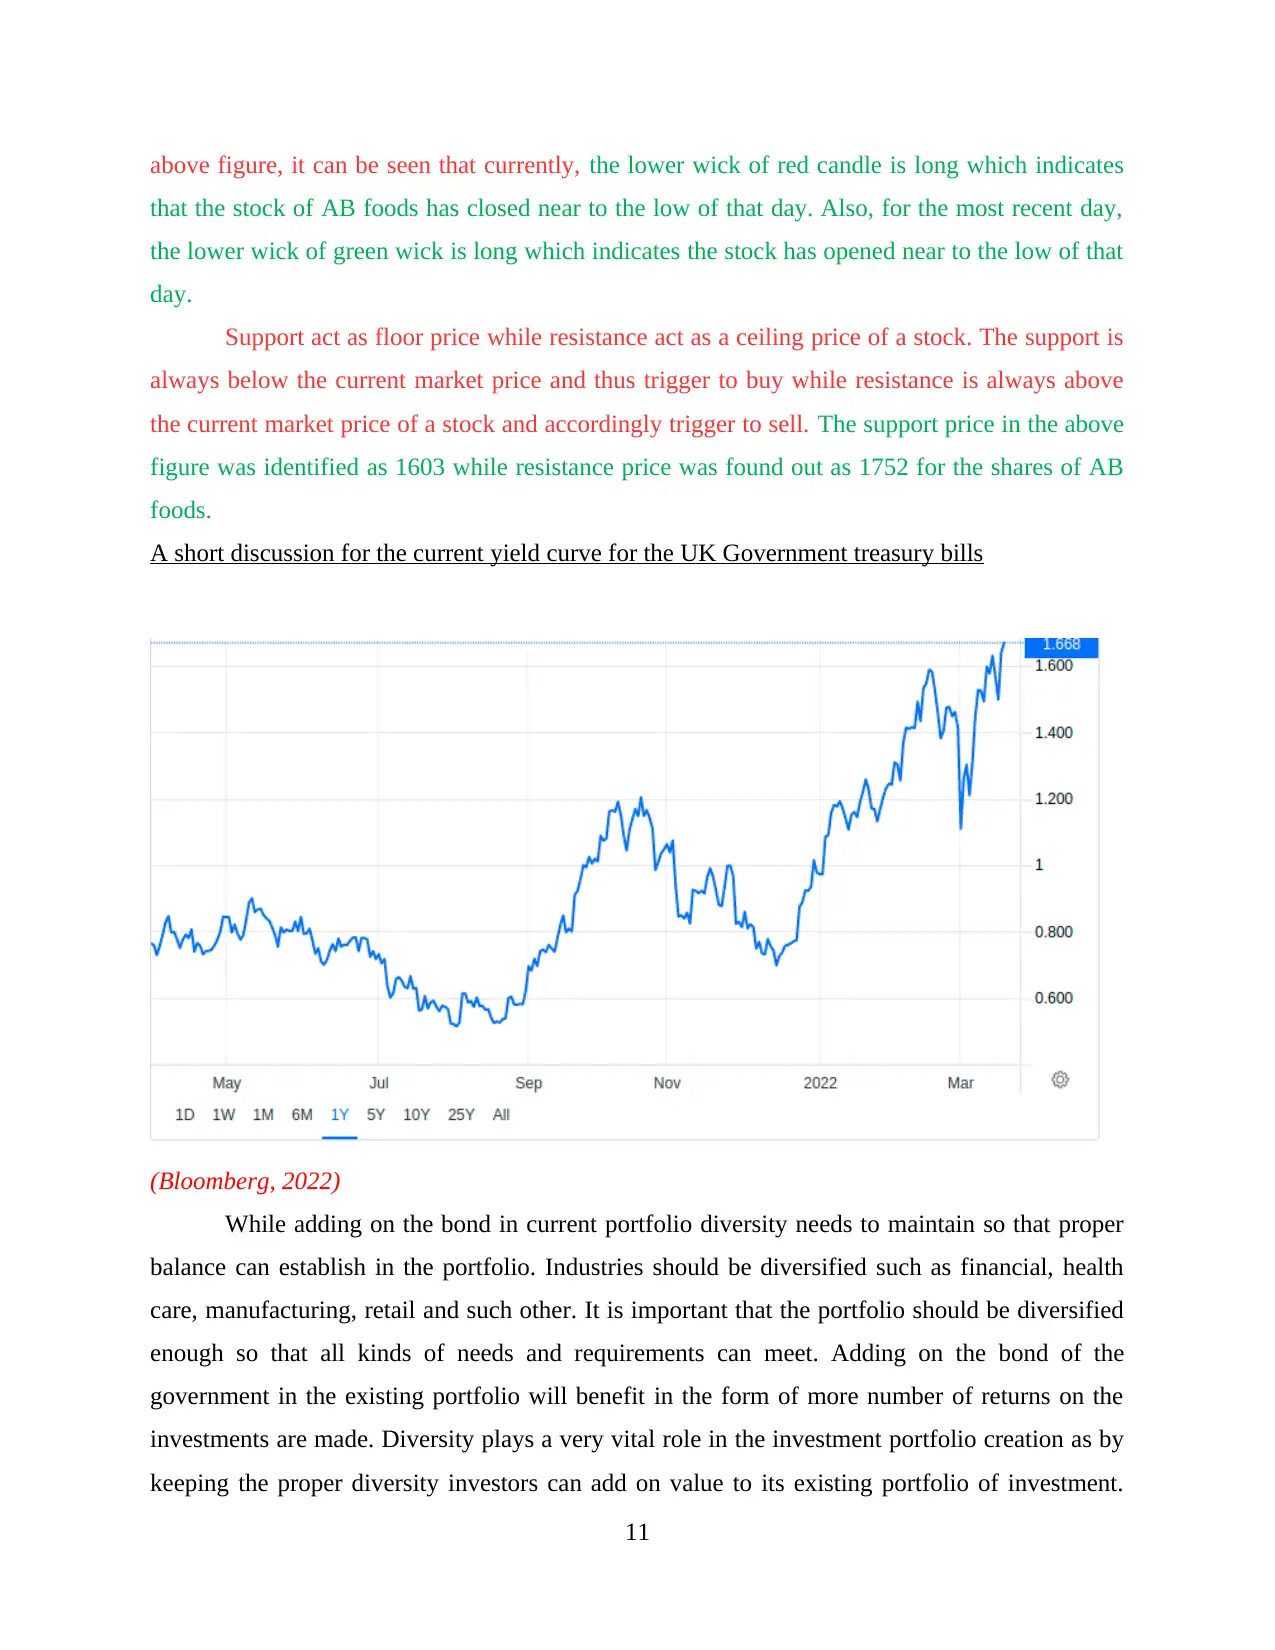
A short discussion for the current yield curve for the UK Government treasury bills
(Bloomberg, 2022)
While adding on the bond in current portfolio diversity needs to maintain so that proper
balance can establish in the portfolio. Industries should be diversified such as financial, health
care, manufacturing, retail and such other. It is important that the portfolio should be diversified
enough so that all kinds of needs and requirements can meet. Adding on the bond of the
government in the existing portfolio will benefit in the form of more number of returns on the
investments are made. Diversity plays a very vital role in the investment portfolio creation as by
keeping the proper diversity investors can add on value to its existing portfolio of investment.
11
that the stock of AB foods has closed near to the low of that day. Also, for the most recent day,
the lower wick of green wick is long which indicates the stock has opened near to the low of that
day.
Support act as floor price while resistance act as a ceiling price of a stock. The support is
always below the current market price and thus trigger to buy while resistance is always above
the current market price of a stock and accordingly trigger to sell. The support price in the above
figure was identified as 1603 while resistance price was found out as 1752 for the shares of AB
foods.
A short discussion for the current yield curve for the UK Government treasury bills
(Bloomberg, 2022)
While adding on the bond in current portfolio diversity needs to maintain so that proper
balance can establish in the portfolio. Industries should be diversified such as financial, health
care, manufacturing, retail and such other. It is important that the portfolio should be diversified
enough so that all kinds of needs and requirements can meet. Adding on the bond of the
government in the existing portfolio will benefit in the form of more number of returns on the
investments are made. Diversity plays a very vital role in the investment portfolio creation as by
keeping the proper diversity investors can add on value to its existing portfolio of investment.
11
Government issue bonds in different sectors (Konstantinov and Rusev, 2020). The investor can
take a process for analysing the and every government bond or security available in the United
Kingdom. Keeping one or two bonds issued by the government will add on the value to the
existing portfolio available of the investors. Bonds are considered as a diversified asset class as
they are typically lesser volatile in comparison to other assets such as stock. The ultimate aim of
including the bond is to set the source of diversification in the existing portfolio maintain by the
investor. Adding the government bond will certainly create a value to the existing portfolio of the
investor. Keeping diversity by selecting one or two government own bonds will certainly create a
diversification in the equity portfolio own by the investor.
Risk management play an important and vital role every time portfolio is created by the
investor. Government bonds are certainly less risky in comparison to other respective stocks
available in the security exchange. When it comes to adding the bond in the equity portfolio the
investor must make sure that proper diversity is sustained or maintained that can provide
complete freedom to the investor take on the future risk as well along with satisfying the existing
needs and requirements of the investor. Investor must make sure that the proportion of
government bond in the equity portfolio must not be more than 10% (Bloomberg, 2022). This is
a criterion that need to follow by the investor that the overall bond value in the equity portfolio
must not be excess to the 10% of the total value of the investment portfolio. This will certainly
create a balance in the investment portfolio maintain by the investor. Keeping 10% value will
provide a suitable space to the investor to sustain the effective balance in the overall investment
portfolio in the form of equity maintained by the investor (Marozva and Makoni, 2021).
Ensuring the 10% involvement of government bond is necessary and required to maintain the
whole investment portfolio by the investor. This will certainly create a difference in the
investment portfolio and its possible return generated by the investor. Usually the good portfolio
mix is expected to be 75% stocks and 25% bonds. Investor should look forward to containing a
good balance in the overall investment portfolio maintained which would empower to support
the total investment requiems and also will favour in keeping the balance between risk and
return.
12
Paraphrase This Document
Need a fresh take? Get an instant paraphrase of this document with our AI Paraphraser
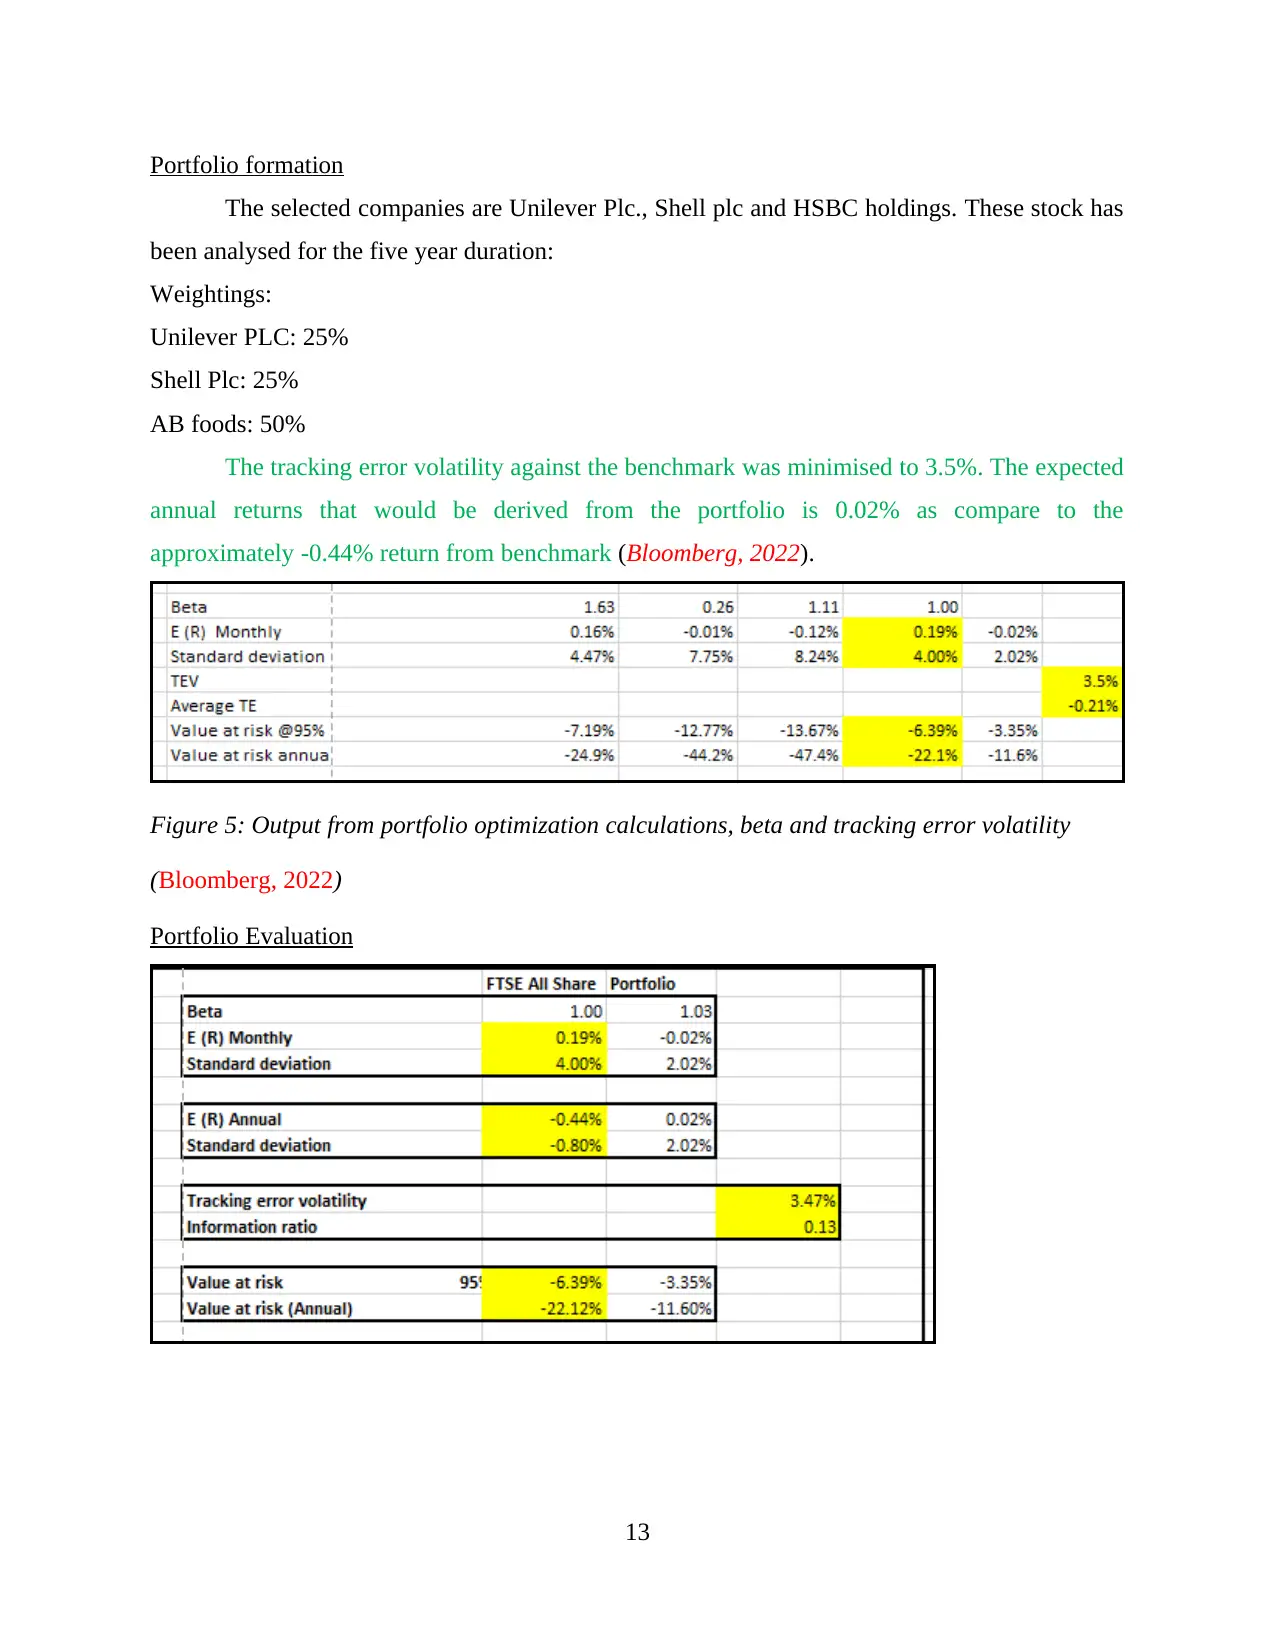
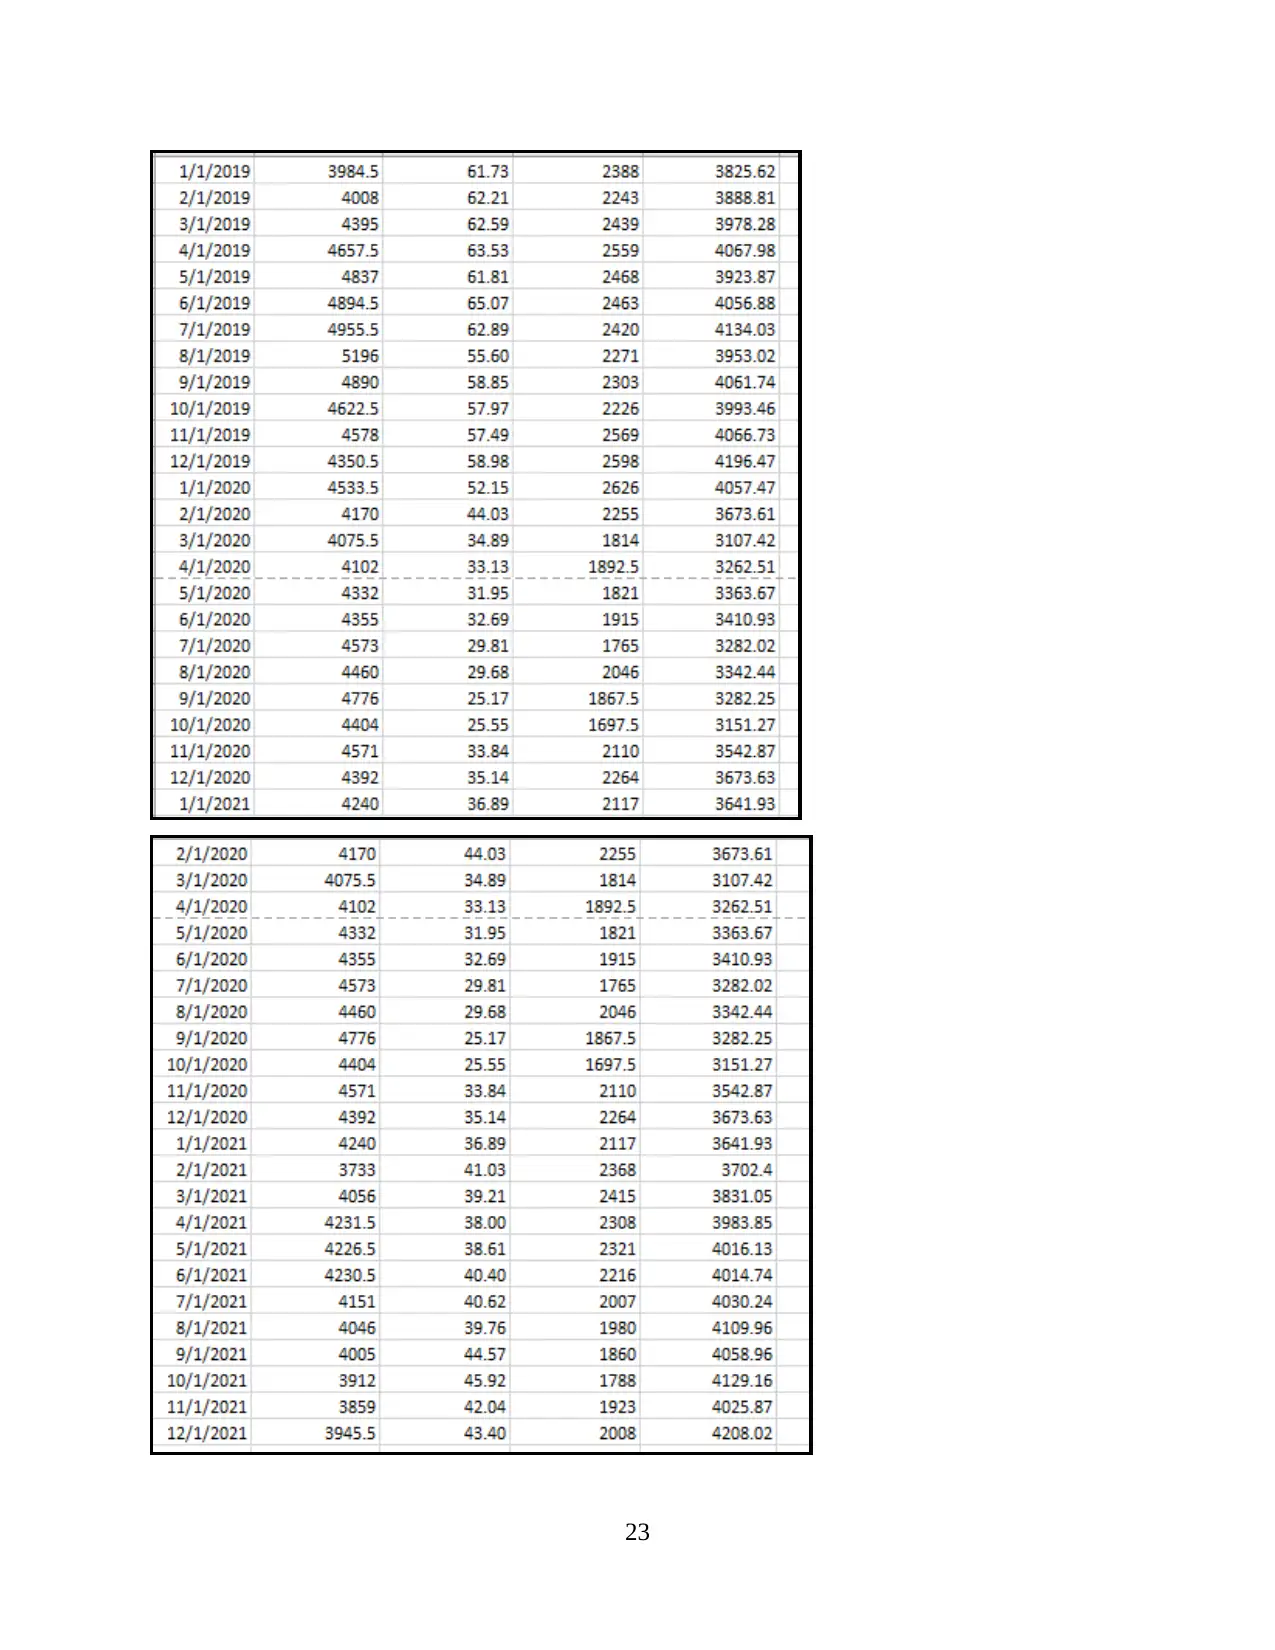
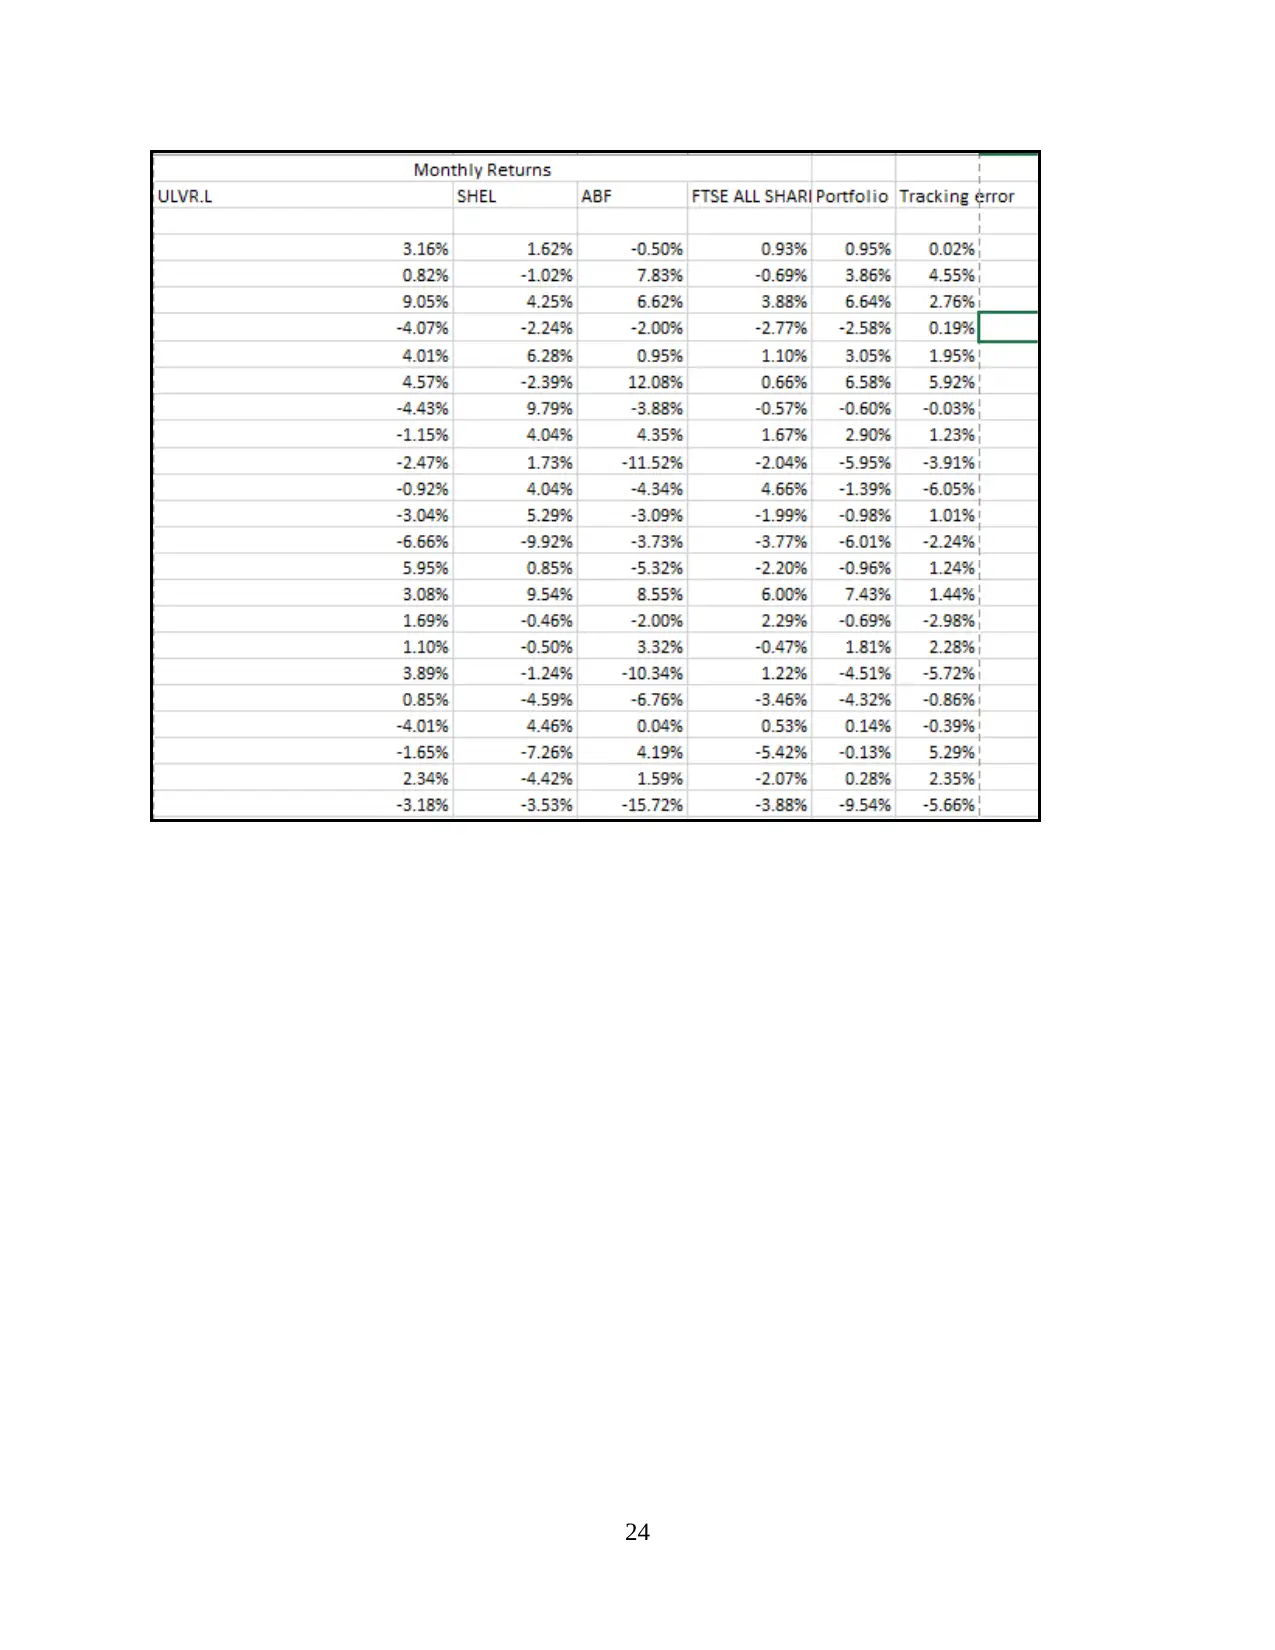
Portfolio formation
The selected companies are Unilever Plc., Shell plc and HSBC holdings. These stock has
been analysed for the five year duration:
Weightings:
Unilever PLC: 25%
Shell Plc: 25%
AB foods: 50%
The tracking error volatility against the benchmark was minimised to 3.5%. The expected
annual returns that would be derived from the portfolio is 0.02% as compare to the
approximately -0.44% return from benchmark (Bloomberg, 2022).
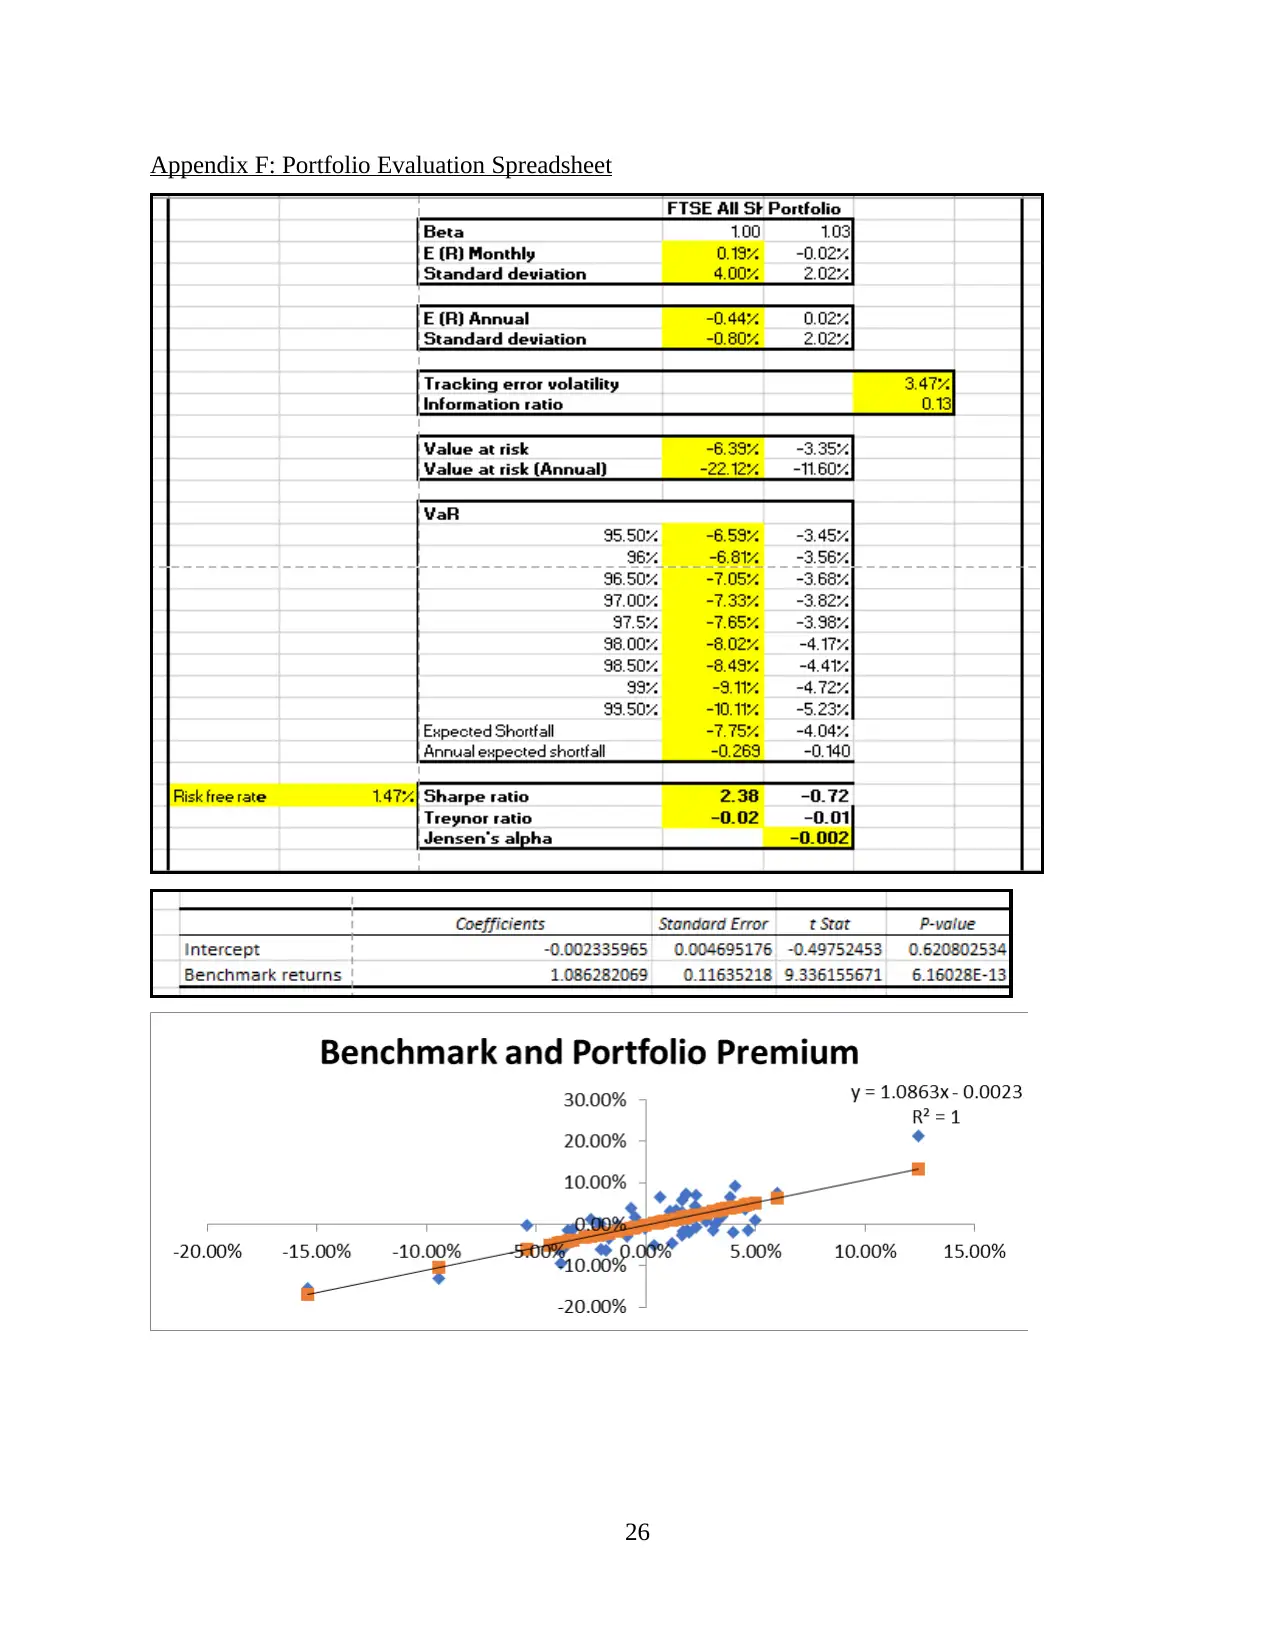
Figure 5: Output from portfolio optimization calculations, beta and tracking error volatility
(Bloomberg, 2022)
Portfolio Evaluation
13
The selected companies are Unilever Plc., Shell plc and HSBC holdings. These stock has
been analysed for the five year duration:
Weightings:
Unilever PLC: 25%
Shell Plc: 25%
AB foods: 50%
The tracking error volatility against the benchmark was minimised to 3.5%. The expected
annual returns that would be derived from the portfolio is 0.02% as compare to the
approximately -0.44% return from benchmark (Bloomberg, 2022).
Figure 5: Output from portfolio optimization calculations, beta and tracking error volatility
(Bloomberg, 2022)
Portfolio Evaluation
13
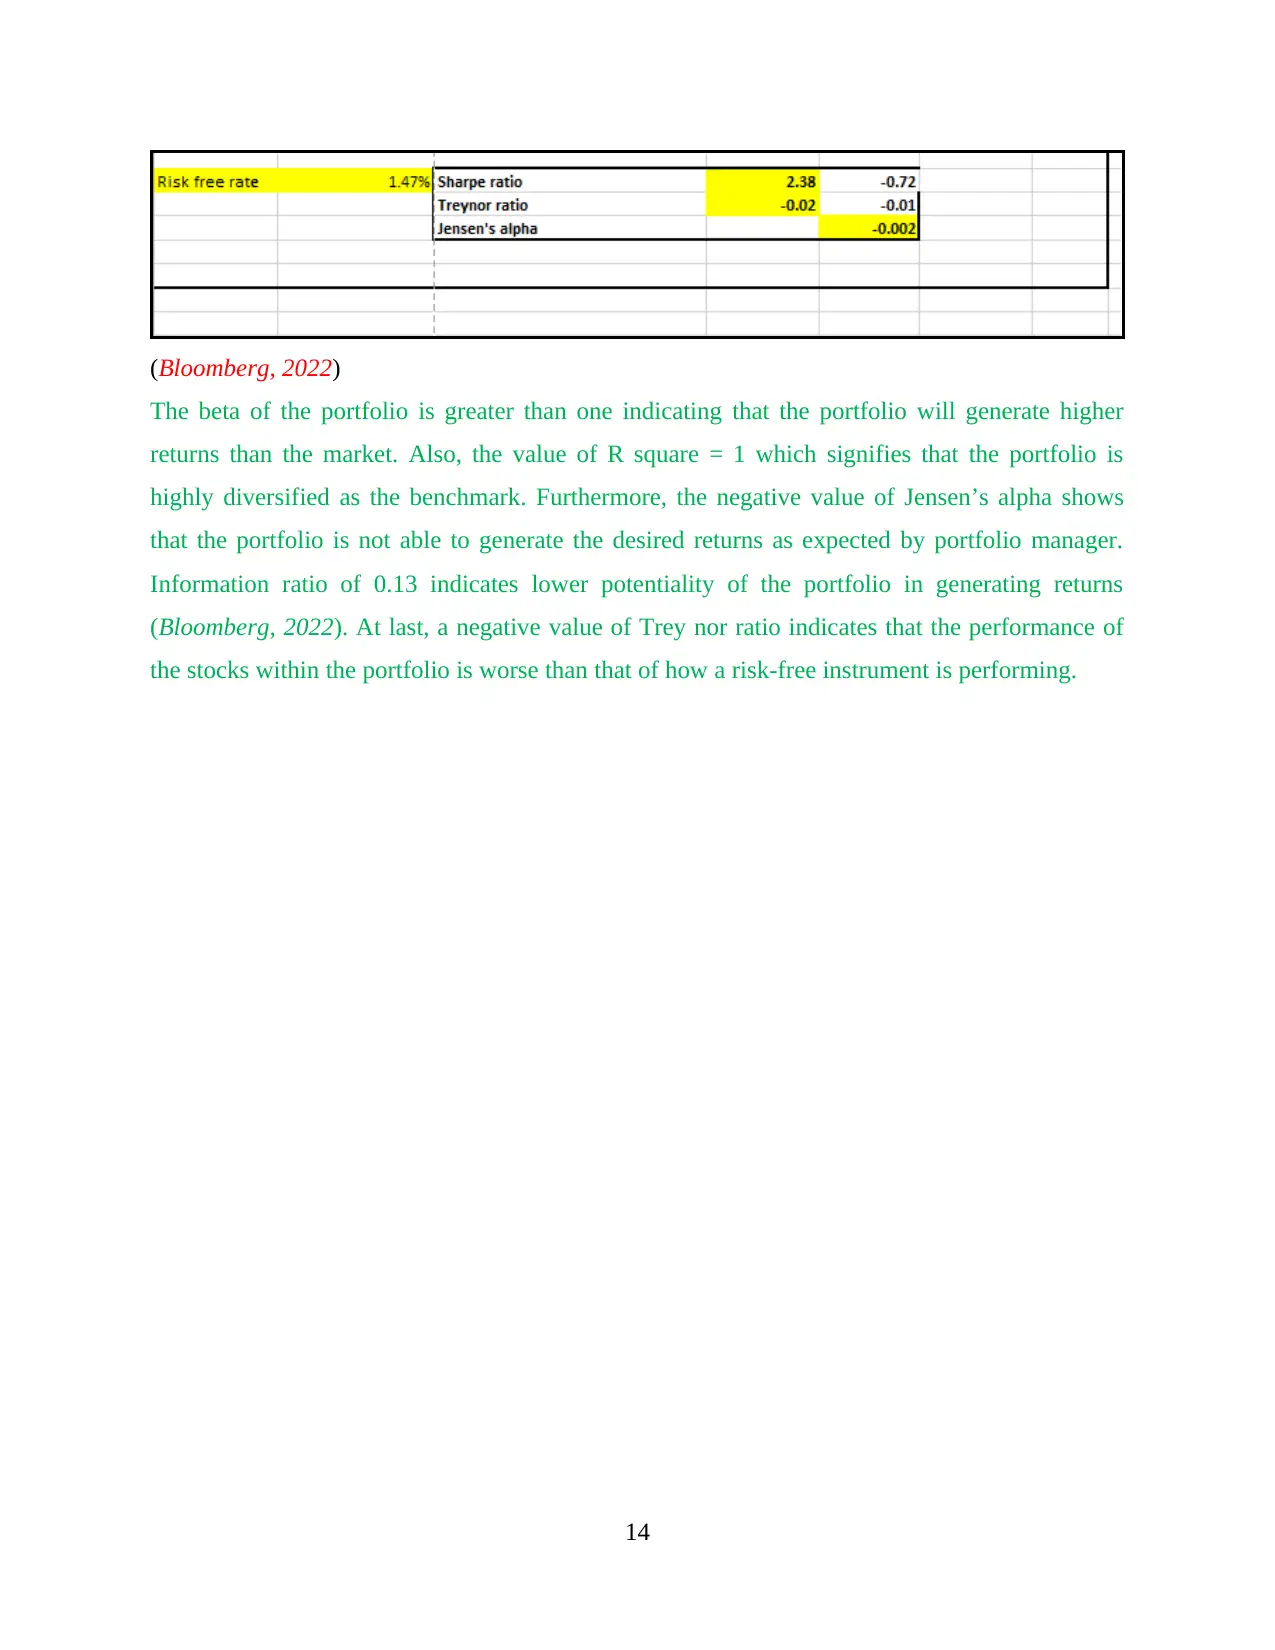
(Bloomberg, 2022)
The beta of the portfolio is greater than one indicating that the portfolio will generate higher
returns than the market. Also, the value of R square = 1 which signifies that the portfolio is
highly diversified as the benchmark. Furthermore, the negative value of Jensen’s alpha shows
that the portfolio is not able to generate the desired returns as expected by portfolio manager.
Information ratio of 0.13 indicates lower potentiality of the portfolio in generating returns
(Bloomberg, 2022). At last, a negative value of Trey nor ratio indicates that the performance of
the stocks within the portfolio is worse than that of how a risk-free instrument is performing.
14
REFERENCES
Books and journals
Ashimov, A. A. and et.al., 2020. Macroeconomic analysis and parametric control of a regional
economic union. Springer.
Bick, A. and Fuchs-Schündeln, N., 2018. Taxation and labour supply of married couples across
countries: A macroeconomic analysis. The Review of Economic Studies. 85(3). pp.1543-
1576.
DeBacker, J., Evans, R. W. and Page, B. R., 2021. A Detailed Macroeconomic Analysis of
President Bidens 2020 Campaign Tax Proposals. Tax Policy Center report, Urban-
Brookings Tax Policy Center July.
Hussain, J., Salia, S. and Karim, A., 2018. Is knowledge that powerful? Financial literacy and
access to finance: An analysis of enterprises in the UK. Journal of Small Business and
Enterprise Development. Sardo, F. and Serrasqueiro, Z., 2018. Intellectual capital, growth
opportunities, and financial performance in European firms: Dynamic panel data
analysis. Journal of Intellectual Capital.
Konstantinov, G. and Rusev, M., 2020. The Bond–Equity–Fund Relation Using the Fama–
French–Carhart Factors: A Practical Network Approach. The Journal of Financial Data
Science. 2(1). pp.24-44.
Kurpayanidi, K. I., 2020. ON THE PROBLEM OF MACROECONOMIC ANALYSIS AND
FORECASTING OF THE ECONOMY. Theoretical & Applied Science. (3). pp.1-6.
Marozva, G. and Makoni, P. L., 2021. The nexus between bond liquidity, stock liquidity and
foreign portfolio investment. International Journal of Finance & Banking Studies (2147-
4486). 10(3). pp.92-103.
Nasir, M. A., Rizvi, S. A. and Rossi, M., 2018. A treatise on oil price shocks and their
implications for the UK financial sector: analysis based on time‐varying structural VAR
model. The Manchester School, 86(5), pp.586-621.
Online references
Top UK Diversified Banks Stocks for Q2 2022 Quarter. 2022. [Online]. Available through <
https://fknol.com/uk/invest/diversified-banks-stocks.php>
15
Secure Best Marks with AI Grader
Need help grading? Try our AI Grader for instant feedback on your assignments.
Consumer Staples Stocks List UK 2022 (LSE). 2022. [Online]. Available Through <
https://fknol.com/uk/stock/consumer-staples.php>
Global Company Financial Data, 2022. [Online]. Available Through:<
https://www.bloomberg.com/professional/dataset/global-company-financials-data/>
Unilever Annual report, 2021. [Online]. Available Through:<
https://www.bloomberg.com/profile/company/ULVR:LN>
Royal Dutch Shell: SHELL PUBLISHES ANNUAL REPORT AND ACCOUNTS, 2021. [Online].
Available Through:< https://www.bloomberg.com/press-releases/2020-03-12/royal-dutch-
shell-shell-publishes-annual-report-and-accounts>
HSBC holdings Annual report, 2021. [Online]. Available through:<
https://www.bloomberg.com/profile/company/HSBC:US>
16
APPENDICES
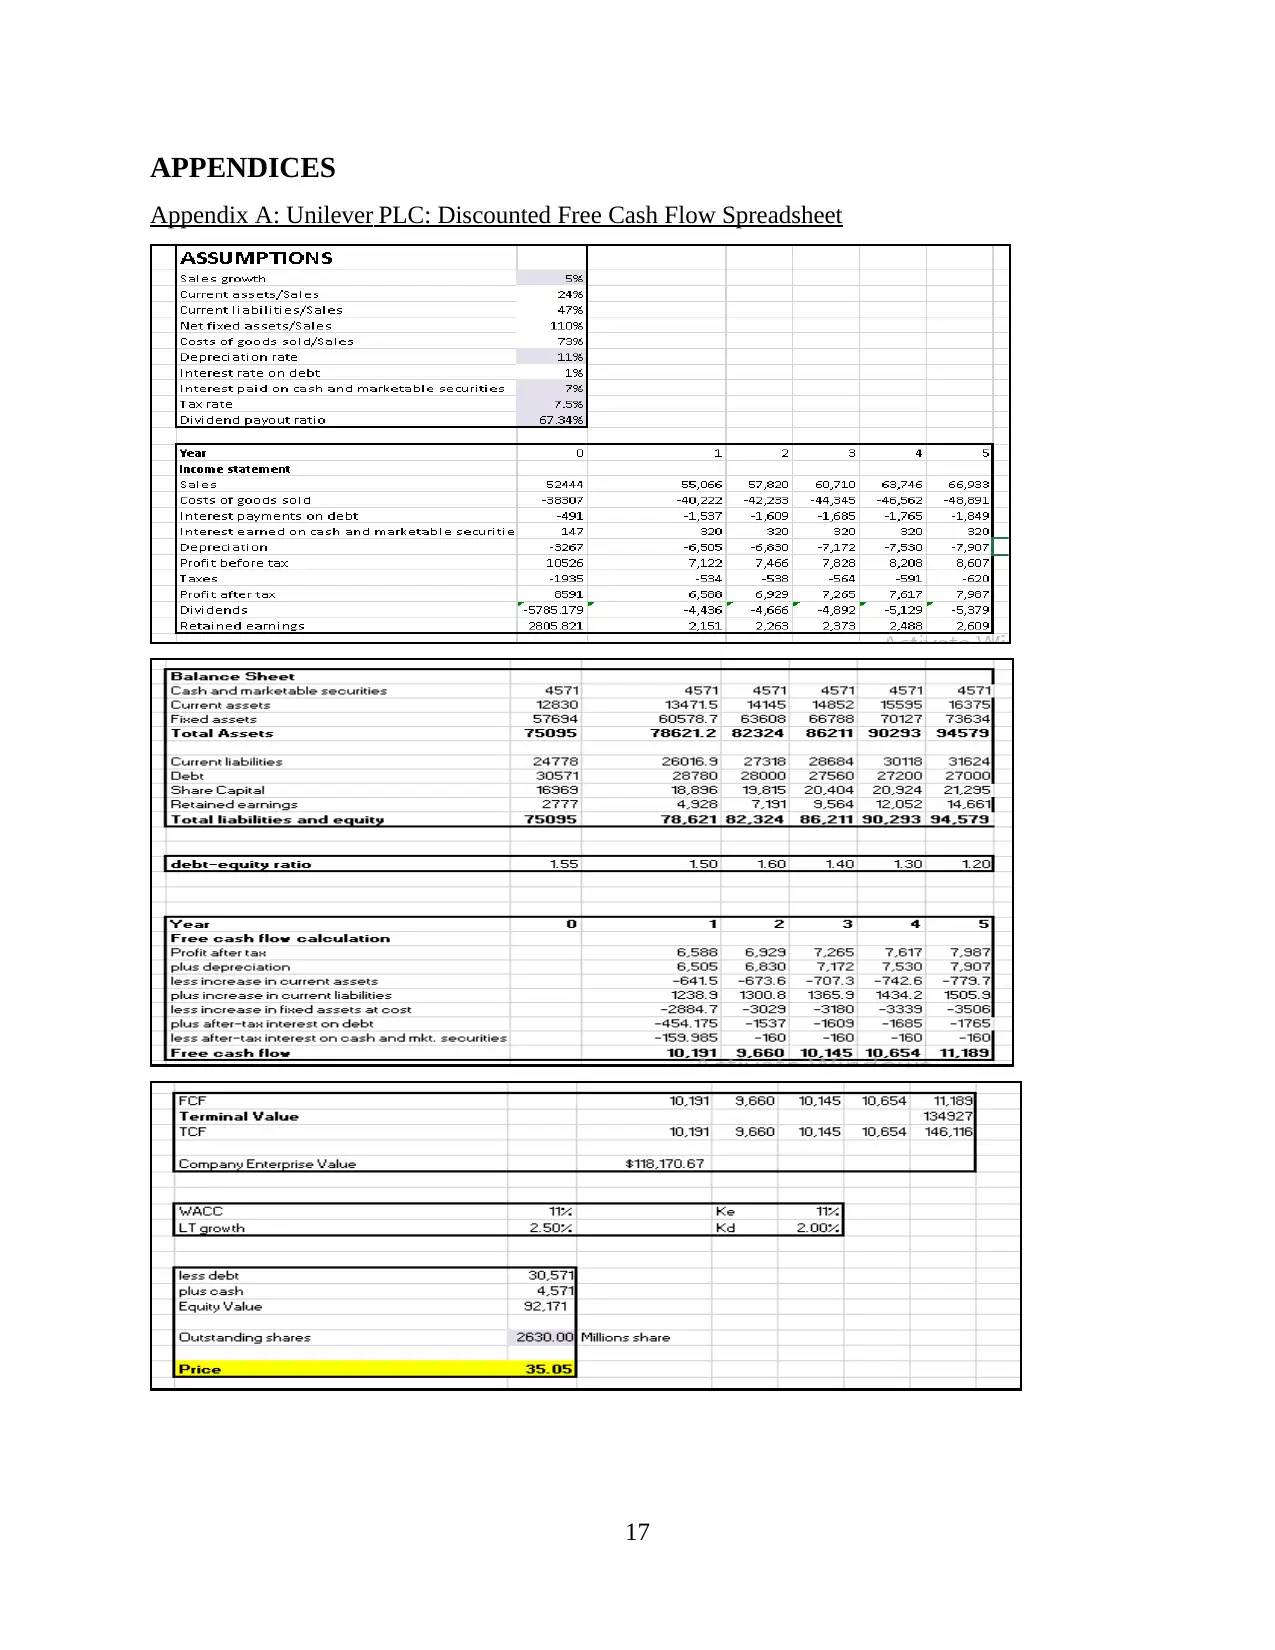
Appendix A: Unilever PLC: Discounted Free Cash Flow Spreadsheet
17
Appendix A: Unilever PLC: Discounted Free Cash Flow Spreadsheet
17
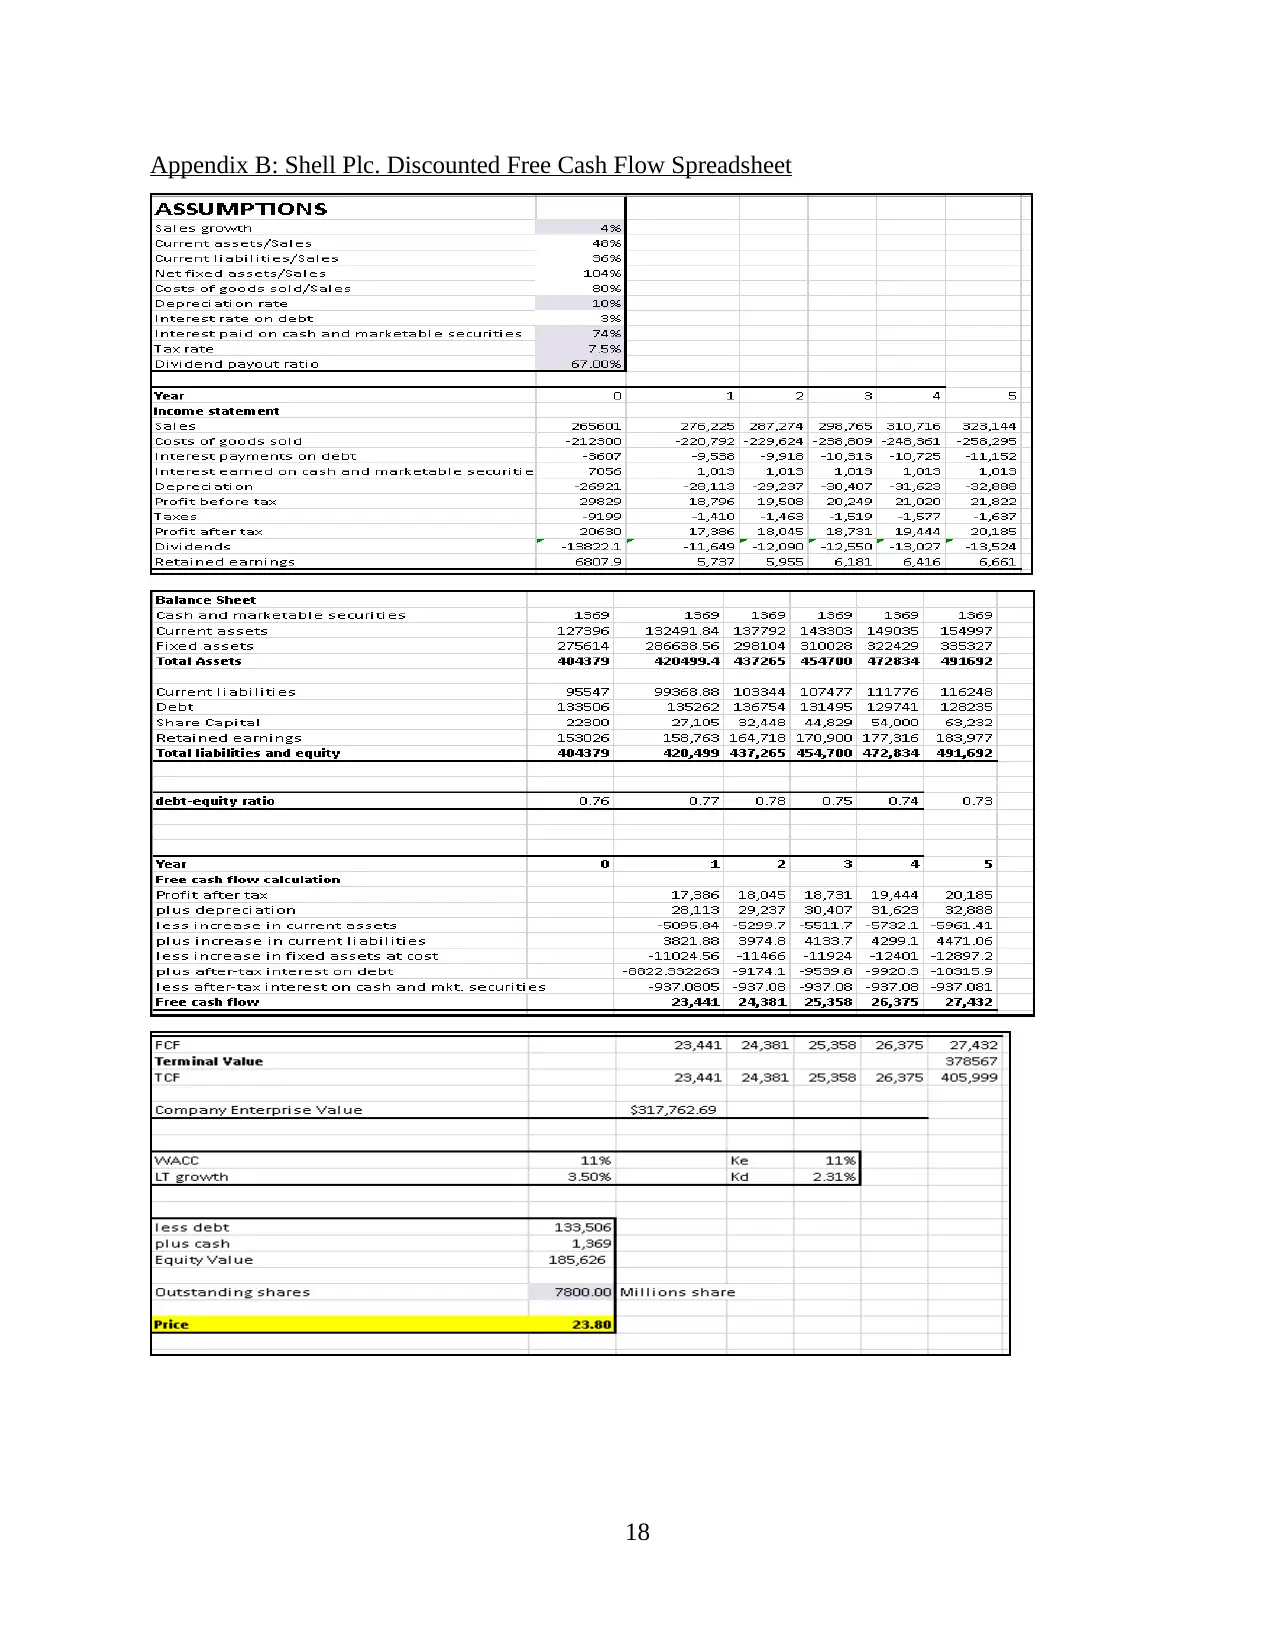
Appendix B: Shell Plc. Discounted Free Cash Flow Spreadsheet
18
18
Paraphrase This Document
Need a fresh take? Get an instant paraphrase of this document with our AI Paraphraser
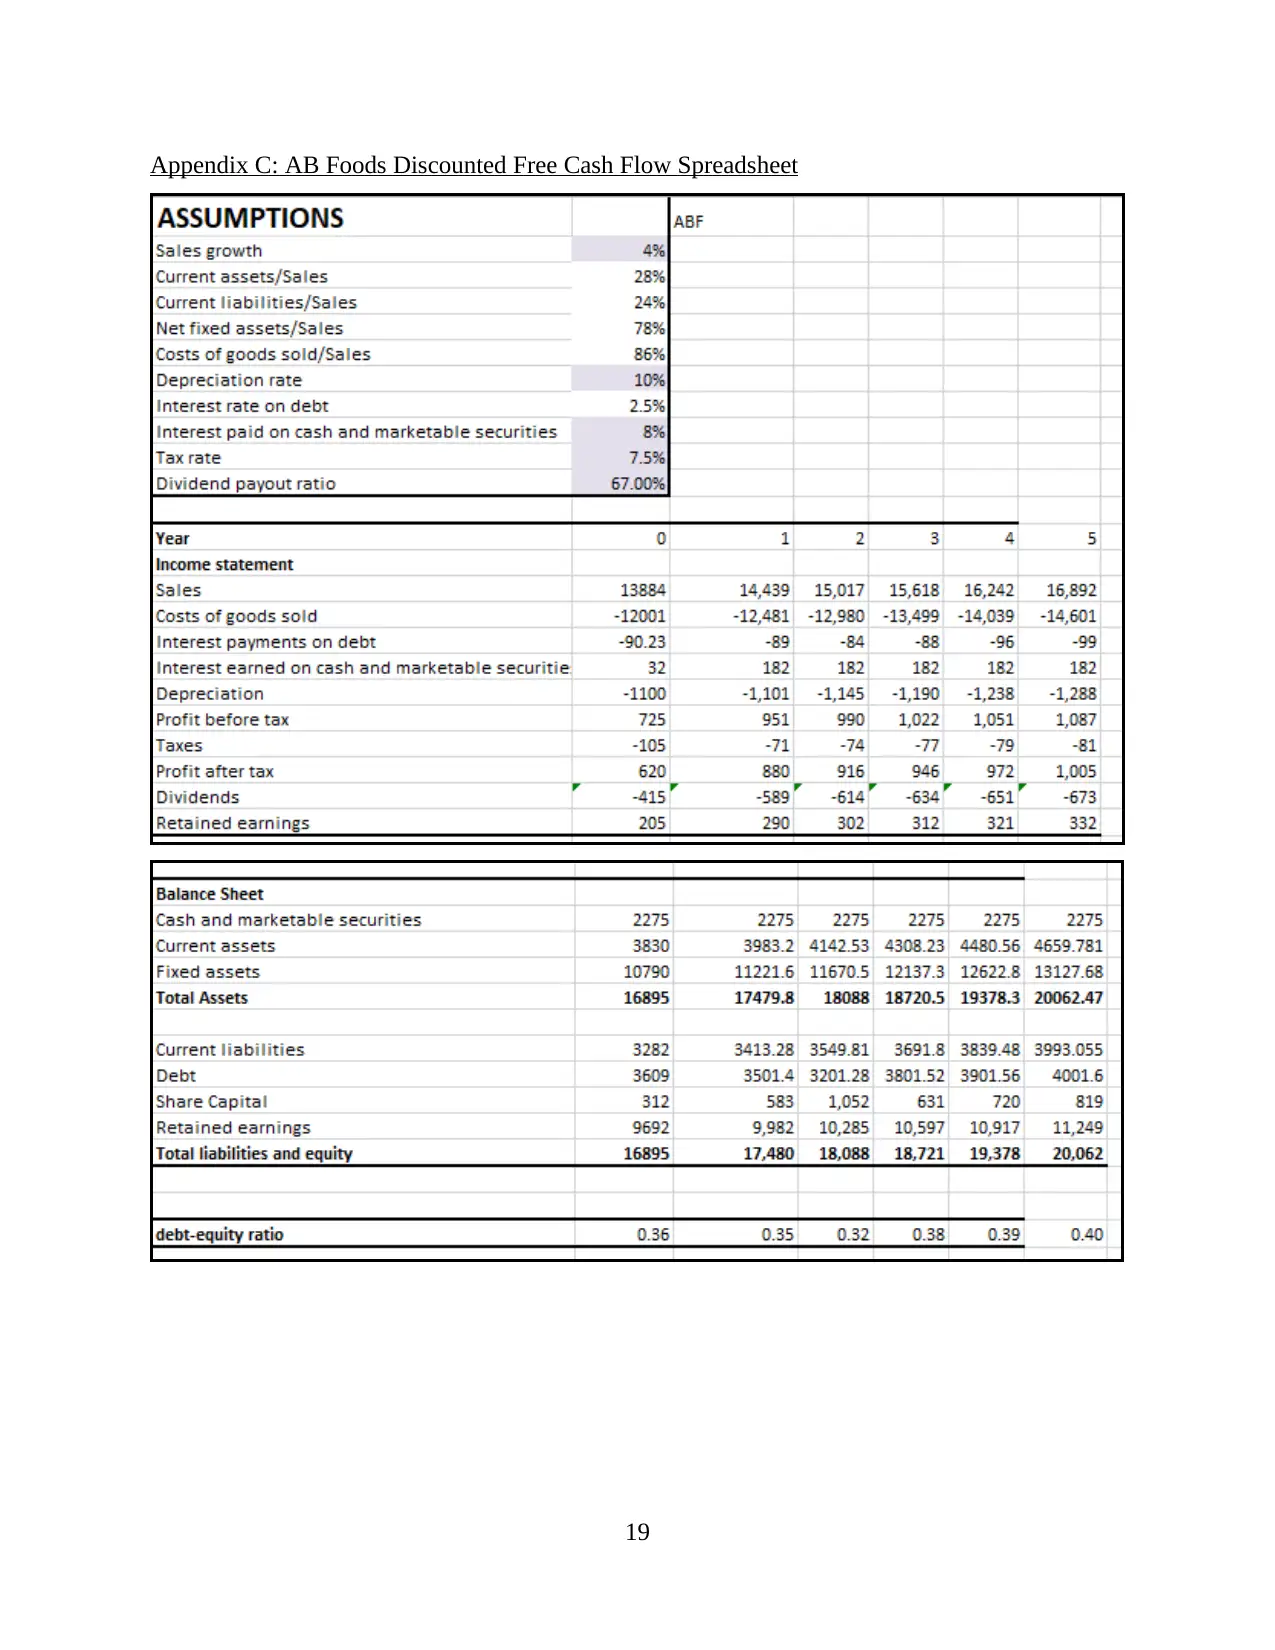
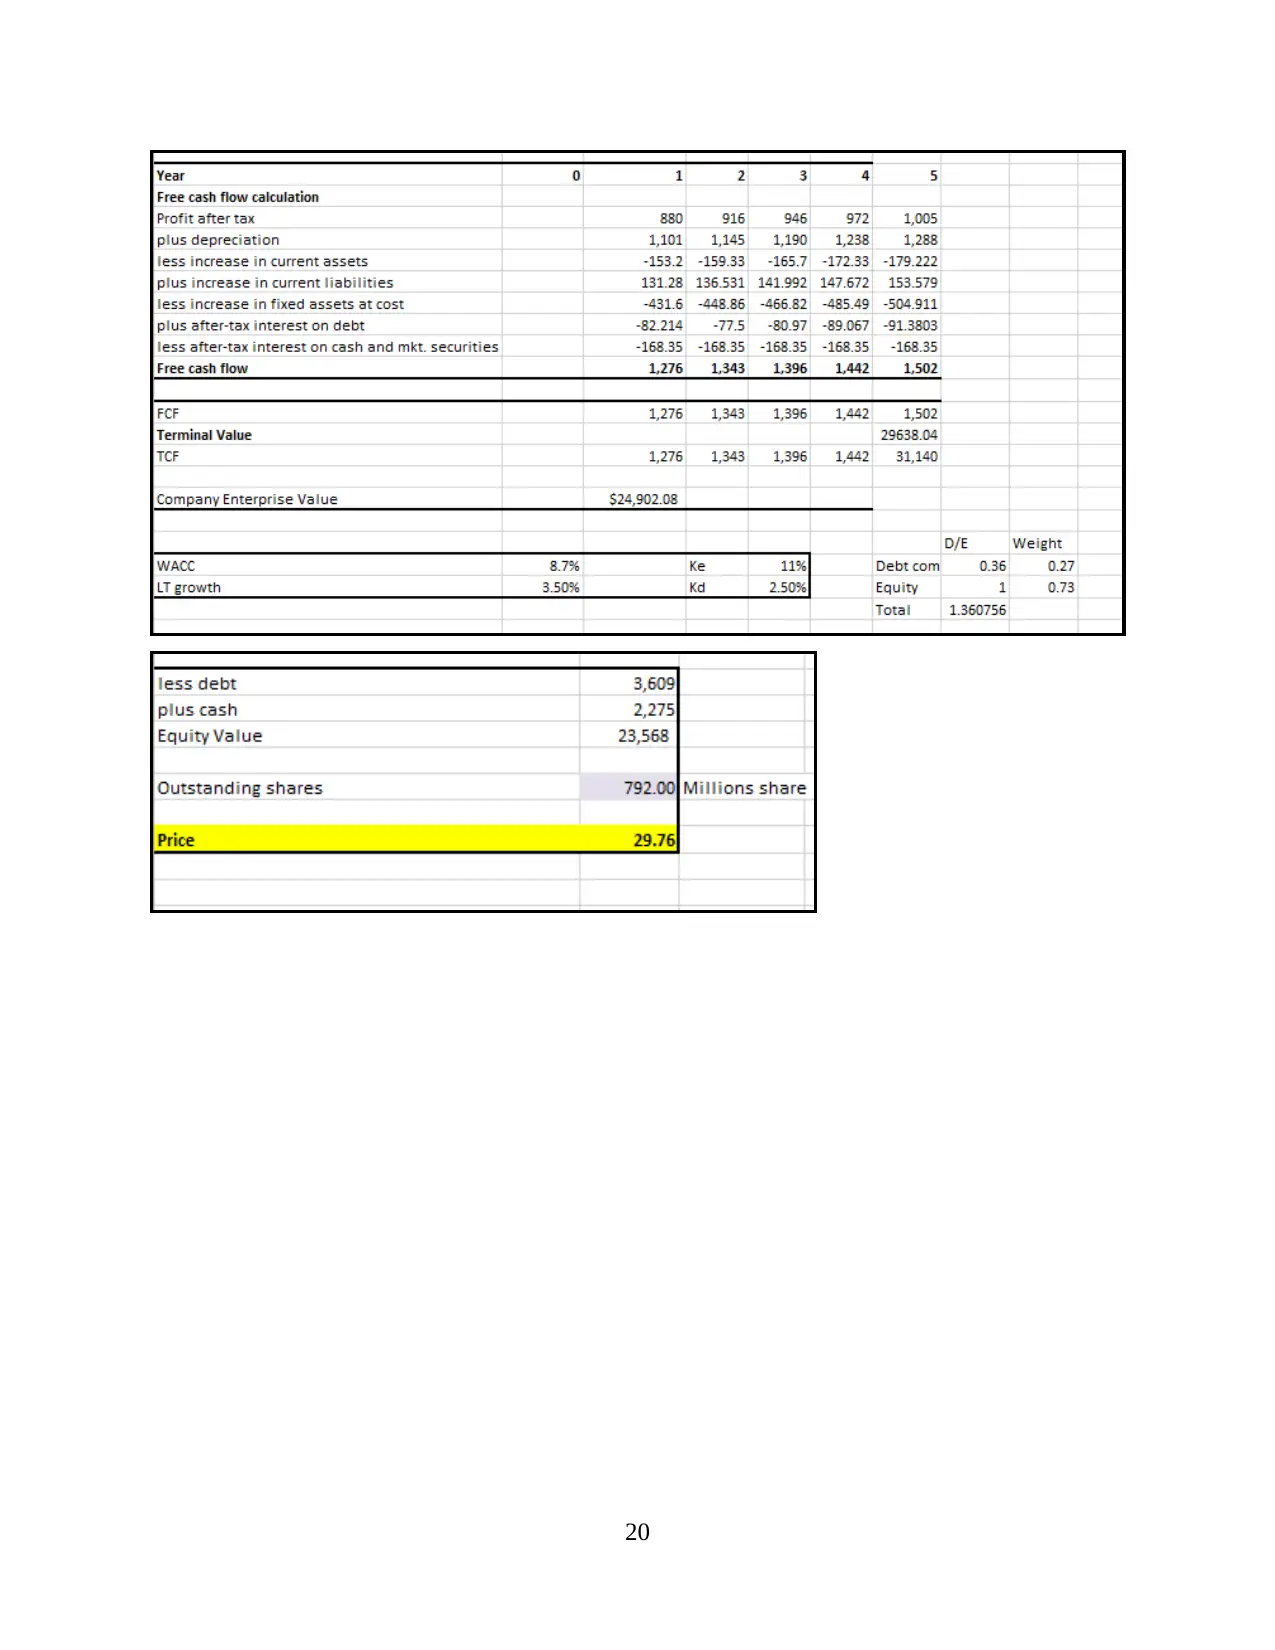
Appendix C: AB Foods Discounted Free Cash Flow Spreadsheet
19
19
20
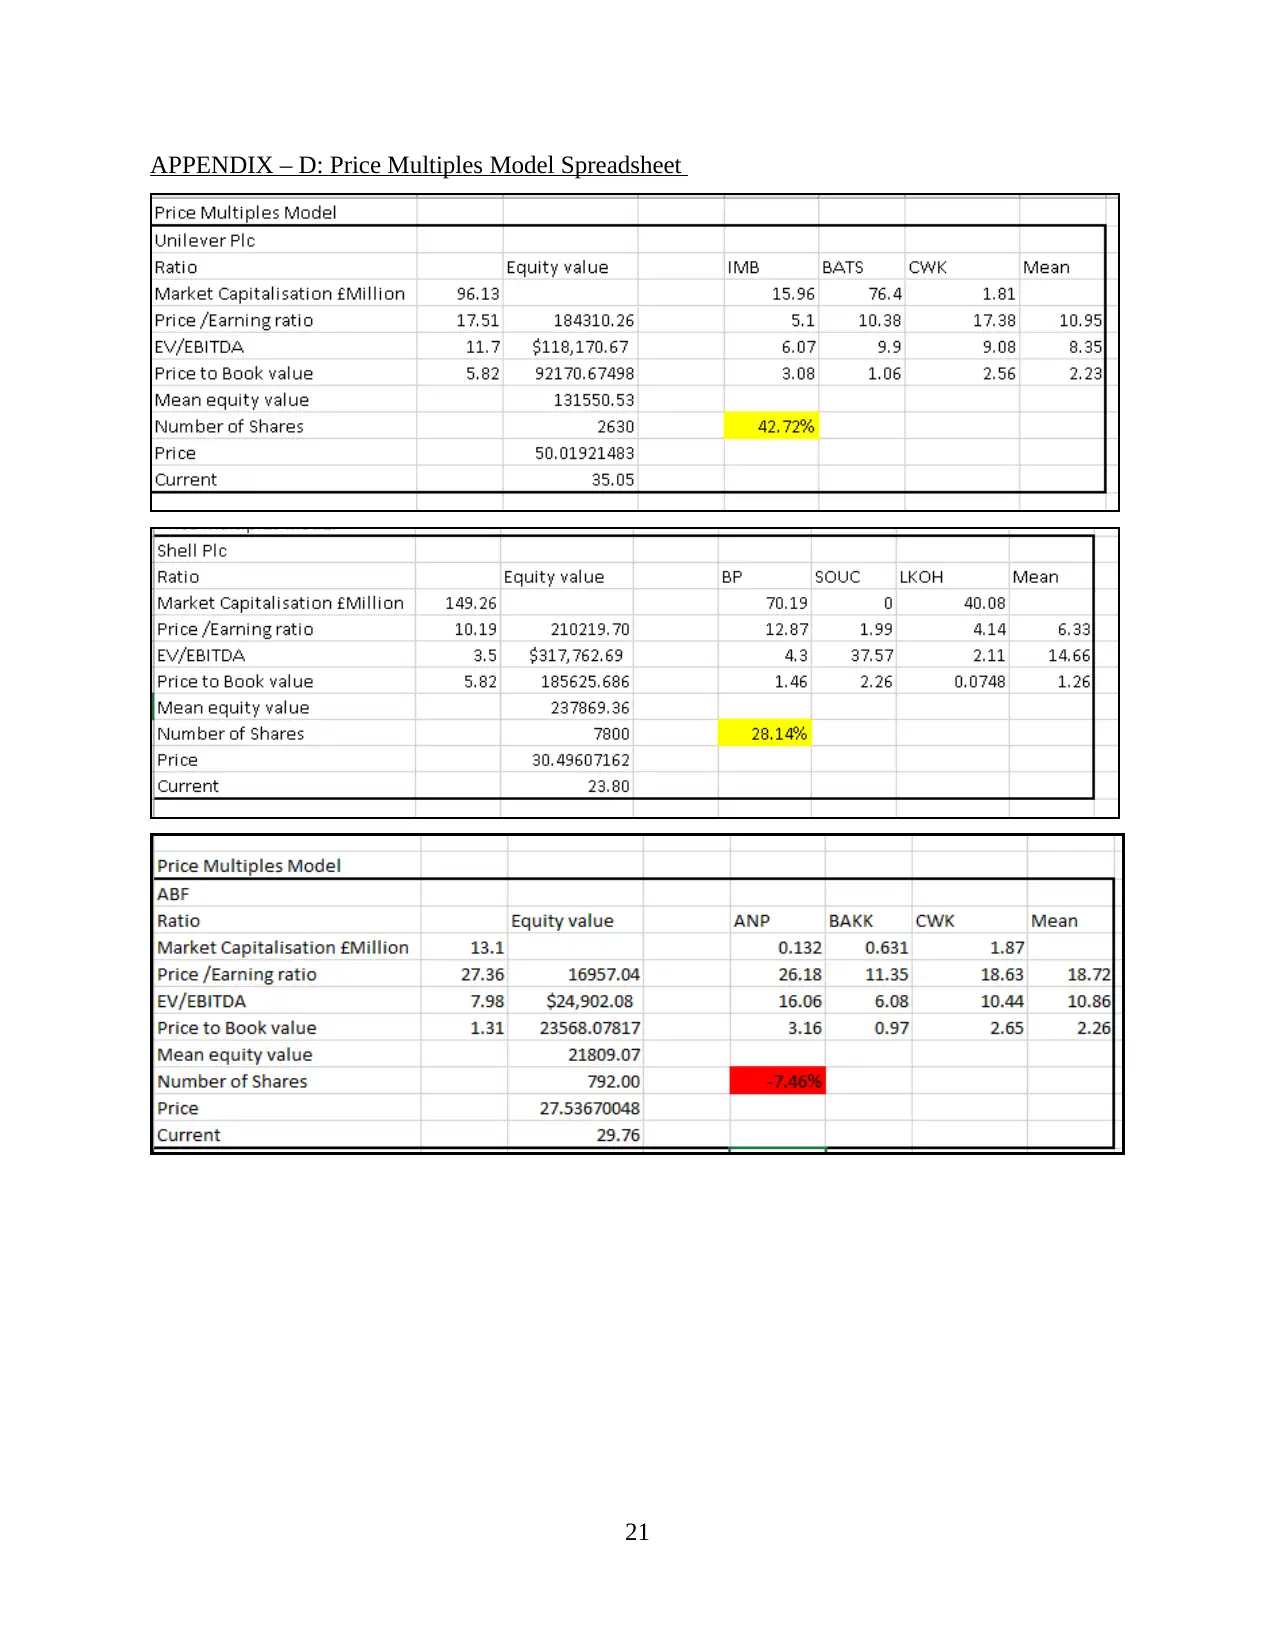
APPENDIX – D: Price Multiples Model Spreadsheet
21
21
Secure Best Marks with AI Grader
Need help grading? Try our AI Grader for instant feedback on your assignments.
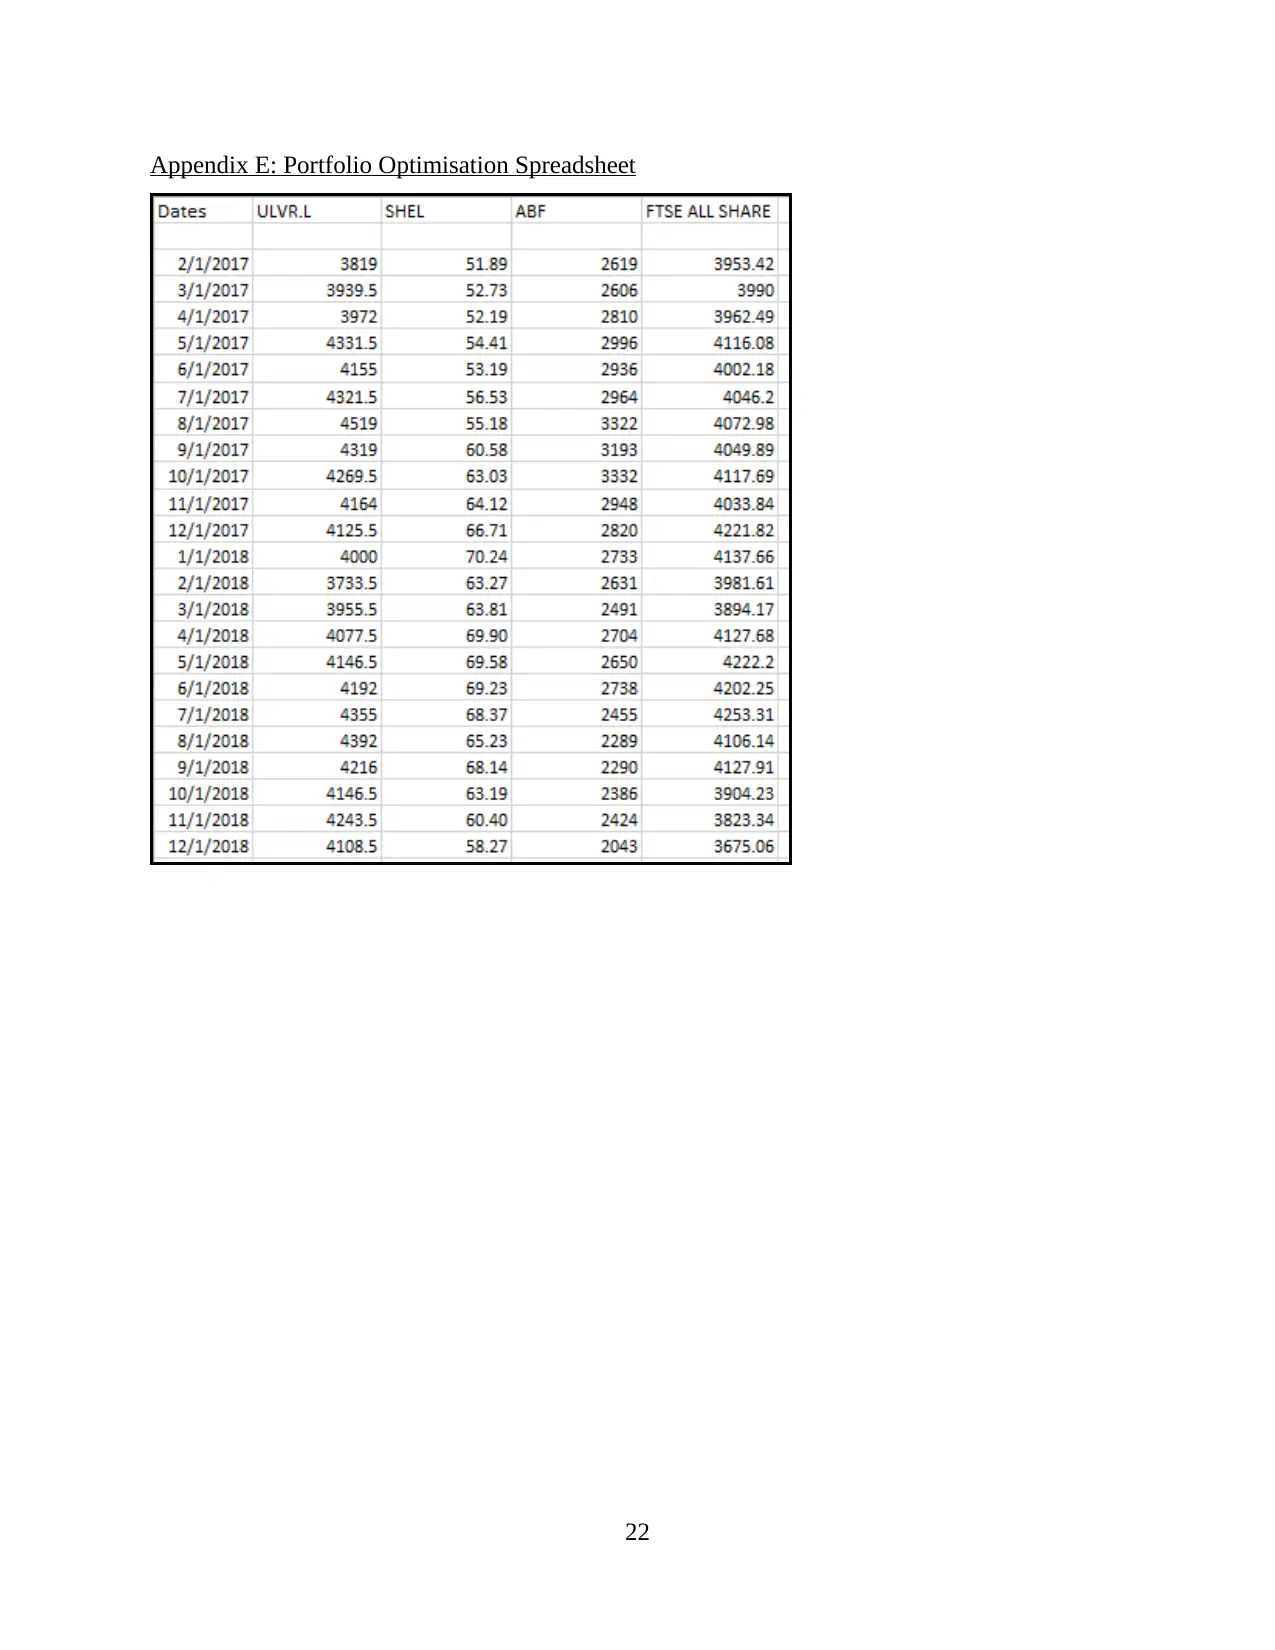
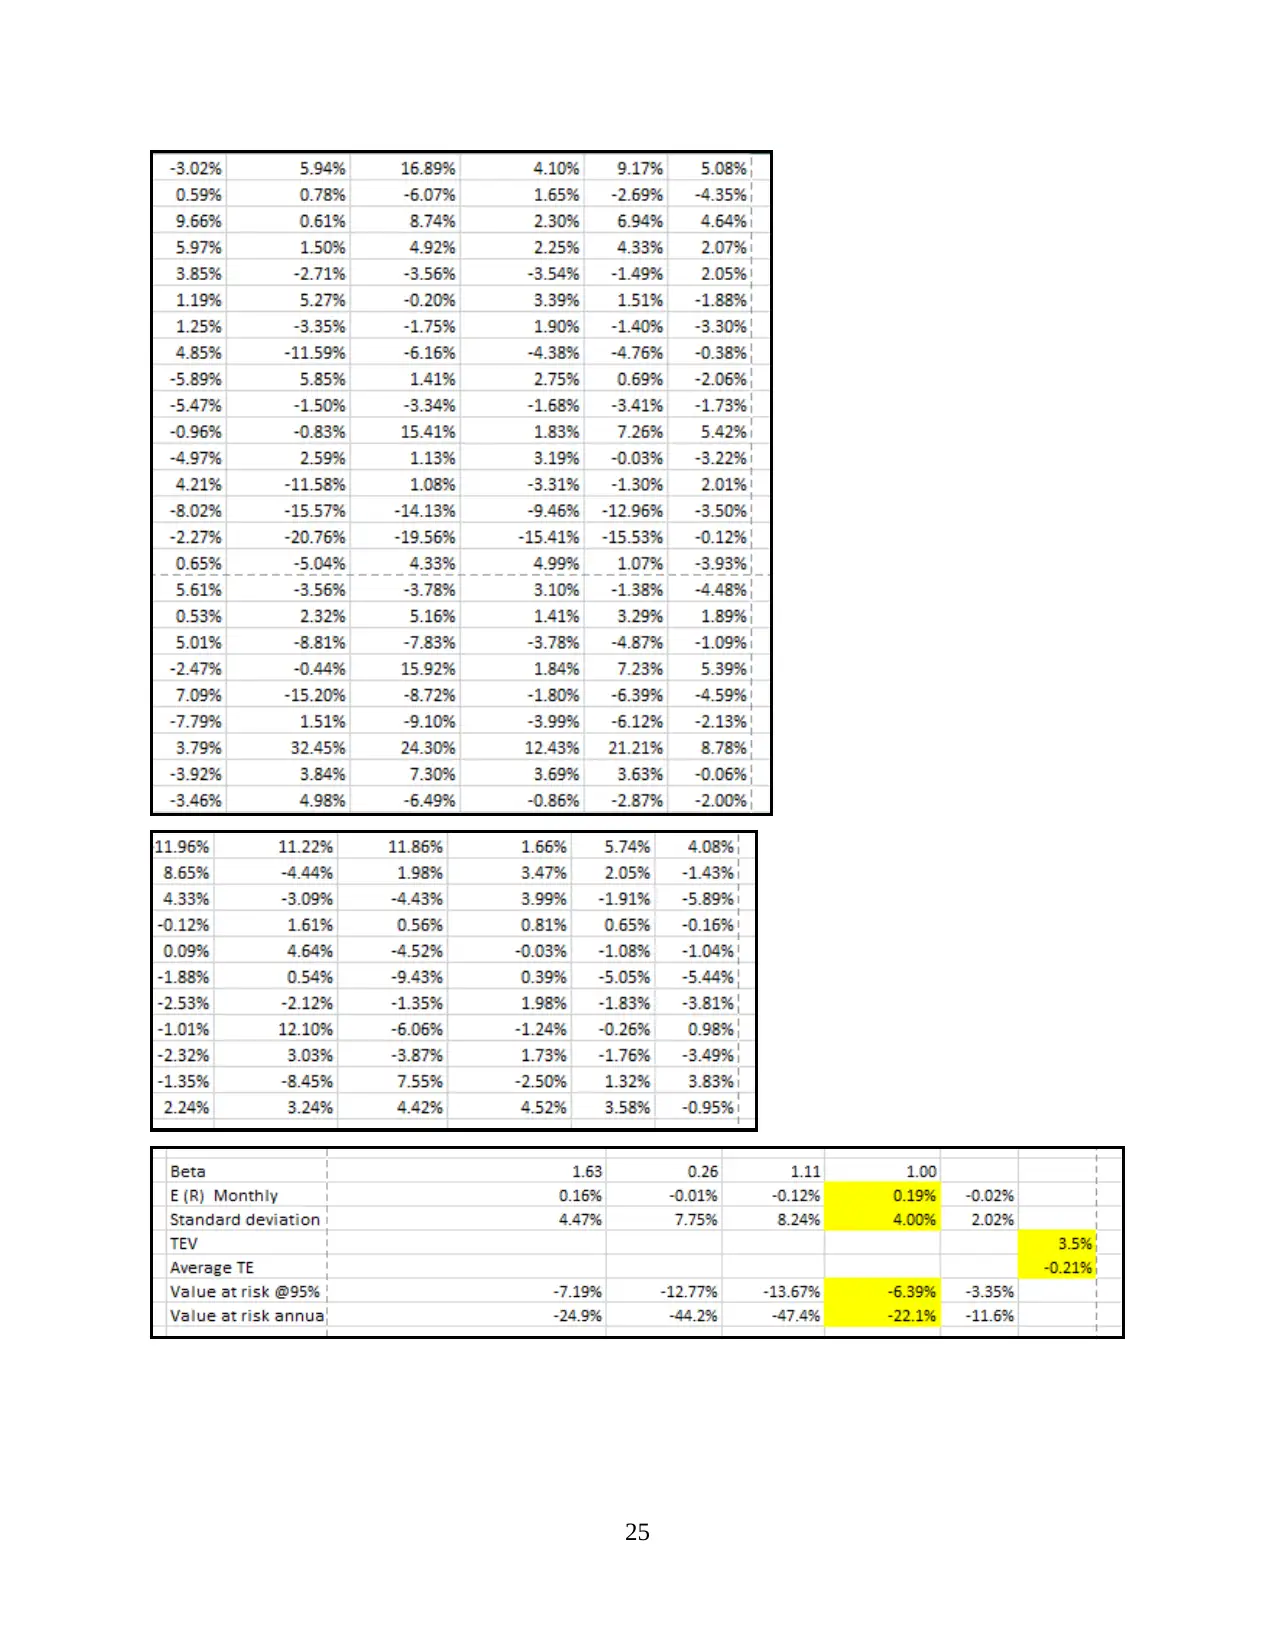
Appendix E: Portfolio Optimisation Spreadsheet
22
22
23
24
Paraphrase This Document
Need a fresh take? Get an instant paraphrase of this document with our AI Paraphraser
25
Appendix F: Portfolio Evaluation Spreadsheet
26
26
1 out of 27


Your All-in-One AI-Powered Toolkit for Academic Success.
+13062052269
info@desklib.com
Available 24*7 on WhatsApp / Email
![[object Object]](/_next/static/media/star-bottom.7253800d.svg)
Unlock your academic potential
© 2024 | Zucol Services PVT LTD | All rights reserved.