Financial Performance Analysis of J Sainsbury PLC (2018-2020)
VerifiedAdded on 2023/01/11
|10
|1330
|58
Report
AI Summary
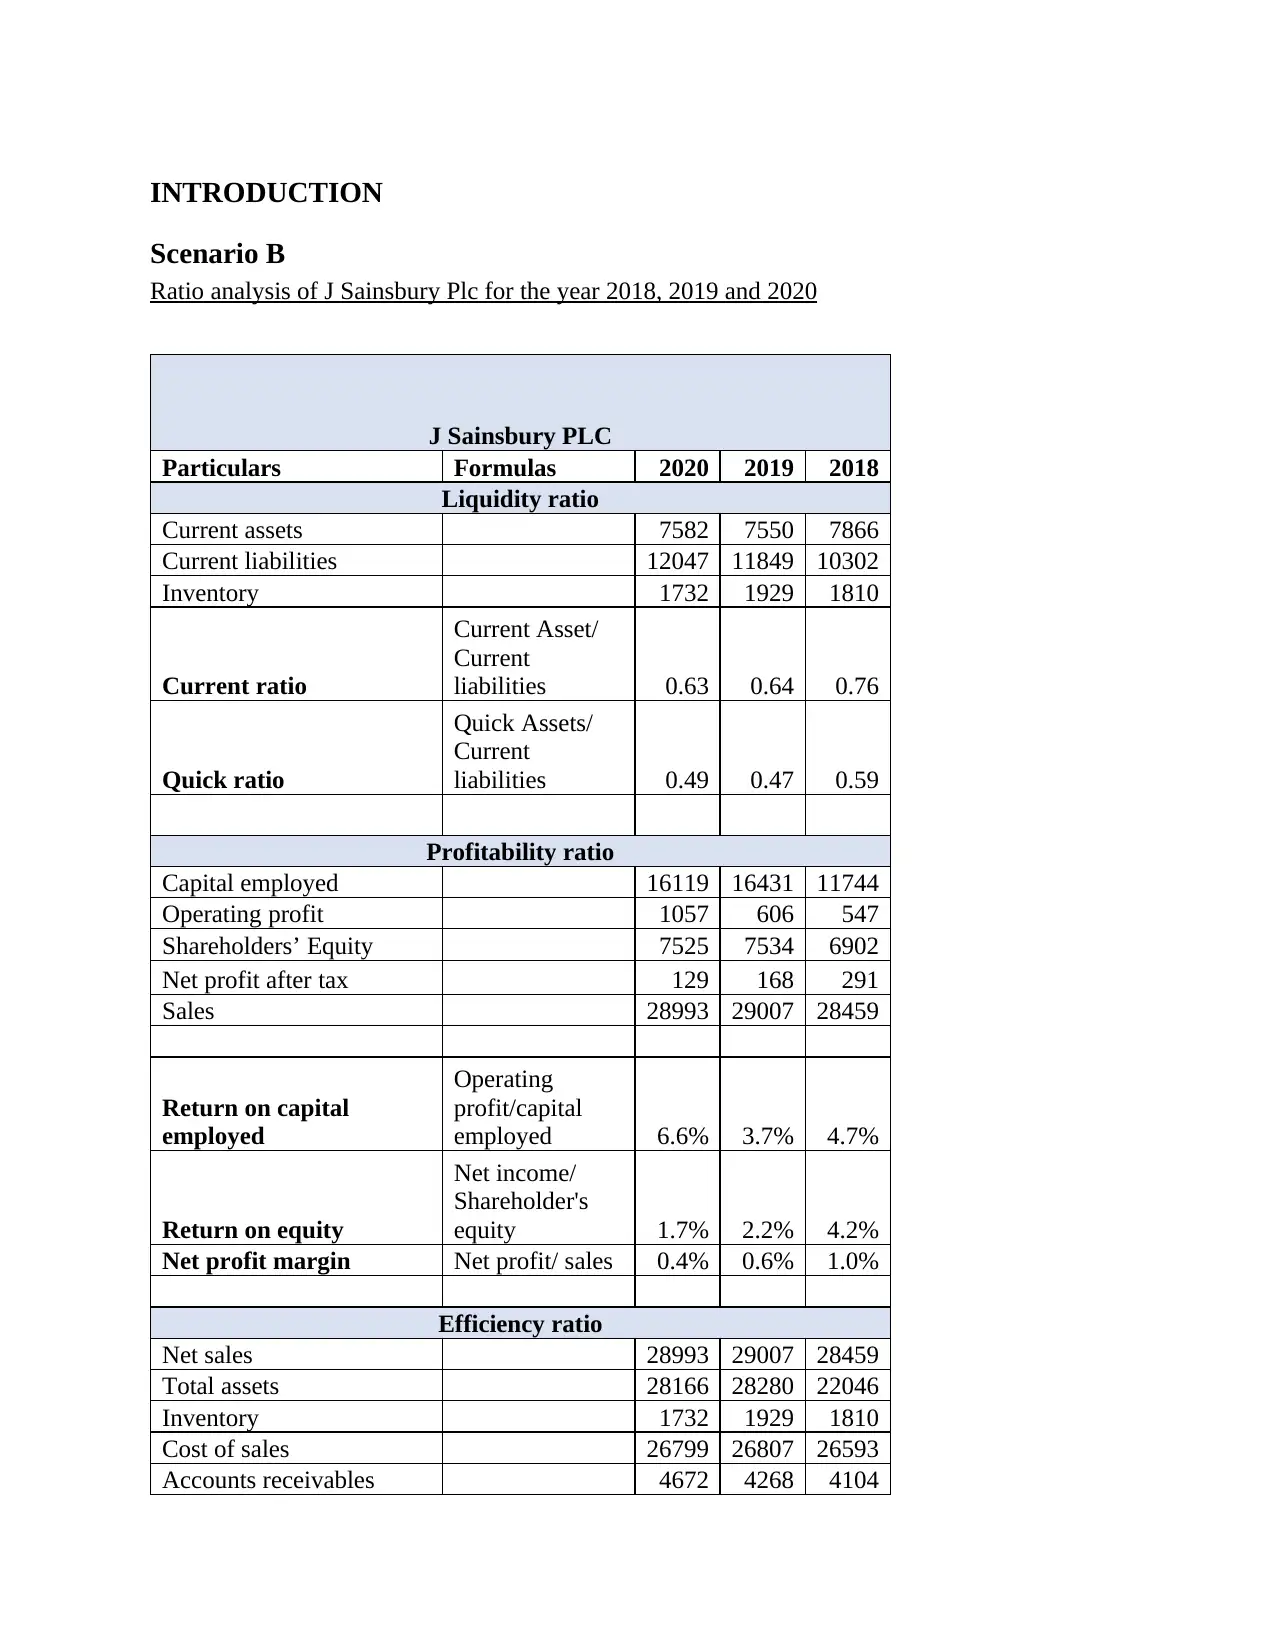
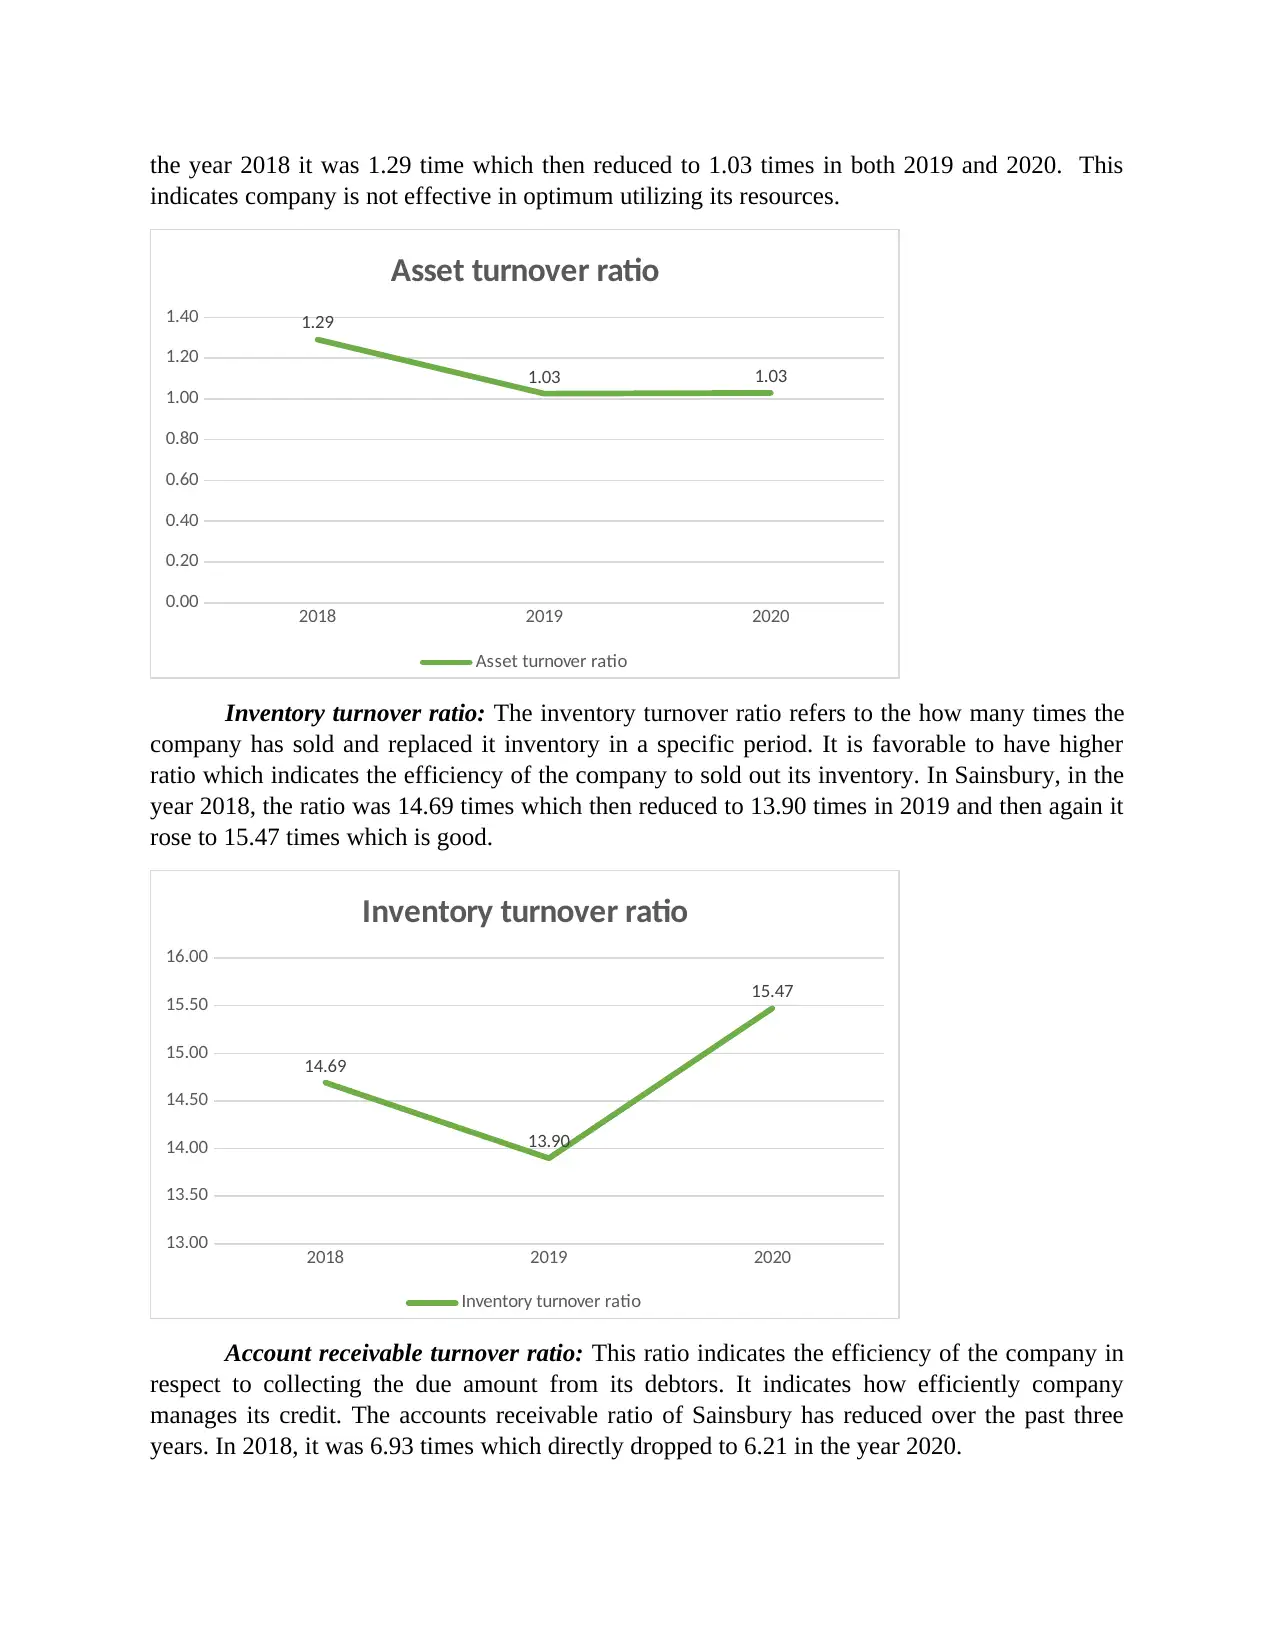
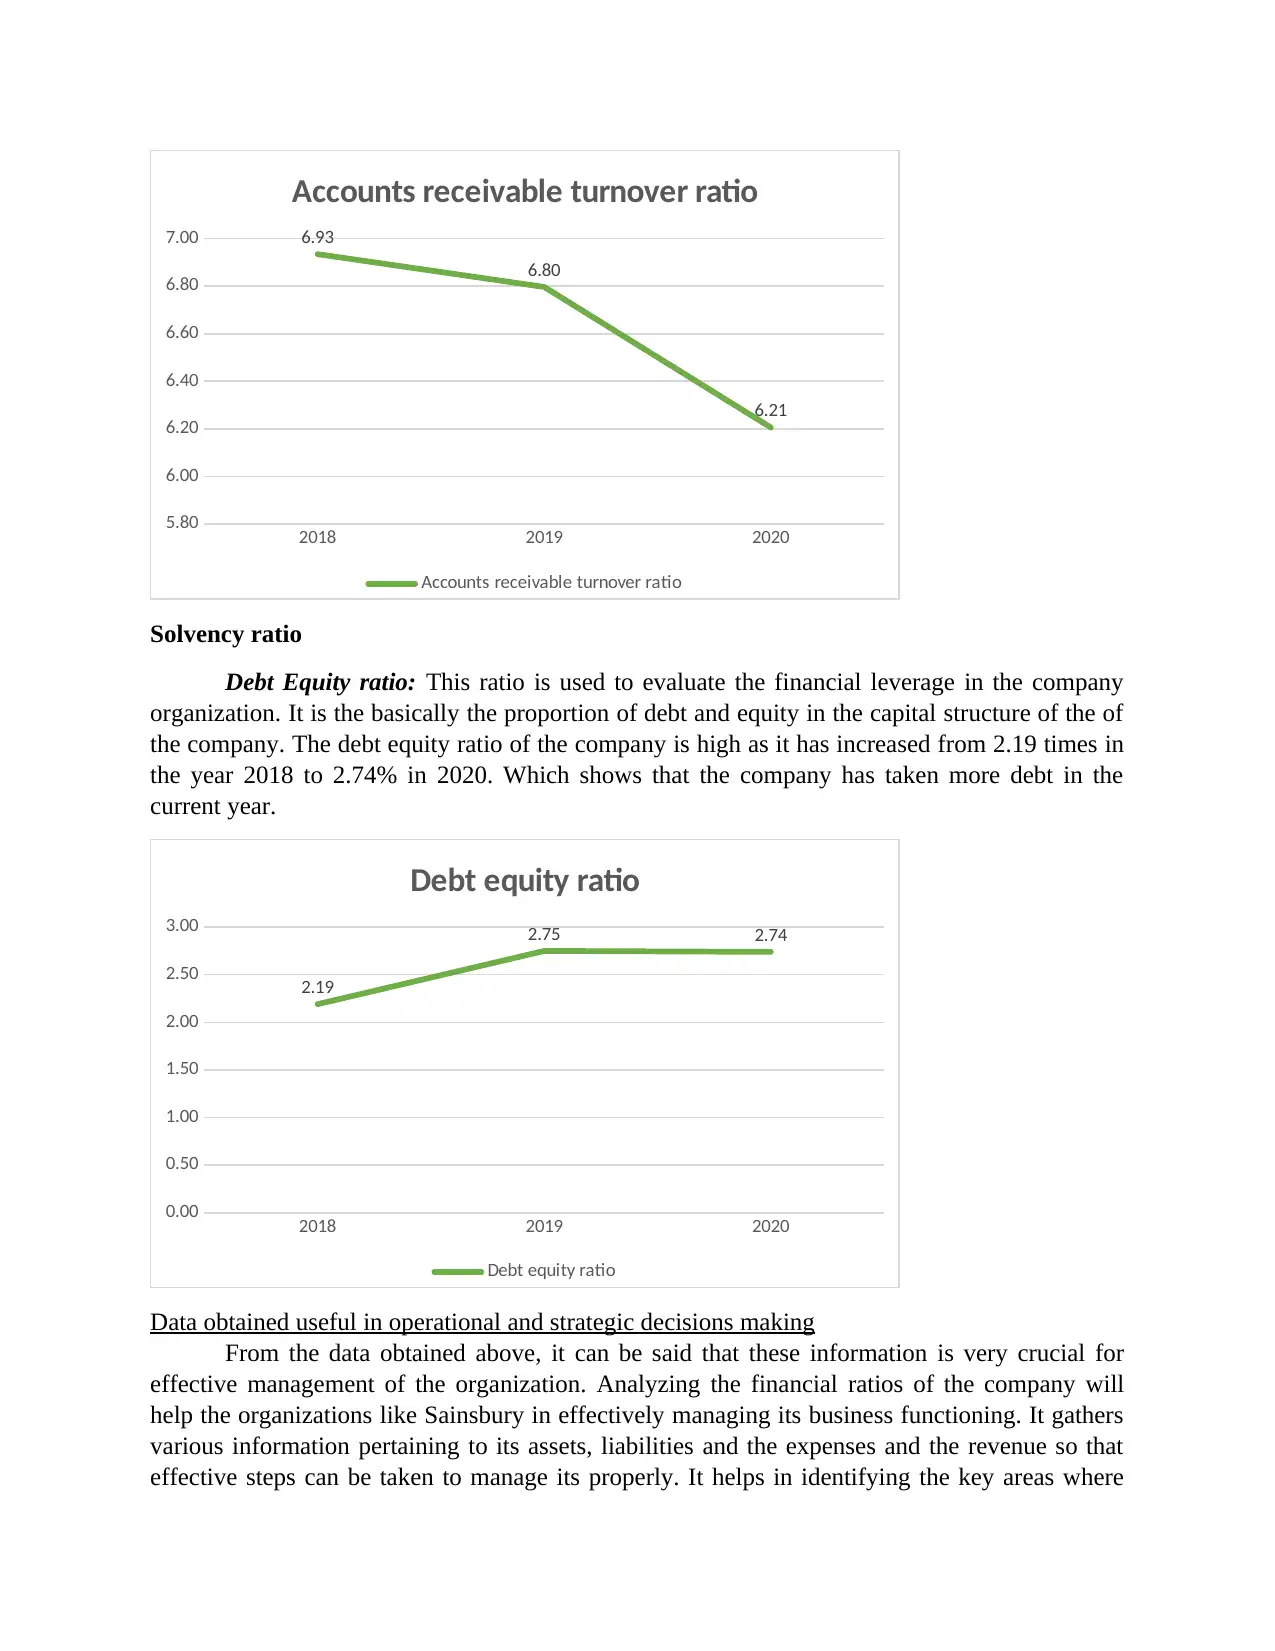
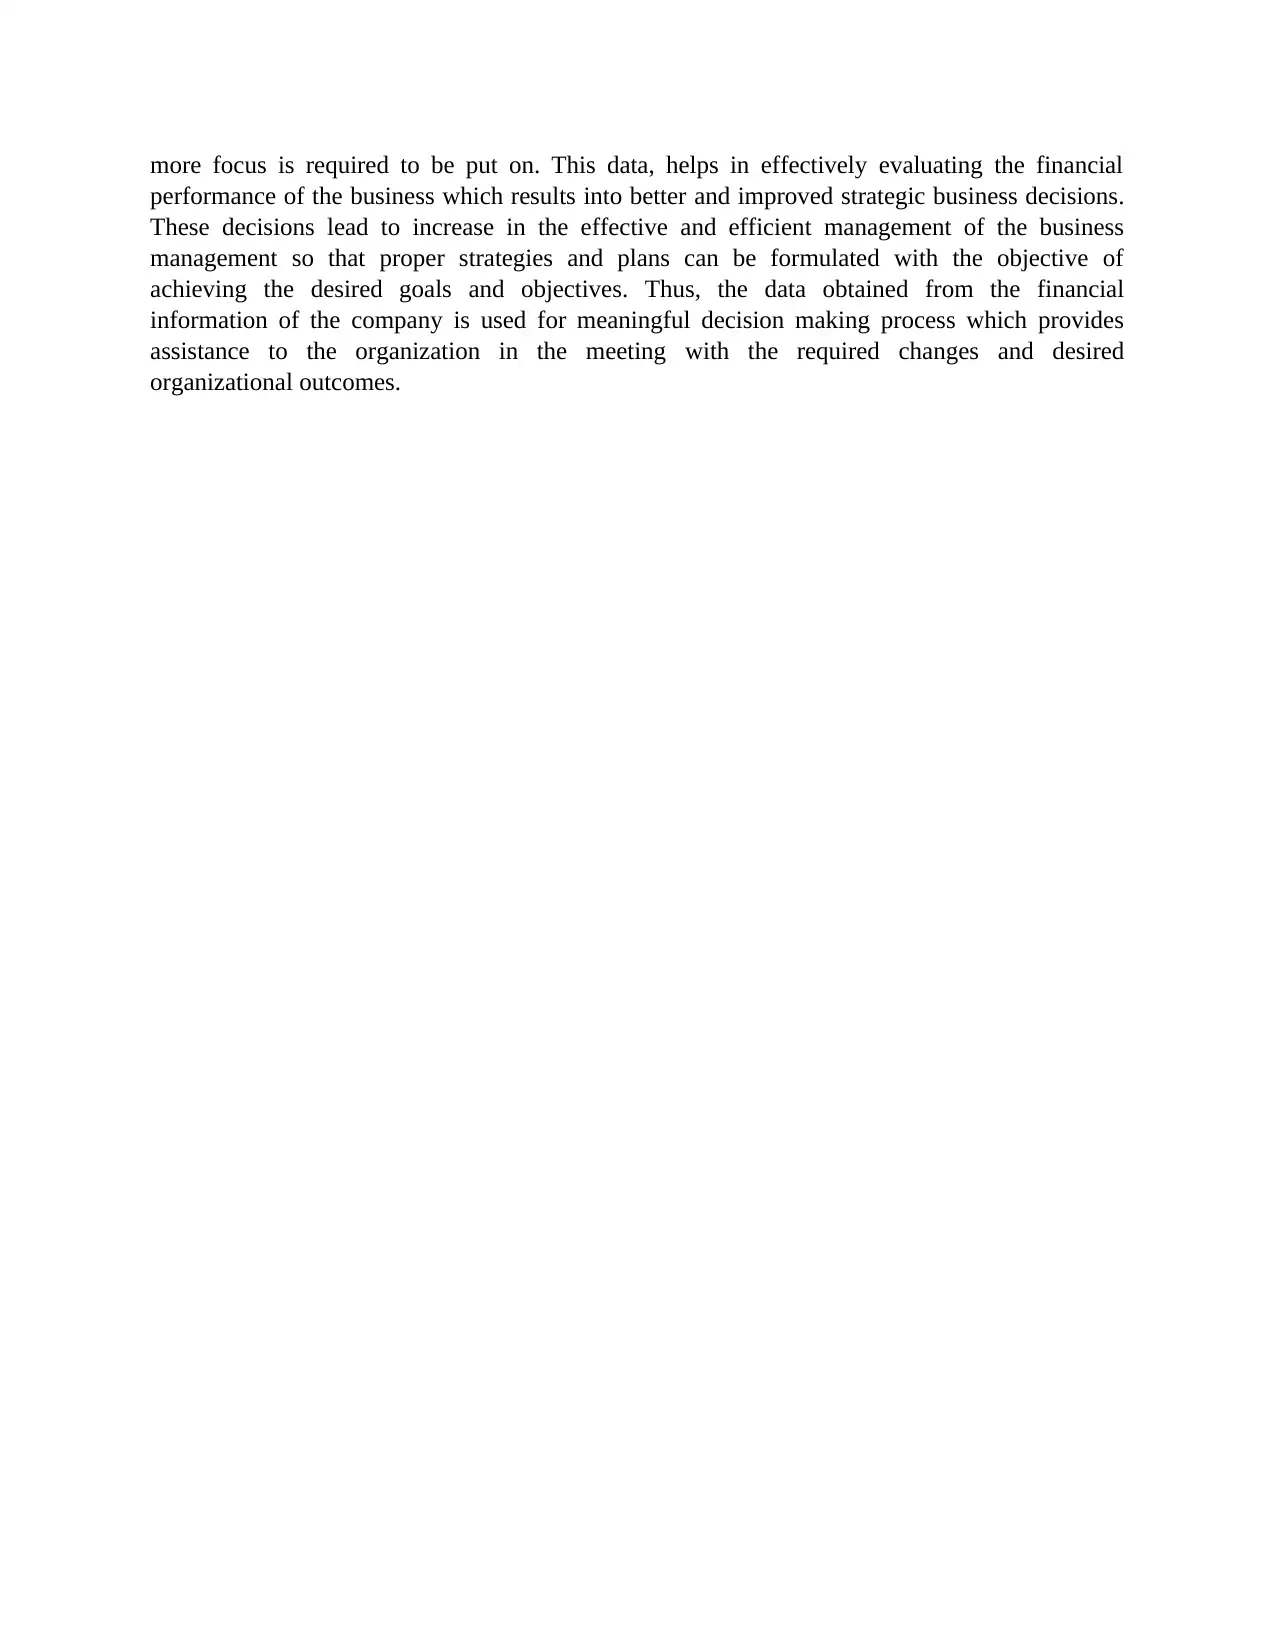
This report presents a comprehensive financial analysis of J Sainsbury PLC, evaluating its performance from 2018 to 2020 using various financial ratios. The analysis encompasses liquidity ratios (current and quick ratios), profitability ratios (return on capital employed, return on equity, and net profit margin), efficiency ratios (asset turnover, inventory turnover, and accounts receivable turnover), and solvency ratios (debt-equity ratio). The report provides a detailed examination of each ratio, including calculations, trends, and interpretations of the company's financial health, efficiency, and solvency. The data obtained is useful for operational and strategic decision-making, helping identify key areas for improvement and informing better strategic business decisions, ultimately aimed at achieving desired organizational goals and outcomes.


1 out of 10
Related Documents


Your All-in-One AI-Powered Toolkit for Academic Success.
+13062052269
info@desklib.com
Available 24*7 on WhatsApp / Email
![[object Object]](/_next/static/media/star-bottom.7253800d.svg)
Copyright © 2020–2026 A2Z Services. All Rights Reserved. Developed and managed by ZUCOL.