Economic and Financial Management Analysis: Tesco PLC (2017-2019)
VerifiedAdded on 2022/08/14
|16
|3949
|14
Report
AI Summary
This report provides an in-depth analysis of Tesco PLC's economic and financial management from 2017 to 2019. It begins with an executive summary and an introduction to the company, emphasizing the relationship between economics and business. The report then delves into the analysis of macro and microeconomic factors influencing Tesco, supported by relevant diagrams. It presents a detailed ratio analysis, calculating and interpreting key financial ratios such as Return on Capital Employed (ROCE), Net Profit Margin (NPM), Current Ratio, Debtors Collection Period, Creditors Payment Period, and efficiency ratios. The implications of these ratios are thoroughly discussed, offering insights into Tesco's financial health and performance. Finally, the report concludes with future recommendations for potential investors, providing a comprehensive overview of Tesco's financial standing and prospects.
Running Head: FINANCIAL MANAGEMENT
0
Economic and Financial Management
Tesco
(Student Details: )
2/14/2020
0
Economic and Financial Management
Tesco
(Student Details: )
2/14/2020
Paraphrase This Document
Need a fresh take? Get an instant paraphrase of this document with our AI Paraphraser
FINANCIAL MANAGEMENT
1
Executive Summary
The report is aiming to analyze the economic as well as financial position of TESCO PLC in
order to evaluate the future prospects and opportunities. Here, the financial analysis will be
based on company’s recent annual financial statements. Here, the organization is
headquatered in United Kingdom. Besides, the main scope of this analysis shall be restricted
to the financial qualities, strengths as well as weakness of the company with the help of its
financial statements of the last year and past few years. In this report, the key importance of
financial ratios will be discussed and explored from the economic and financial management
perspective. Post introducting the company, this paper will contain the process how economic
factors influence business and threby it will discuss performance of the chosen company on
the basis of micro economic and macro economic factors. While discussing diverse
perspectives of the financial analysis, the report will include key financial ratios include net
profit margin, current ratio, return on capital employed, efficiency ratio, average receivables
days and average payable days. In this way, based on the above mentioned analysis, this
report ends with a well-drawn inference as well as recommendations for the potential
investors.
FINANCIAL MANAGEMENT
2
Contents
Financial Management: Tesco...................................................................................................3
Introduction................................................................................................................................3
Economic factors analysis..........................................................................................................3
Ratio analysis for three years (2017-2019)................................................................................6
Accounting ratios in business.................................................................................................6
Implications of financial ratio analysis......................................................................................8
I. Return on capital employed (ROCE)..................................................................................8
II. Net profit margin...............................................................................................................8
III. Current ratio.....................................................................................................................9
IV. Debtors collection period...............................................................................................10
V. Creditors payment period................................................................................................11
VI. efficiency ratios..............................................................................................................11
Future Recommendations.........................................................................................................12
Conclusion................................................................................................................................12
References................................................................................................................................14
⊘ This is a preview!⊘
Do you want full access?
Subscribe today to unlock all pages.
Trusted by 1+ million students worldwide
FINANCIAL MANAGEMENT
3
Financial Management: Tesco
Introduction
The report is based on economic and financial management of an organization based in
United Kingdom. The paper is going to introduce how economics is associated with business
of the firm. In doing so, the paper has used a well-known organization as Tesco Plc. Which is
consistently doing great in the relevant industry. In addition, the discussion will also contain
some key economic factors include macro and micro factors so that their impacts on business
can be analysed. In this context, different curves will be used for exploring how economic
factors affect business of Tesco Plc (Tesco, 2020). Furthermore, the report will include an
analysis of economic factors and thereby discuss their impacts on the chosen business. Later
then, ratio analysis for Tesco Plc. will be done and based on that implications of financial
ratio analysis will be presented. Apart from this, this paper will suggest some useful future
recommendations along with concise summary.
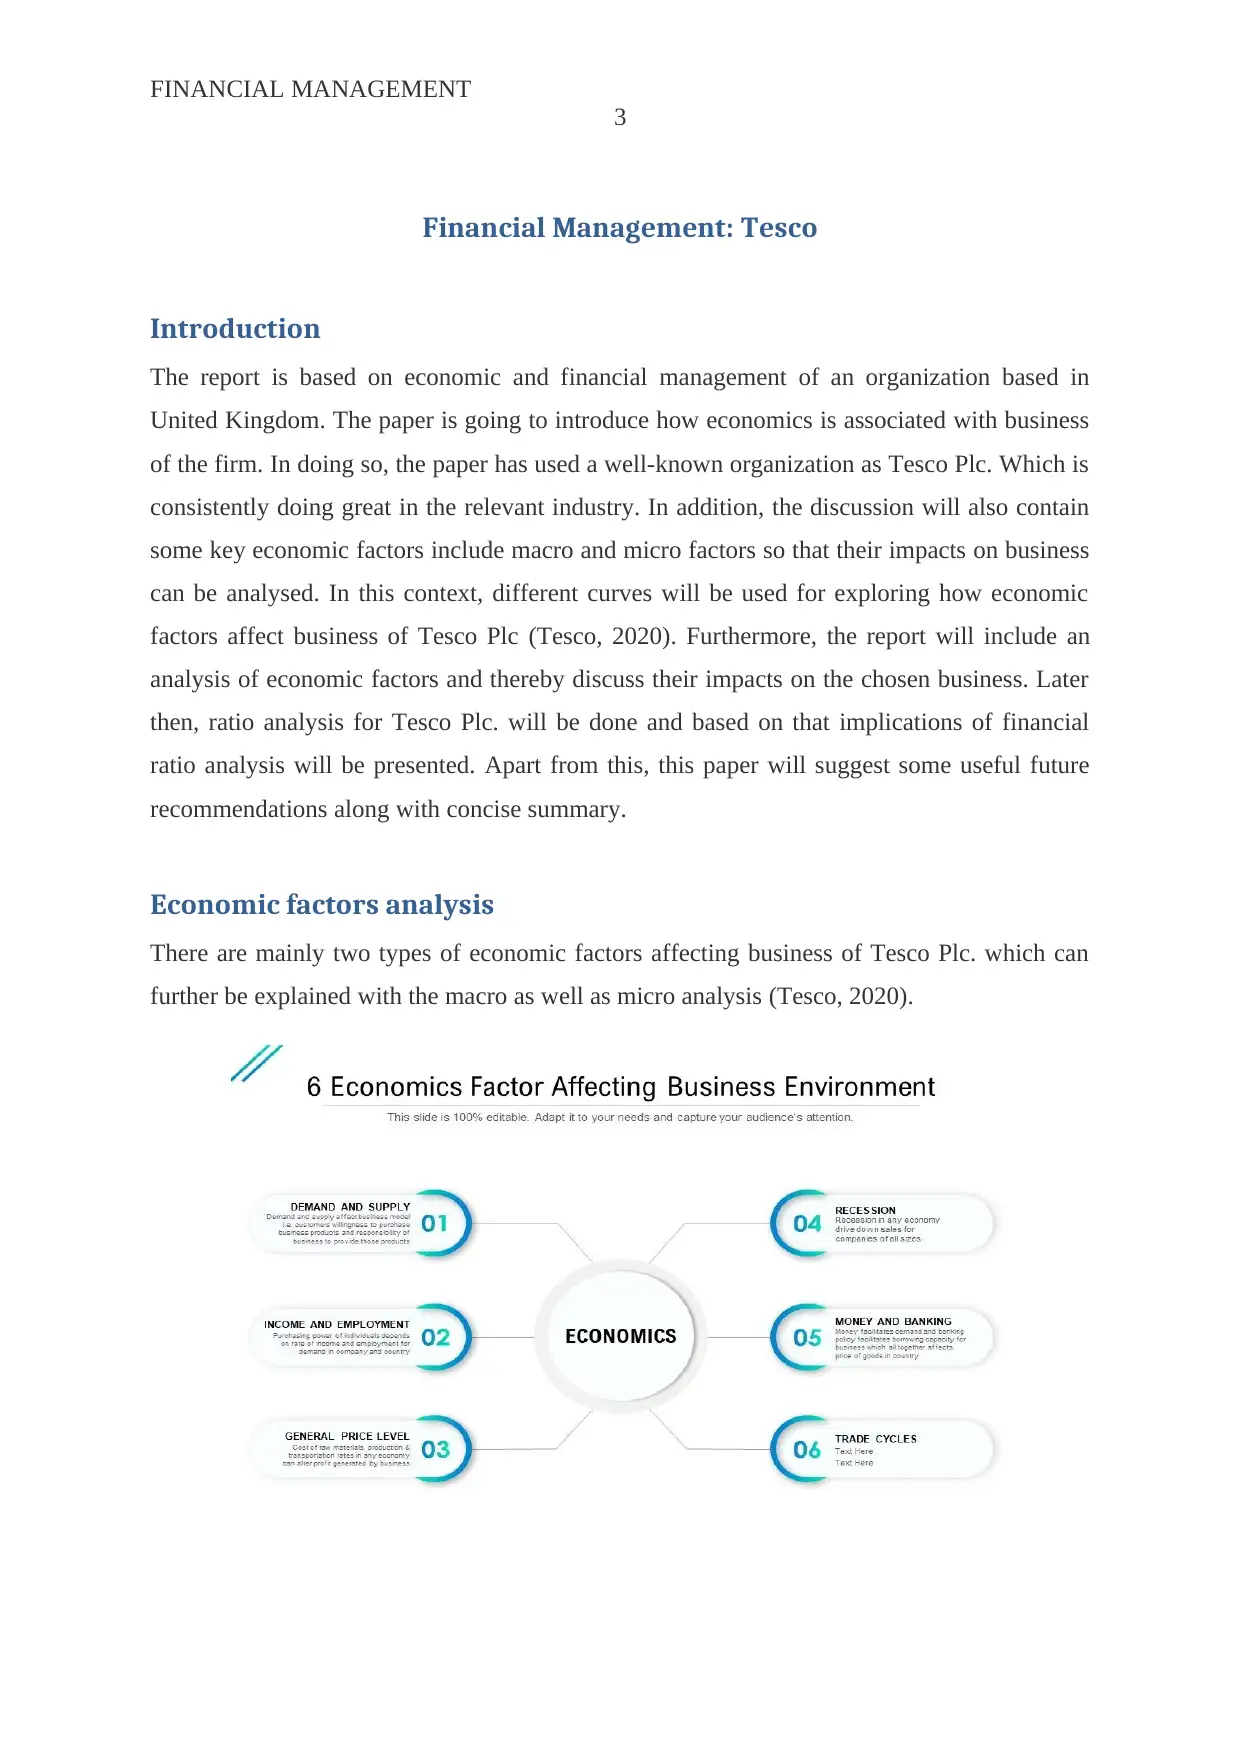
Economic factors analysis
There are mainly two types of economic factors affecting business of Tesco Plc. which can
further be explained with the macro as well as micro analysis (Tesco, 2020).
3
Financial Management: Tesco
Introduction
The report is based on economic and financial management of an organization based in
United Kingdom. The paper is going to introduce how economics is associated with business
of the firm. In doing so, the paper has used a well-known organization as Tesco Plc. Which is
consistently doing great in the relevant industry. In addition, the discussion will also contain
some key economic factors include macro and micro factors so that their impacts on business
can be analysed. In this context, different curves will be used for exploring how economic
factors affect business of Tesco Plc (Tesco, 2020). Furthermore, the report will include an
analysis of economic factors and thereby discuss their impacts on the chosen business. Later
then, ratio analysis for Tesco Plc. will be done and based on that implications of financial
ratio analysis will be presented. Apart from this, this paper will suggest some useful future
recommendations along with concise summary.
Economic factors analysis
There are mainly two types of economic factors affecting business of Tesco Plc. which can
further be explained with the macro as well as micro analysis (Tesco, 2020).
Paraphrase This Document
Need a fresh take? Get an instant paraphrase of this document with our AI Paraphraser

FINANCIAL MANAGEMENT
4
Source: (Anum, 2018)
In this context, macro analysis contains several macro factors include polictical, technology,
economic and sociocultural, and all of these factors considerably affect business of Tesco Plc.
Here, sociocultural factors impact business because Tesco is currently looking into so many
factors in order to satisfy their consumers’ tastes as well as needs. In the context Tesco’s
business is growing constantly as the company is producing healthy as well as organic food
for meeting the demands of the people who are actually concerned about physical and mental
well-being. Later then, economic factors which commonly impact business of Tesco are
consumer behaviour, interest rates, employment factors, banking and inflation. Apart from
this, technological factors also comes under macro factors. The chosen company is using
modern technologies into so many ways for further making shopping easier as well as much
convenient to the consumers. For example, Tesco is using technological means like online
shopping, home delivery, electronic shelf labelling, self check points, and club cards so that
technology may affect the business positively. Moroever, from the politics viewpoint, Tesco
is having so many branches in 6 European nations so that the overall business performance
can be influences through the political as well as the economic system of every nation. In
addition, Tesco should also respond to changes into the legal frameworks, other regulations
as well as employement legislations.
FINANCIAL MANAGEMENT
5
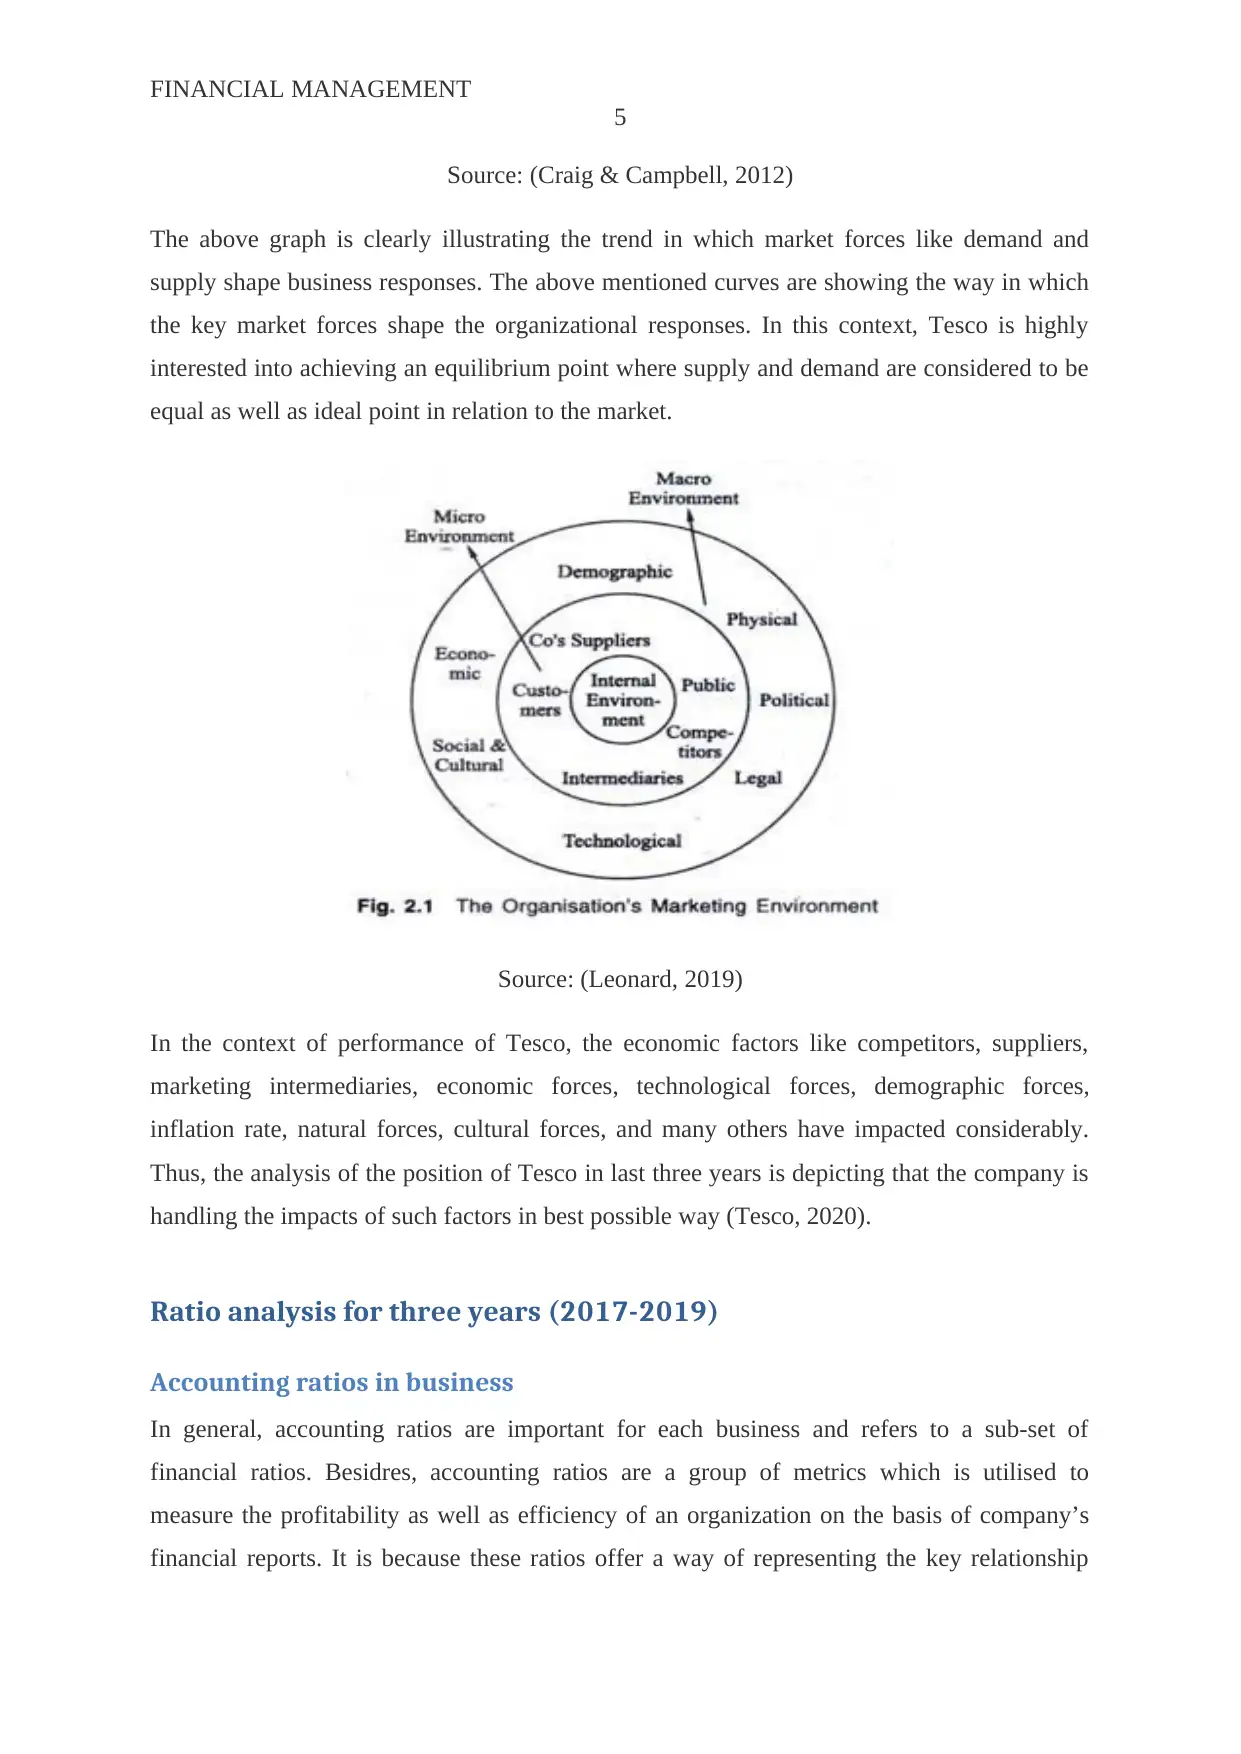
Source: (Craig & Campbell, 2012)
The above graph is clearly illustrating the trend in which market forces like demand and
supply shape business responses. The above mentioned curves are showing the way in which
the key market forces shape the organizational responses. In this context, Tesco is highly
interested into achieving an equilibrium point where supply and demand are considered to be
equal as well as ideal point in relation to the market.
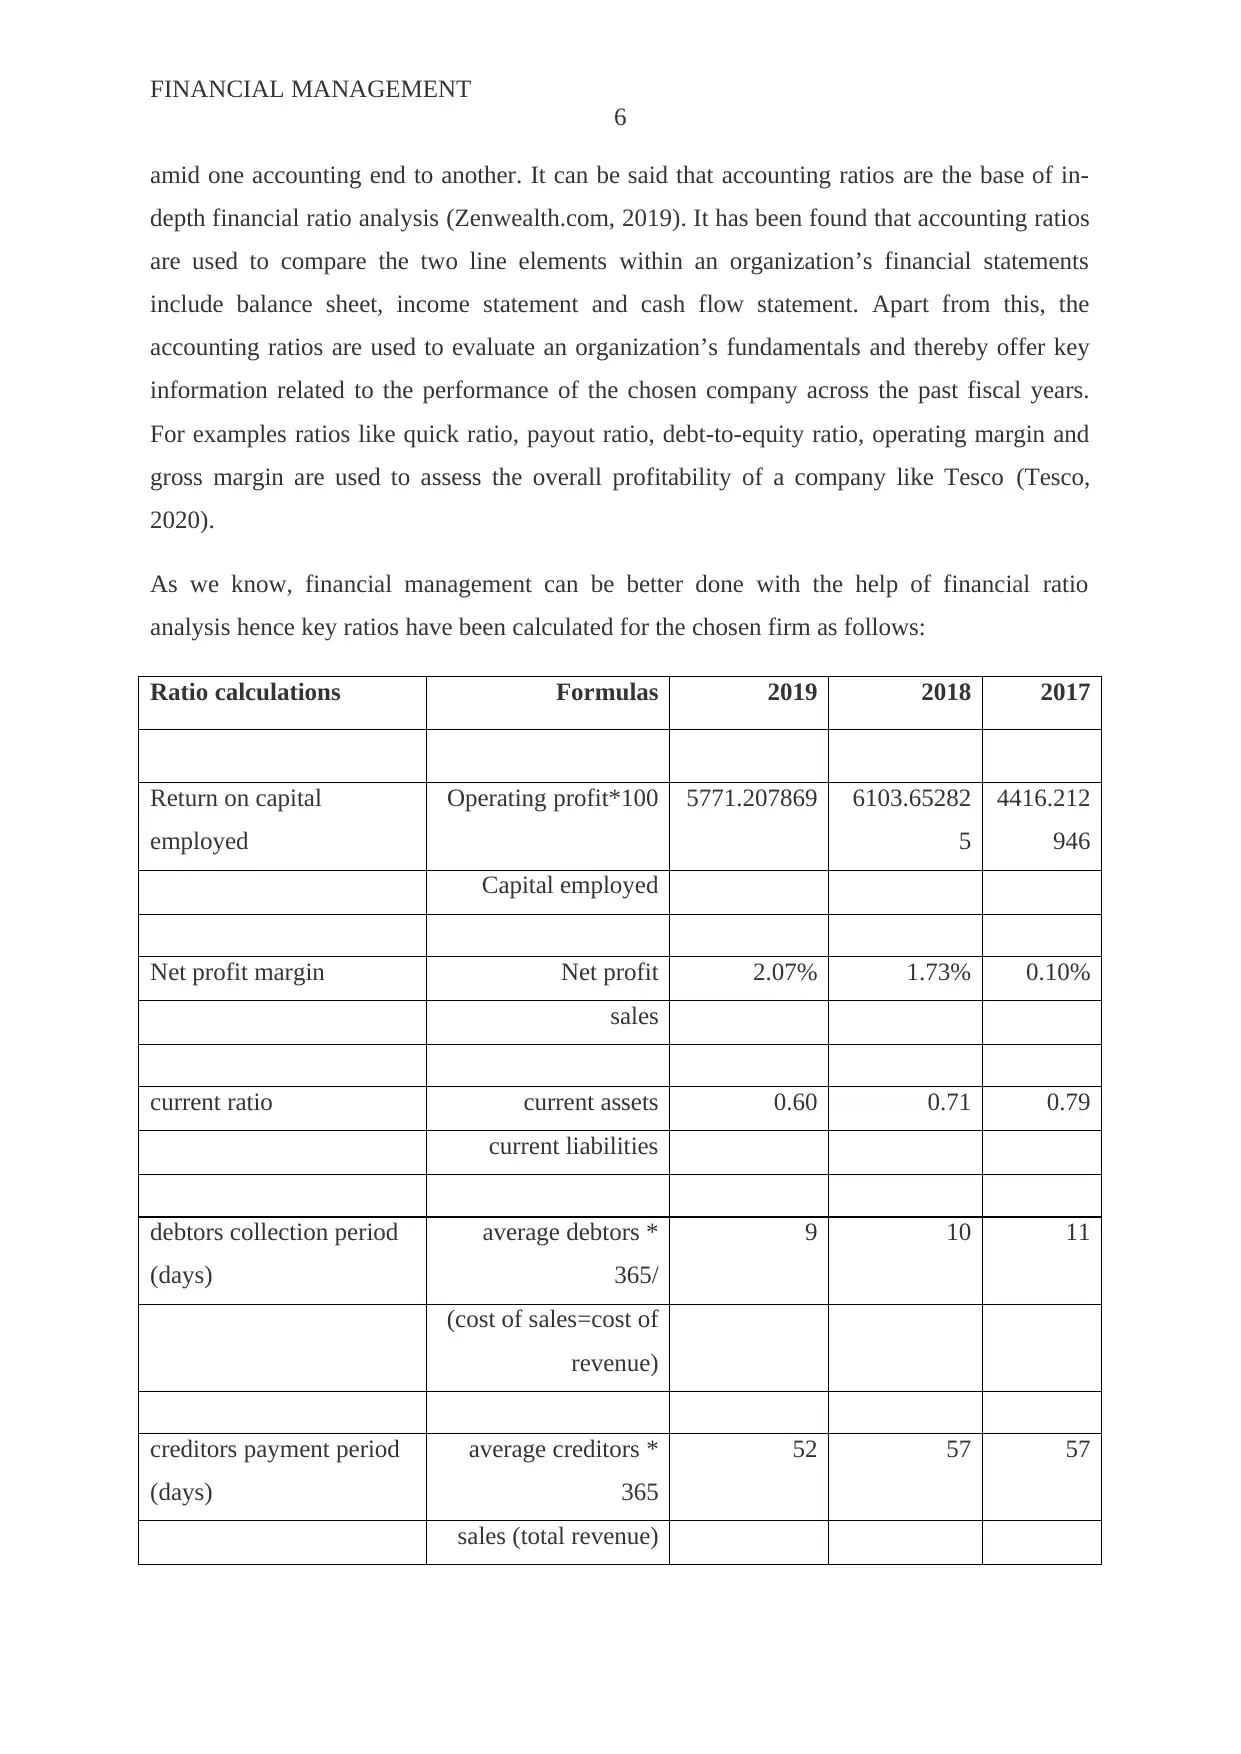
Source: (Leonard, 2019)
In the context of performance of Tesco, the economic factors like competitors, suppliers,
marketing intermediaries, economic forces, technological forces, demographic forces,
inflation rate, natural forces, cultural forces, and many others have impacted considerably.
Thus, the analysis of the position of Tesco in last three years is depicting that the company is
handling the impacts of such factors in best possible way (Tesco, 2020).
Ratio analysis for three years (2017-2019)
Accounting ratios in business
In general, accounting ratios are important for each business and refers to a sub-set of
financial ratios. Besidres, accounting ratios are a group of metrics which is utilised to
measure the profitability as well as efficiency of an organization on the basis of company’s
financial reports. It is because these ratios offer a way of representing the key relationship
5
Source: (Craig & Campbell, 2012)
The above graph is clearly illustrating the trend in which market forces like demand and
supply shape business responses. The above mentioned curves are showing the way in which
the key market forces shape the organizational responses. In this context, Tesco is highly
interested into achieving an equilibrium point where supply and demand are considered to be
equal as well as ideal point in relation to the market.
Source: (Leonard, 2019)
In the context of performance of Tesco, the economic factors like competitors, suppliers,
marketing intermediaries, economic forces, technological forces, demographic forces,
inflation rate, natural forces, cultural forces, and many others have impacted considerably.
Thus, the analysis of the position of Tesco in last three years is depicting that the company is
handling the impacts of such factors in best possible way (Tesco, 2020).
Ratio analysis for three years (2017-2019)
Accounting ratios in business
In general, accounting ratios are important for each business and refers to a sub-set of
financial ratios. Besidres, accounting ratios are a group of metrics which is utilised to
measure the profitability as well as efficiency of an organization on the basis of company’s
financial reports. It is because these ratios offer a way of representing the key relationship
⊘ This is a preview!⊘
Do you want full access?
Subscribe today to unlock all pages.
Trusted by 1+ million students worldwide
FINANCIAL MANAGEMENT
6
amid one accounting end to another. It can be said that accounting ratios are the base of in-
depth financial ratio analysis (Zenwealth.com, 2019). It has been found that accounting ratios
are used to compare the two line elements within an organization’s financial statements
include balance sheet, income statement and cash flow statement. Apart from this, the
accounting ratios are used to evaluate an organization’s fundamentals and thereby offer key
information related to the performance of the chosen company across the past fiscal years.
For examples ratios like quick ratio, payout ratio, debt-to-equity ratio, operating margin and
gross margin are used to assess the overall profitability of a company like Tesco (Tesco,
2020).
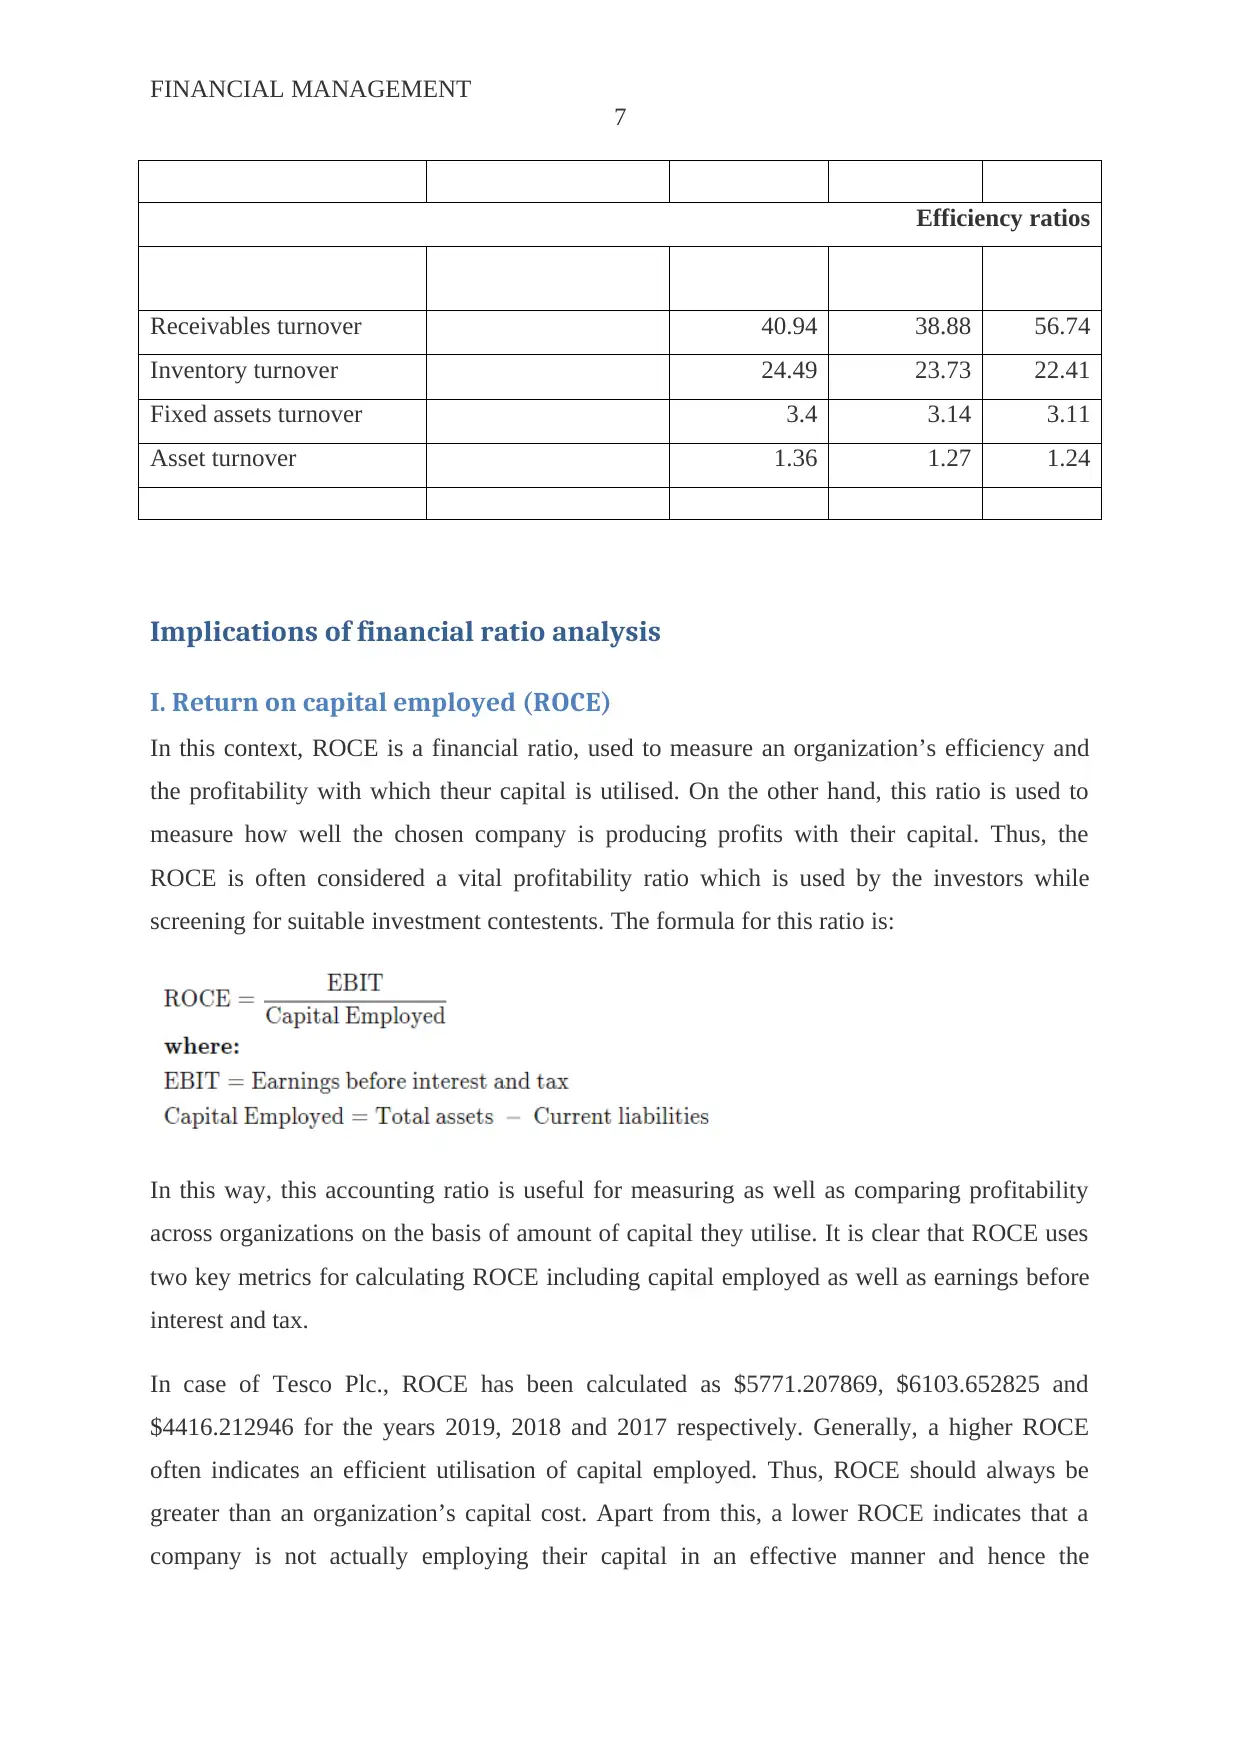
As we know, financial management can be better done with the help of financial ratio
analysis hence key ratios have been calculated for the chosen firm as follows:
Ratio calculations Formulas 2019 2018 2017
Return on capital
employed
Operating profit*100 5771.207869 6103.65282
5
4416.212
946
Capital employed
Net profit margin Net profit 2.07% 1.73% 0.10%
sales
current ratio current assets 0.60 0.71 0.79
current liabilities
debtors collection period
(days)
average debtors *
365/
9 10 11
(cost of sales=cost of
revenue)
creditors payment period
(days)
average creditors *
365
52 57 57
sales (total revenue)
6
amid one accounting end to another. It can be said that accounting ratios are the base of in-
depth financial ratio analysis (Zenwealth.com, 2019). It has been found that accounting ratios
are used to compare the two line elements within an organization’s financial statements
include balance sheet, income statement and cash flow statement. Apart from this, the
accounting ratios are used to evaluate an organization’s fundamentals and thereby offer key
information related to the performance of the chosen company across the past fiscal years.
For examples ratios like quick ratio, payout ratio, debt-to-equity ratio, operating margin and
gross margin are used to assess the overall profitability of a company like Tesco (Tesco,
2020).
As we know, financial management can be better done with the help of financial ratio
analysis hence key ratios have been calculated for the chosen firm as follows:
Ratio calculations Formulas 2019 2018 2017
Return on capital
employed
Operating profit*100 5771.207869 6103.65282
5
4416.212
946
Capital employed
Net profit margin Net profit 2.07% 1.73% 0.10%
sales
current ratio current assets 0.60 0.71 0.79
current liabilities
debtors collection period
(days)
average debtors *
365/
9 10 11
(cost of sales=cost of
revenue)
creditors payment period
(days)
average creditors *
365
52 57 57
sales (total revenue)
Paraphrase This Document
Need a fresh take? Get an instant paraphrase of this document with our AI Paraphraser
FINANCIAL MANAGEMENT
7
Efficiency ratios
Receivables turnover 40.94 38.88 56.74
Inventory turnover 24.49 23.73 22.41
Fixed assets turnover 3.4 3.14 3.11
Asset turnover 1.36 1.27 1.24
Implications of financial ratio analysis
I. Return on capital employed (ROCE)
In this context, ROCE is a financial ratio, used to measure an organization’s efficiency and
the profitability with which theur capital is utilised. On the other hand, this ratio is used to
measure how well the chosen company is producing profits with their capital. Thus, the
ROCE is often considered a vital profitability ratio which is used by the investors while
screening for suitable investment contestents. The formula for this ratio is:
In this way, this accounting ratio is useful for measuring as well as comparing profitability
across organizations on the basis of amount of capital they utilise. It is clear that ROCE uses
two key metrics for calculating ROCE including capital employed as well as earnings before
interest and tax.
In case of Tesco Plc., ROCE has been calculated as $5771.207869, $6103.652825 and
$4416.212946 for the years 2019, 2018 and 2017 respectively. Generally, a higher ROCE
often indicates an efficient utilisation of capital employed. Thus, ROCE should always be
greater than an organization’s capital cost. Apart from this, a lower ROCE indicates that a
company is not actually employing their capital in an effective manner and hence the
FINANCIAL MANAGEMENT
8
company is not producing shareholder values. Thus, ROCE has been increased for Tesco in
the year 2018 as compared to 2017 which is great however the ROCE is decresed in 2019 as
compared to 2018 which is ultimately showing that company should focus on effective use of
their available capital so that earnings can be maximised.
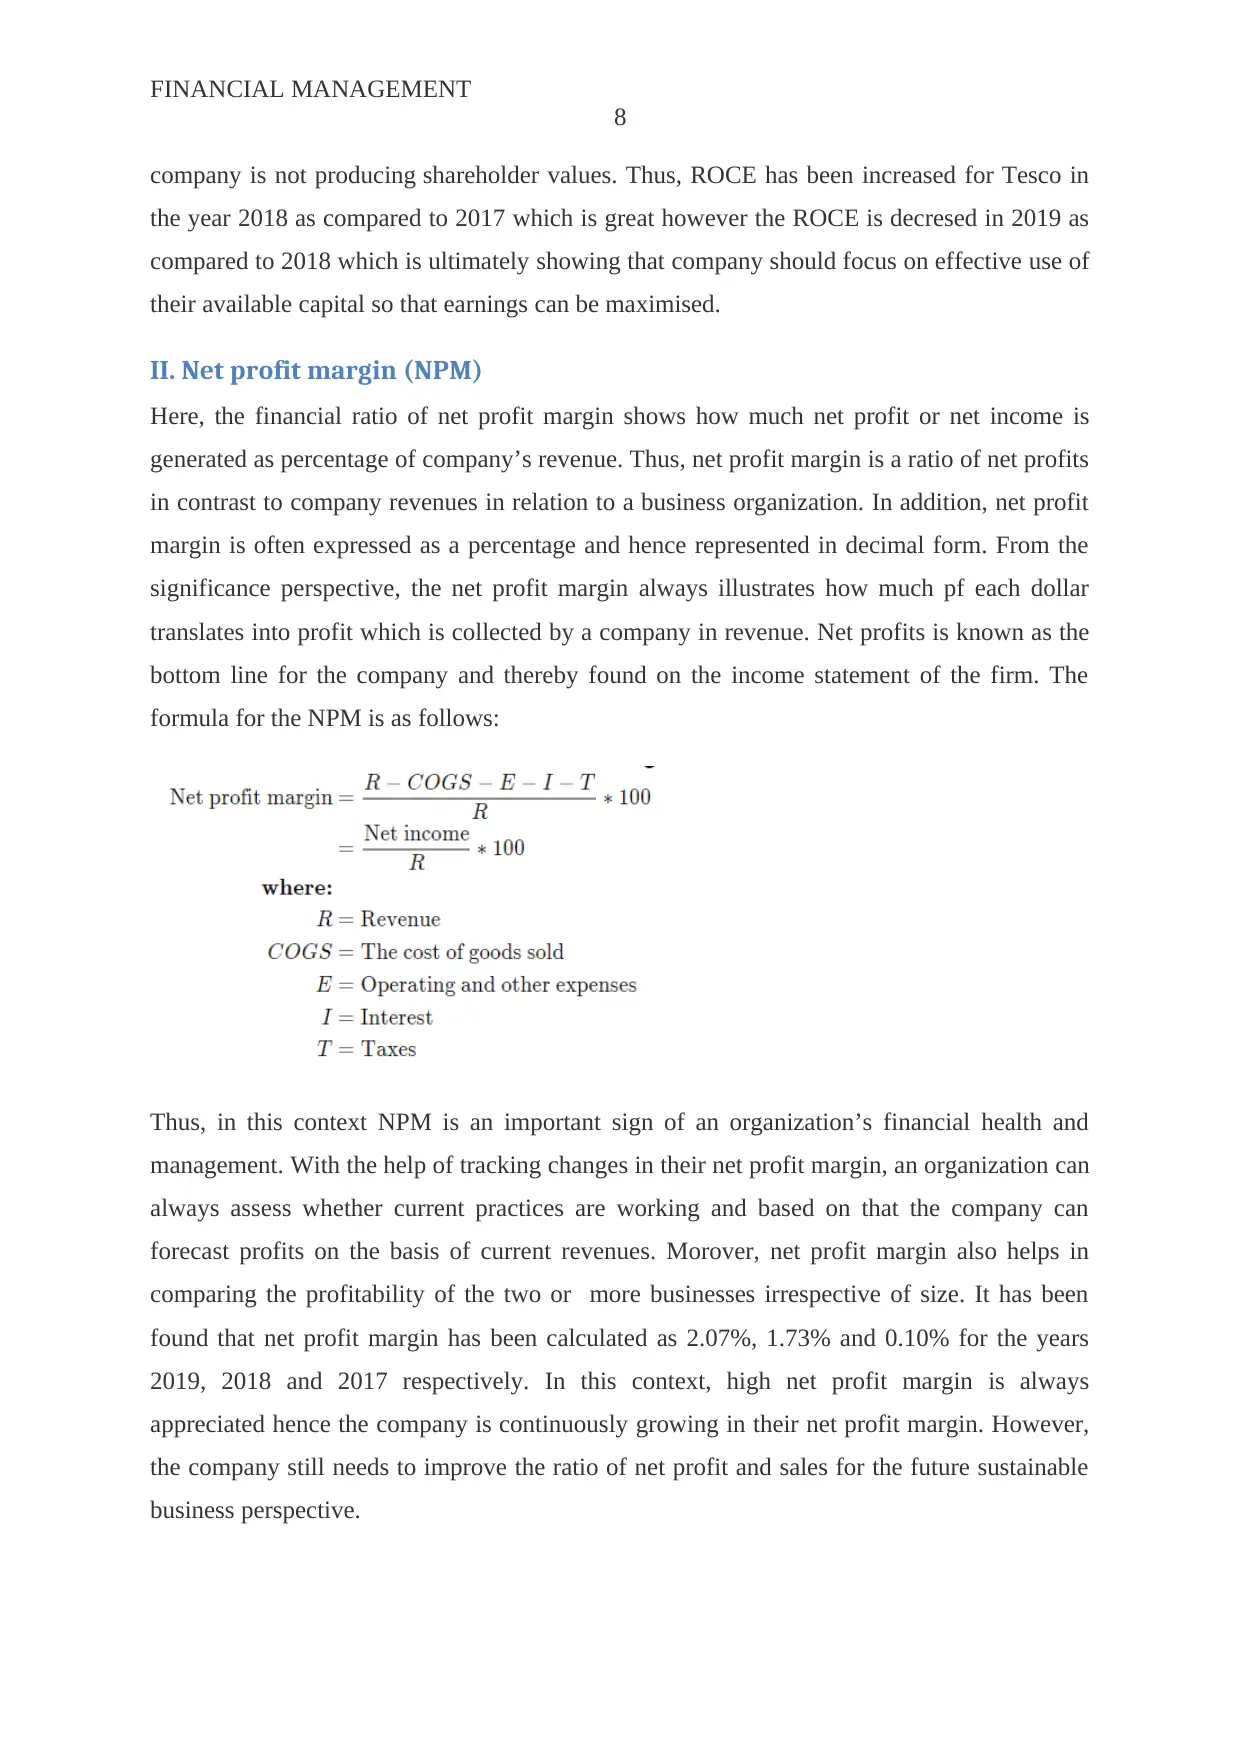
II. Net profit margin (NPM)
Here, the financial ratio of net profit margin shows how much net profit or net income is
generated as percentage of company’s revenue. Thus, net profit margin is a ratio of net profits
in contrast to company revenues in relation to a business organization. In addition, net profit
margin is often expressed as a percentage and hence represented in decimal form. From the
significance perspective, the net profit margin always illustrates how much pf each dollar
translates into profit which is collected by a company in revenue. Net profits is known as the
bottom line for the company and thereby found on the income statement of the firm. The
formula for the NPM is as follows:
Thus, in this context NPM is an important sign of an organization’s financial health and
management. With the help of tracking changes in their net profit margin, an organization can
always assess whether current practices are working and based on that the company can
forecast profits on the basis of current revenues. Morover, net profit margin also helps in
comparing the profitability of the two or more businesses irrespective of size. It has been
found that net profit margin has been calculated as 2.07%, 1.73% and 0.10% for the years
2019, 2018 and 2017 respectively. In this context, high net profit margin is always
appreciated hence the company is continuously growing in their net profit margin. However,
the company still needs to improve the ratio of net profit and sales for the future sustainable
business perspective.
8
company is not producing shareholder values. Thus, ROCE has been increased for Tesco in
the year 2018 as compared to 2017 which is great however the ROCE is decresed in 2019 as
compared to 2018 which is ultimately showing that company should focus on effective use of
their available capital so that earnings can be maximised.
II. Net profit margin (NPM)
Here, the financial ratio of net profit margin shows how much net profit or net income is
generated as percentage of company’s revenue. Thus, net profit margin is a ratio of net profits
in contrast to company revenues in relation to a business organization. In addition, net profit
margin is often expressed as a percentage and hence represented in decimal form. From the
significance perspective, the net profit margin always illustrates how much pf each dollar
translates into profit which is collected by a company in revenue. Net profits is known as the
bottom line for the company and thereby found on the income statement of the firm. The
formula for the NPM is as follows:
Thus, in this context NPM is an important sign of an organization’s financial health and
management. With the help of tracking changes in their net profit margin, an organization can
always assess whether current practices are working and based on that the company can
forecast profits on the basis of current revenues. Morover, net profit margin also helps in
comparing the profitability of the two or more businesses irrespective of size. It has been
found that net profit margin has been calculated as 2.07%, 1.73% and 0.10% for the years
2019, 2018 and 2017 respectively. In this context, high net profit margin is always
appreciated hence the company is continuously growing in their net profit margin. However,
the company still needs to improve the ratio of net profit and sales for the future sustainable
business perspective.
⊘ This is a preview!⊘
Do you want full access?
Subscribe today to unlock all pages.
Trusted by 1+ million students worldwide
FINANCIAL MANAGEMENT
9
III. Current ratio
In this context, current ratio is known as a liquidity ratio which is used to measure a
company’s capability to pay short-term liabilities as well as obligations within a single year.
It is useful while knowing how the company can maximize their current assets on balance
sheet for satisfying their current debt as well as rest payables from the both analyst and
investor perspectives. While calculating current ratio, company’s current assets as well as
current liabilities are considered and thereby current ratio is calculated. Here, current assets
are inventory, cash, accounts receivables and many more which are encashable in less than
one year. Besides, current liabilities are wages, accounts payable, taxes payable, and many
more. The formula of current ratio is as explained below:
This ratio is known as current as it considers current liabilities and assets. In other words, this
ratio is termed as working capital ratio. In this context, current ratio os Tesco for the years
2019, 2018 and 2017 has been calculated as 0.60, 0.71 and 0.79. It is clear that current ratio is
continuously decreasing during past few fiscal years (Zenwealth.com, 2019). From the
perspective of sustainability in business development, current ratio should be high and greater
than 1 atleast. However, in case of Tesco the ratio is less than one which shows that overall
current assets are less than current liabilities of Tesco Plc. Thus, the company is not using
their capital efficiently hence their current assets are less than current liabilities which is nit
quite appreciable (Tesco, 2020). In this way, the implication and interpretation of current
ratio for Tesco is indicating that company needs to enhance and expand their current assets as
compared to their current liabilities which will improve their overall financial health in the
long-term (Zenwealth.com, 2019).
IV. Debtors collection period
Generally, in accounting, the debtor collection period always indicate the total average time
taken to accumulate trade debts. It means when debtors collection period is less then it is
good. It is because reduced period of debtors collection period denotes that efficiency of the
chosen business is high (Clayman et al., 2012). In addition to that, less debtors collection
period also allows the firm to compare the real collection time with theoretical credit period.
The formula of the same is as follows:
Paraphrase This Document
Need a fresh take? Get an instant paraphrase of this document with our AI Paraphraser
FINANCIAL MANAGEMENT
10
Debtors collection period = Debtors / sales Turnover * 365
Thus, a debotor collection period of 9 days, 10 days and 11 days has been calculated for
Tesco for the years 2019, 2018 and 2017 respectively. It means the company Tesco is
continuously decresing their debtors collection period. Hence, this shows that Tesco is
effectively collecting money or capital which is owed by their debtors. In this context, the
reduced debtors period depicts that overall progress as well as efficiency is enhanced
considerably. The trend is found good in case of Tesco Plc. however it is not very impressive
which means the firm needs to further lowering their debtors collection period more
(Abuzayan et al., 2014).
V. Creditors payment period
While calculating accounting ratios, creditors payment period is very important for assessing
the viability of any business. It is also known as payables turnover ratio and hence measured
in terms of days. Morover, creditors payment period is a term which often indicates the total
time into which the company can settle out their payables. Here, it is used to measure the
number of days that it takes a company, on average, to pay creditors. In this way, a
higher ratio shows credit worthiness and is sought after by creditors (Sassi & Goaied, 2013).
In this case, creditors payment period has been calculated as 52 days, 57 days and 57 days for
the years between 2017-2019. It means there is no such big difference between the period
across these three years. The high value of this ratio denotes the company’s creditworthiness
which means company is trustworthy in front of creditors and other investors. In this way, the
ratio is in good condition however it should be improved with management strategies and
financial management (Craig & Campbell, 2012).
VI. efficiency ratios
In general, efficiency ratio in economic and financial management often denotes the expenses
of the company as a % of total revenue of the company. There are some key variations In this
report and financial analysis, four efficiency ratios have been calculated as asset turnover,
fixed assets turnover, inventory turnover and receivables turnover ratio. Firstly, asset turnover
ratio indicates Tesco's efficiency while utilising its assets as well as generating sales revenue.
In this way, this efficiency ratio used to calculate the total sales for every dollar of assets
Tesco owns. Therefore, it can be said that a higher number is an indication of the Tesco’s
better performance. The calculated values for the three years are 1.36, 1.27 and 1.24.
FINANCIAL MANAGEMENT
11
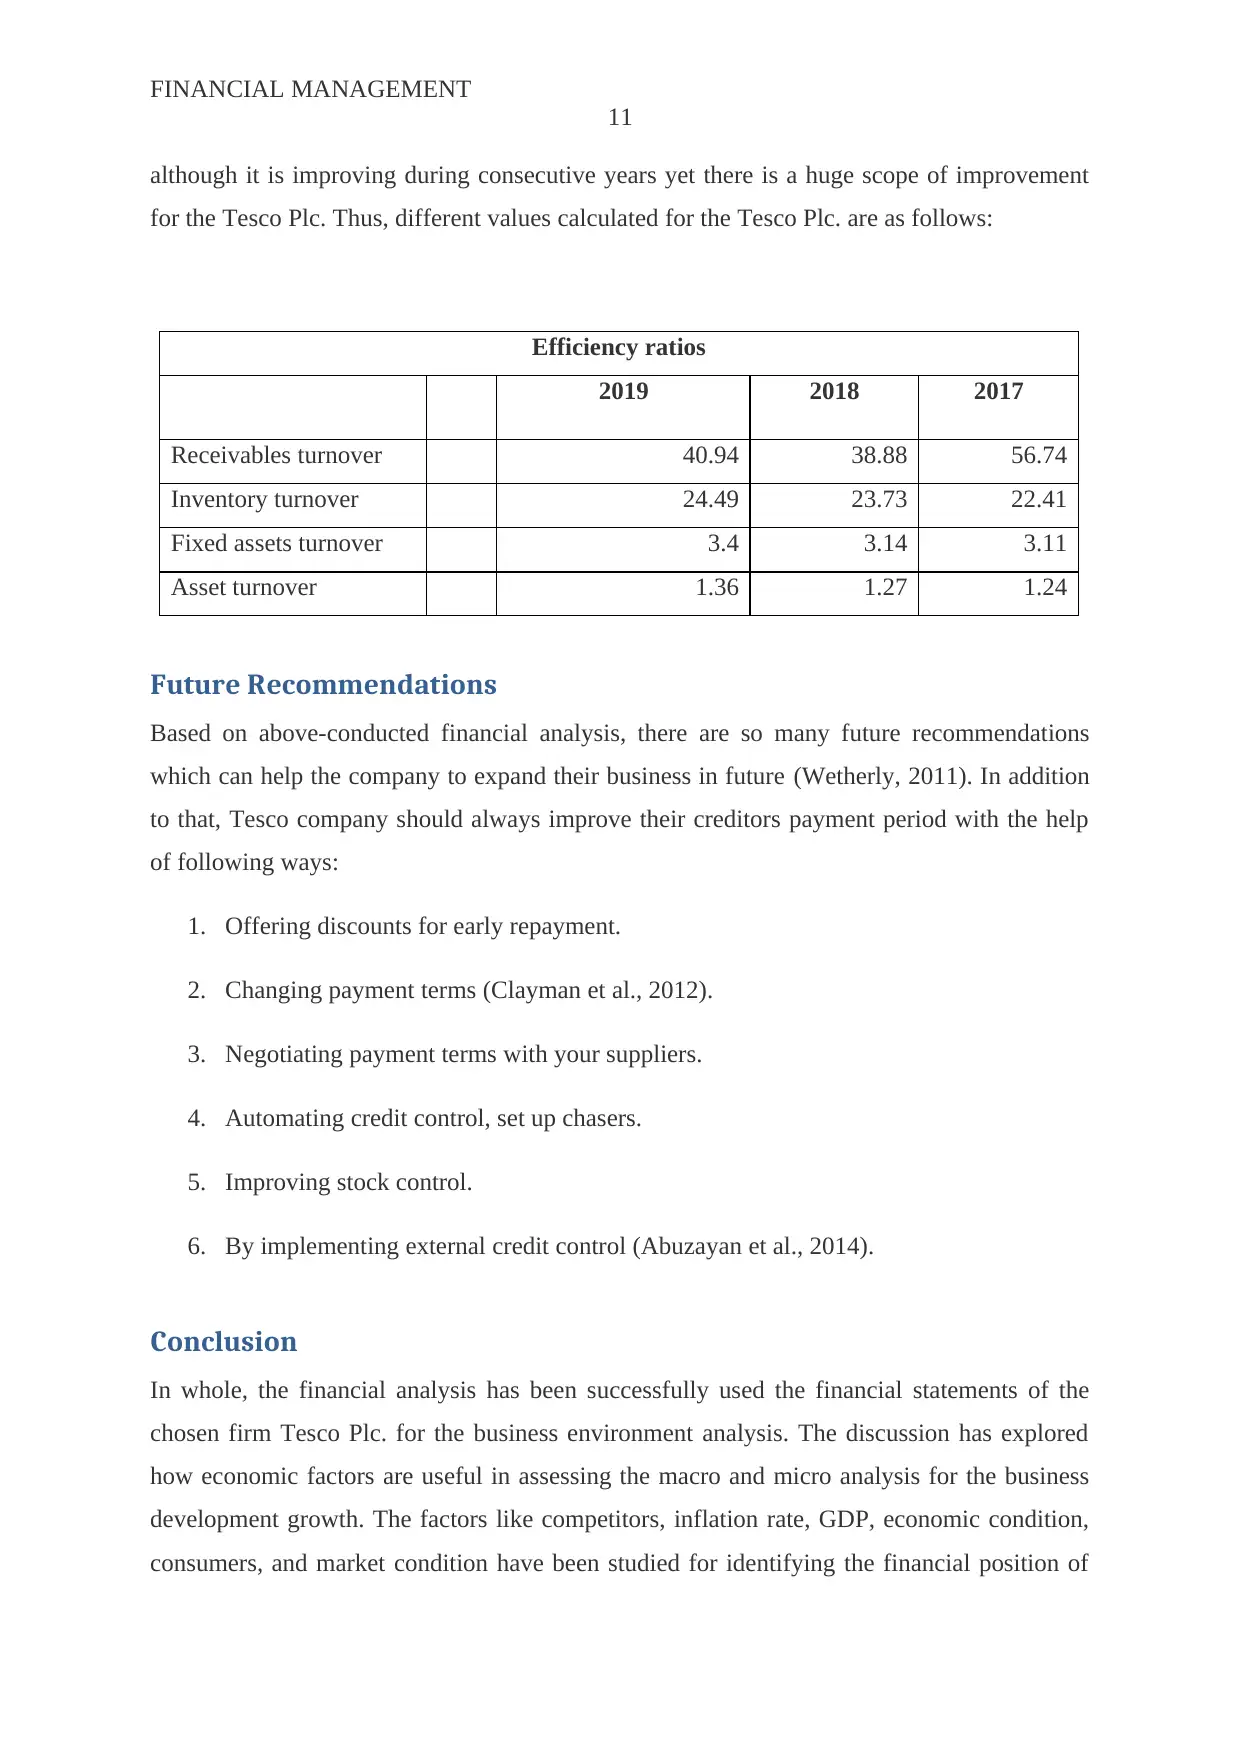
although it is improving during consecutive years yet there is a huge scope of improvement
for the Tesco Plc. Thus, different values calculated for the Tesco Plc. are as follows:
Efficiency ratios
2019 2018 2017
Receivables turnover 40.94 38.88 56.74
Inventory turnover 24.49 23.73 22.41
Fixed assets turnover 3.4 3.14 3.11
Asset turnover 1.36 1.27 1.24
Future Recommendations
Based on above-conducted financial analysis, there are so many future recommendations
which can help the company to expand their business in future (Wetherly, 2011). In addition
to that, Tesco company should always improve their creditors payment period with the help
of following ways:
1. Offering discounts for early repayment.
2. Changing payment terms (Clayman et al., 2012).
3. Negotiating payment terms with your suppliers.
4. Automating credit control, set up chasers.
5. Improving stock control.
6. By implementing external credit control (Abuzayan et al., 2014).
Conclusion
In whole, the financial analysis has been successfully used the financial statements of the
chosen firm Tesco Plc. for the business environment analysis. The discussion has explored
how economic factors are useful in assessing the macro and micro analysis for the business
development growth. The factors like competitors, inflation rate, GDP, economic condition,
consumers, and market condition have been studied for identifying the financial position of
11
although it is improving during consecutive years yet there is a huge scope of improvement
for the Tesco Plc. Thus, different values calculated for the Tesco Plc. are as follows:
Efficiency ratios
2019 2018 2017
Receivables turnover 40.94 38.88 56.74
Inventory turnover 24.49 23.73 22.41
Fixed assets turnover 3.4 3.14 3.11
Asset turnover 1.36 1.27 1.24
Future Recommendations
Based on above-conducted financial analysis, there are so many future recommendations
which can help the company to expand their business in future (Wetherly, 2011). In addition
to that, Tesco company should always improve their creditors payment period with the help
of following ways:
1. Offering discounts for early repayment.
2. Changing payment terms (Clayman et al., 2012).
3. Negotiating payment terms with your suppliers.
4. Automating credit control, set up chasers.
5. Improving stock control.
6. By implementing external credit control (Abuzayan et al., 2014).
Conclusion
In whole, the financial analysis has been successfully used the financial statements of the
chosen firm Tesco Plc. for the business environment analysis. The discussion has explored
how economic factors are useful in assessing the macro and micro analysis for the business
development growth. The factors like competitors, inflation rate, GDP, economic condition,
consumers, and market condition have been studied for identifying the financial position of
⊘ This is a preview!⊘
Do you want full access?
Subscribe today to unlock all pages.
Trusted by 1+ million students worldwide
1 out of 16
Related Documents


Your All-in-One AI-Powered Toolkit for Academic Success.
+13062052269
info@desklib.com
Available 24*7 on WhatsApp / Email
![[object Object]](/_next/static/media/star-bottom.7253800d.svg)
Unlock your academic potential
Copyright © 2020–2026 A2Z Services. All Rights Reserved. Developed and managed by ZUCOL.