Financial Management and Analysis
Added on 2022-12-17
16 Pages3639 Words23 Views
FINANCIAL MANAGEMENT AND ANALYSIS

Table of Content
INTRODUCTION ..........................................................................................................................4
TASK 1............................................................................................................................................5
2. Limitation of ratio analysis.....................................................................................................7
3. Recommendations...................................................................................................................7
TASK 2............................................................................................................................................7
a. Payback period .......................................................................................................................7
b. Assessment of NPV ................................................................................................................8
c. Computation of IRR................................................................................................................9
d. Recommending the best choice out of several alternatives available by applying investment
appraisal tools............................................................................................................................10
TASK 3..........................................................................................................................................10
a) Theoretical ex-rights price of Dusseldorf plc.......................................................................10
b) Values of rights attached to each existing share...................................................................10
c) Effect on wealth of Lukas.....................................................................................................11
TASK 4..........................................................................................................................................12
a) value of Amsterdam plc through market capitalization........................................................12
B) value of Amsterdam plc using the net asset value...............................................................12
c) Value through Price earnings ratio........................................................................................12
d) average historic dividend growth rate ..................................................................................13
e) Advise...................................................................................................................................13
TASK 5..........................................................................................................................................13
CONCLUSION..............................................................................................................................15
REFRENCES.................................................................................................................................16
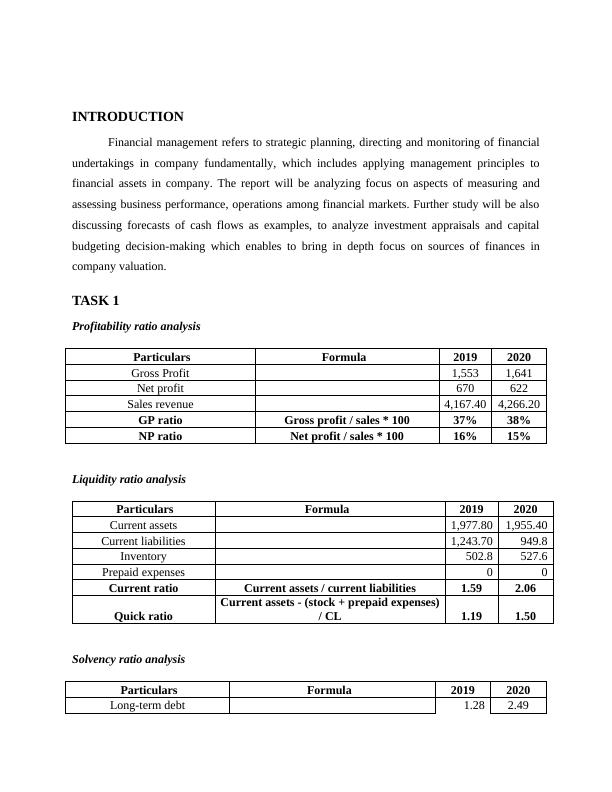
INTRODUCTION
Financial management refers to strategic planning, directing and monitoring of financial
undertakings in company fundamentally, which includes applying management principles to
financial assets in company. The report will be analyzing focus on aspects of measuring and
assessing business performance, operations among financial markets. Further study will be also
discussing forecasts of cash flows as examples, to analyze investment appraisals and capital
budgeting decision-making which enables to bring in depth focus on sources of finances in
company valuation.
TASK 1
Profitability ratio analysis
Particulars Formula 2019 2020
Gross Profit 1,553 1,641
Net profit 670 622
Sales revenue 4,167.40 4,266.20
GP ratio Gross profit / sales * 100 37% 38%
NP ratio Net profit / sales * 100 16% 15%
Liquidity ratio analysis
Particulars Formula 2019 2020
Current assets 1,977.80 1,955.40
Current liabilities 1,243.70 949.8
Inventory 502.8 527.6
Prepaid expenses 0 0
Current ratio Current assets / current liabilities 1.59 2.06
Quick ratio
Current assets - (stock + prepaid expenses)
/ CL 1.19 1.50
Solvency ratio analysis
Particulars Formula 2019 2020
Long-term debt 1.28 2.49
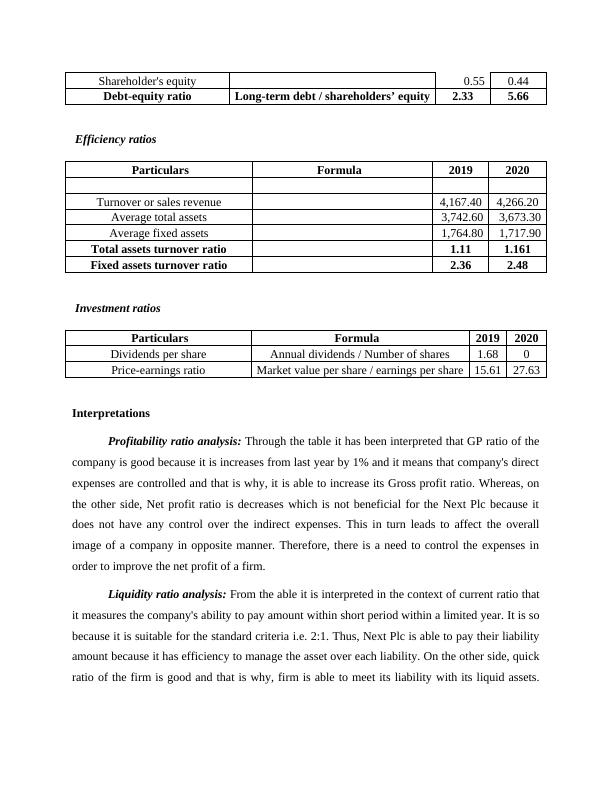
Shareholder's equity 0.55 0.44
Debt-equity ratio Long-term debt / shareholders’ equity 2.33 5.66
Efficiency ratios
Particulars Formula 2019 2020
Turnover or sales revenue 4,167.40 4,266.20
Average total assets 3,742.60 3,673.30
Average fixed assets 1,764.80 1,717.90
Total assets turnover ratio 1.11 1.161
Fixed assets turnover ratio 2.36 2.48
Investment ratios
Particulars Formula 2019 2020
Dividends per share Annual dividends / Number of shares 1.68 0
Price-earnings ratio Market value per share / earnings per share 15.61 27.63
Interpretations
Profitability ratio analysis: Through the table it has been interpreted that GP ratio of the
company is good because it is increases from last year by 1% and it means that company's direct
expenses are controlled and that is why, it is able to increase its Gross profit ratio. Whereas, on
the other side, Net profit ratio is decreases which is not beneficial for the Next Plc because it
does not have any control over the indirect expenses. This in turn leads to affect the overall
image of a company in opposite manner. Therefore, there is a need to control the expenses in
order to improve the net profit of a firm.
Liquidity ratio analysis: From the able it is interpreted in the context of current ratio that
it measures the company's ability to pay amount within short period within a limited year. It is so
because it is suitable for the standard criteria i.e. 2:1. Thus, Next Plc is able to pay their liability
amount because it has efficiency to manage the asset over each liability. On the other side, quick
ratio of the firm is good and that is why, firm is able to meet its liability with its liquid assets.
End of preview
Want to access all the pages? Upload your documents or become a member.
Related Documents
Financial Management and Analysislg...
|20
|4618
|1
Interpretation and Comparative Analysis of Financial Statements of Samsung PLClg...
|6
|1257
|75
Report | Comparison Of NEXT Plc & Morrison | Profitability, Liquiditylg...
|14
|2058
|80
Ratio Analysis of Tesco Plc for 2018-2019lg...
|15
|3290
|447
Cash Budget Analysis for Vivaldi Ltdlg...
|10
|2228
|77
Accounting Fundamentals: Financial Performance Analysis of Chocco plclg...
|16
|2338
|93