Financial Management and Control
Added on 2023-01-23
33 Pages7137 Words62 Views
Running Head: Financial Management and Control
FINANCIAL MANAGEMENT AND
CONTROL
STUDENT NAME
UNIVERSITY NAME
FINANCIAL MANAGEMENT AND
CONTROL
STUDENT NAME
UNIVERSITY NAME
Financial Management and Control
Contents
Part A..........................................................................................................................................................2
Introduction.............................................................................................................................................2
Evaluation of the financial performance of Bitmap plc on the basis of past two year’s financial
statements...............................................................................................................................................3
Asset utilisation:......................................................................................................................................9
Investor’s potential:...............................................................................................................................11
A brief evaluation of Bitmap plc’s working capital cycle........................................................................12
Conclusion:............................................................................................................................................14
Part B.........................................................................................................................................................15
Capital Budgeting Analysis:....................................................................................................................15
Cash-flow details:..............................................................................................................................15
1) The Payback Period...................................................................................................................17
2) The Discounted Payback Period................................................................................................18
3) The Accounting Rate of Return.................................................................................................19
4) The Net Present Value...............................................................................................................21
5) The Internal Rate of Return.......................................................................................................22
Evaluation of different investment appraisal techniques:.....................................................................23
Evaluation of two suitable sources of finance to fund this investment:................................................25
Part C.........................................................................................................................................................27
Budgeting..............................................................................................................................................27
Evaluation of the budgeting process and the interlinking of various budgets used within a business.. 28
References:................................................................................................................................................31
1
Financial Management and Control
Part A
Introduction
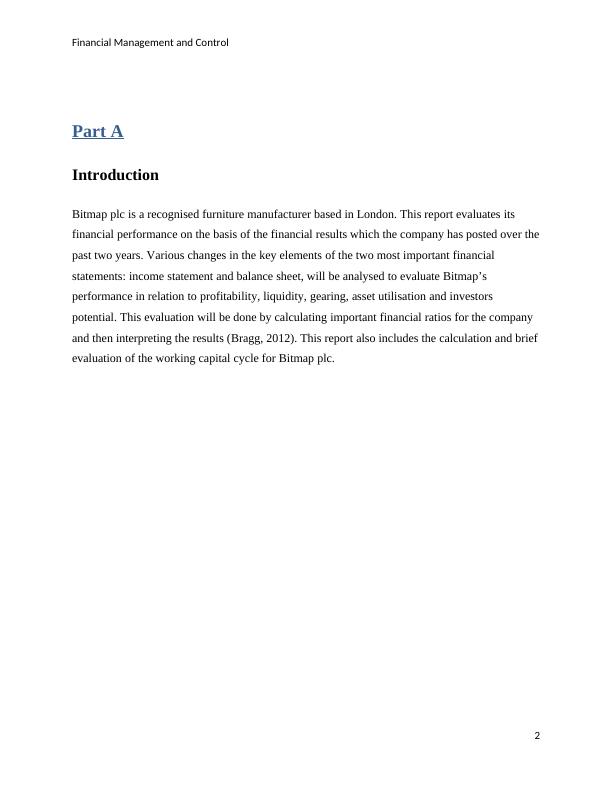
Bitmap plc is a recognised furniture manufacturer based in London. This report evaluates its
financial performance on the basis of the financial results which the company has posted over the
past two years. Various changes in the key elements of the two most important financial
statements: income statement and balance sheet, will be analysed to evaluate Bitmap’s
performance in relation to profitability, liquidity, gearing, asset utilisation and investors
potential. This evaluation will be done by calculating important financial ratios for the company
and then interpreting the results (Bragg, 2012). This report also includes the calculation and brief
evaluation of the working capital cycle for Bitmap plc.
2
Part A
Introduction
Bitmap plc is a recognised furniture manufacturer based in London. This report evaluates its
financial performance on the basis of the financial results which the company has posted over the
past two years. Various changes in the key elements of the two most important financial
statements: income statement and balance sheet, will be analysed to evaluate Bitmap’s
performance in relation to profitability, liquidity, gearing, asset utilisation and investors
potential. This evaluation will be done by calculating important financial ratios for the company
and then interpreting the results (Bragg, 2012). This report also includes the calculation and brief
evaluation of the working capital cycle for Bitmap plc.
2
Financial Management and Control
Evaluation of the financial performance of Bitmap plc on the basis
of past two year’s financial statements
Bitmap plc’s financial statements
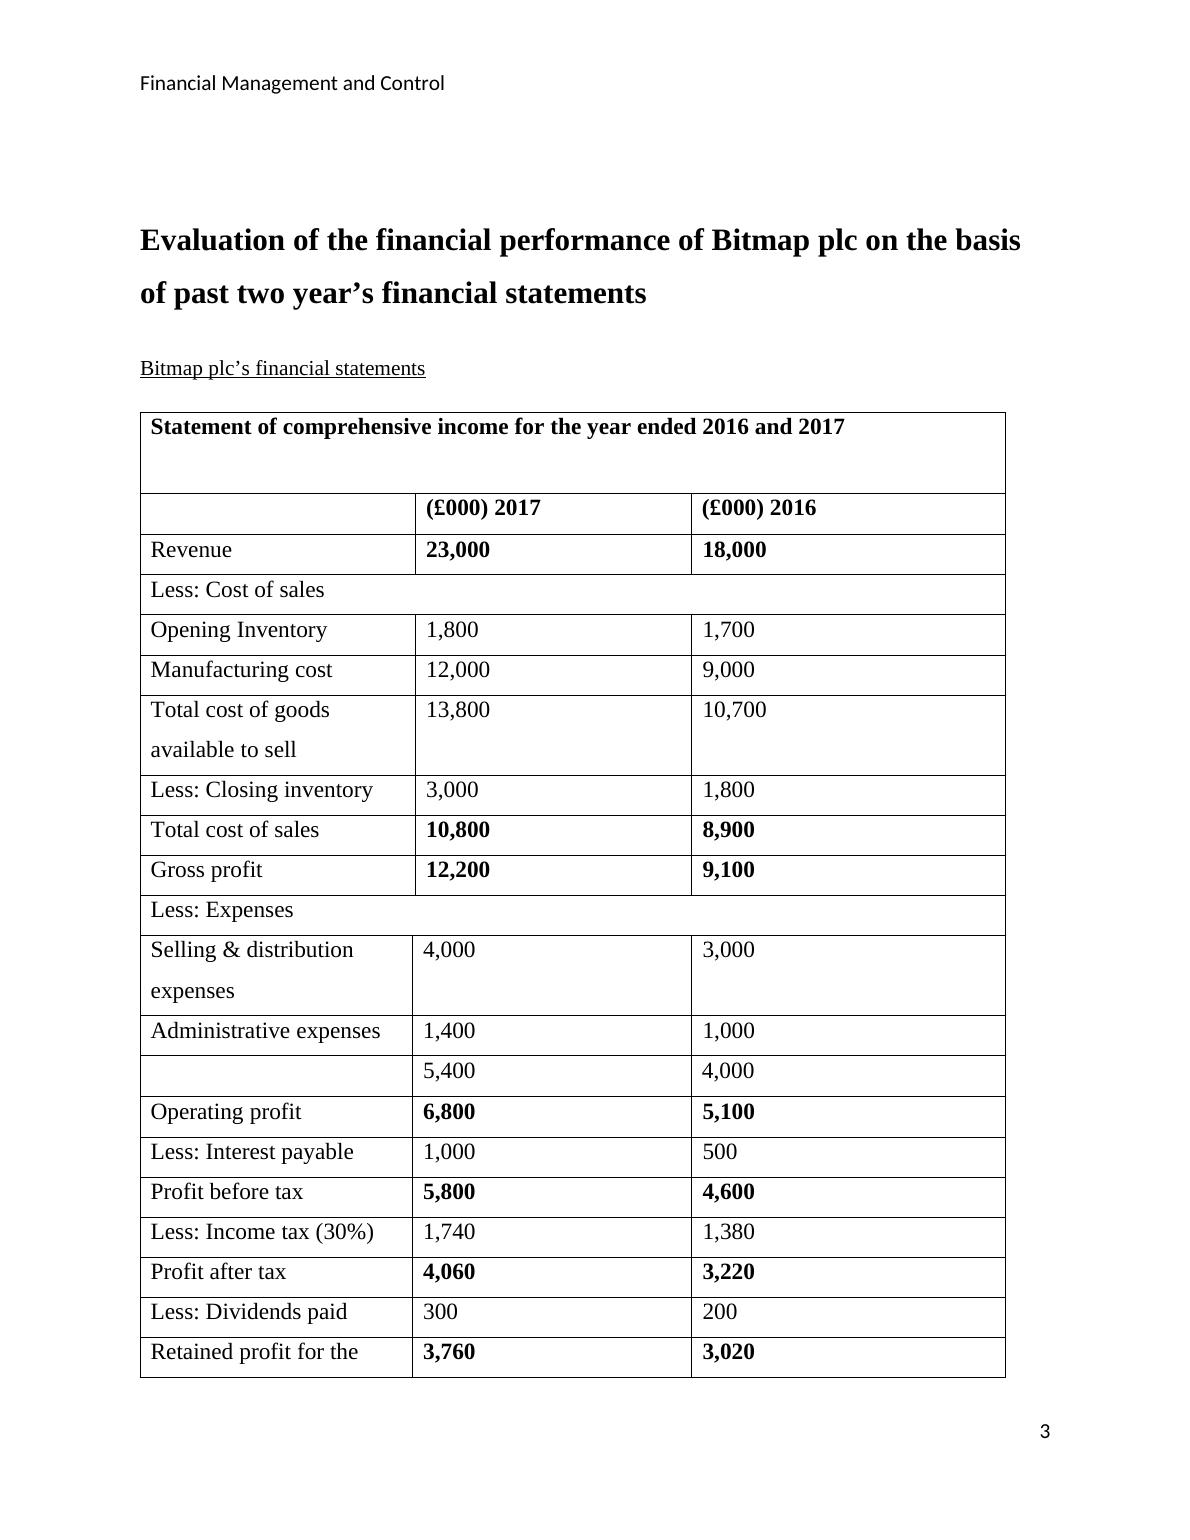
Statement of comprehensive income for the year ended 2016 and 2017
(£000) 2017 (£000) 2016
Revenue 23,000 18,000
Less: Cost of sales
Opening Inventory 1,800 1,700
Manufacturing cost 12,000 9,000
Total cost of goods
available to sell
13,800 10,700
Less: Closing inventory 3,000 1,800
Total cost of sales 10,800 8,900
Gross profit 12,200 9,100
Less: Expenses
Selling & distribution
expenses
4,000 3,000
Administrative expenses 1,400 1,000
5,400 4,000
Operating profit 6,800 5,100
Less: Interest payable 1,000 500
Profit before tax 5,800 4,600
Less: Income tax (30%) 1,740 1,380
Profit after tax 4,060 3,220
Less: Dividends paid 300 200
Retained profit for the 3,760 3,020
3
Evaluation of the financial performance of Bitmap plc on the basis
of past two year’s financial statements
Bitmap plc’s financial statements
Statement of comprehensive income for the year ended 2016 and 2017
(£000) 2017 (£000) 2016
Revenue 23,000 18,000
Less: Cost of sales
Opening Inventory 1,800 1,700
Manufacturing cost 12,000 9,000
Total cost of goods
available to sell
13,800 10,700
Less: Closing inventory 3,000 1,800
Total cost of sales 10,800 8,900
Gross profit 12,200 9,100
Less: Expenses
Selling & distribution
expenses
4,000 3,000
Administrative expenses 1,400 1,000
5,400 4,000
Operating profit 6,800 5,100
Less: Interest payable 1,000 500
Profit before tax 5,800 4,600
Less: Income tax (30%) 1,740 1,380
Profit after tax 4,060 3,220
Less: Dividends paid 300 200
Retained profit for the 3,760 3,020
3
Financial Management and Control
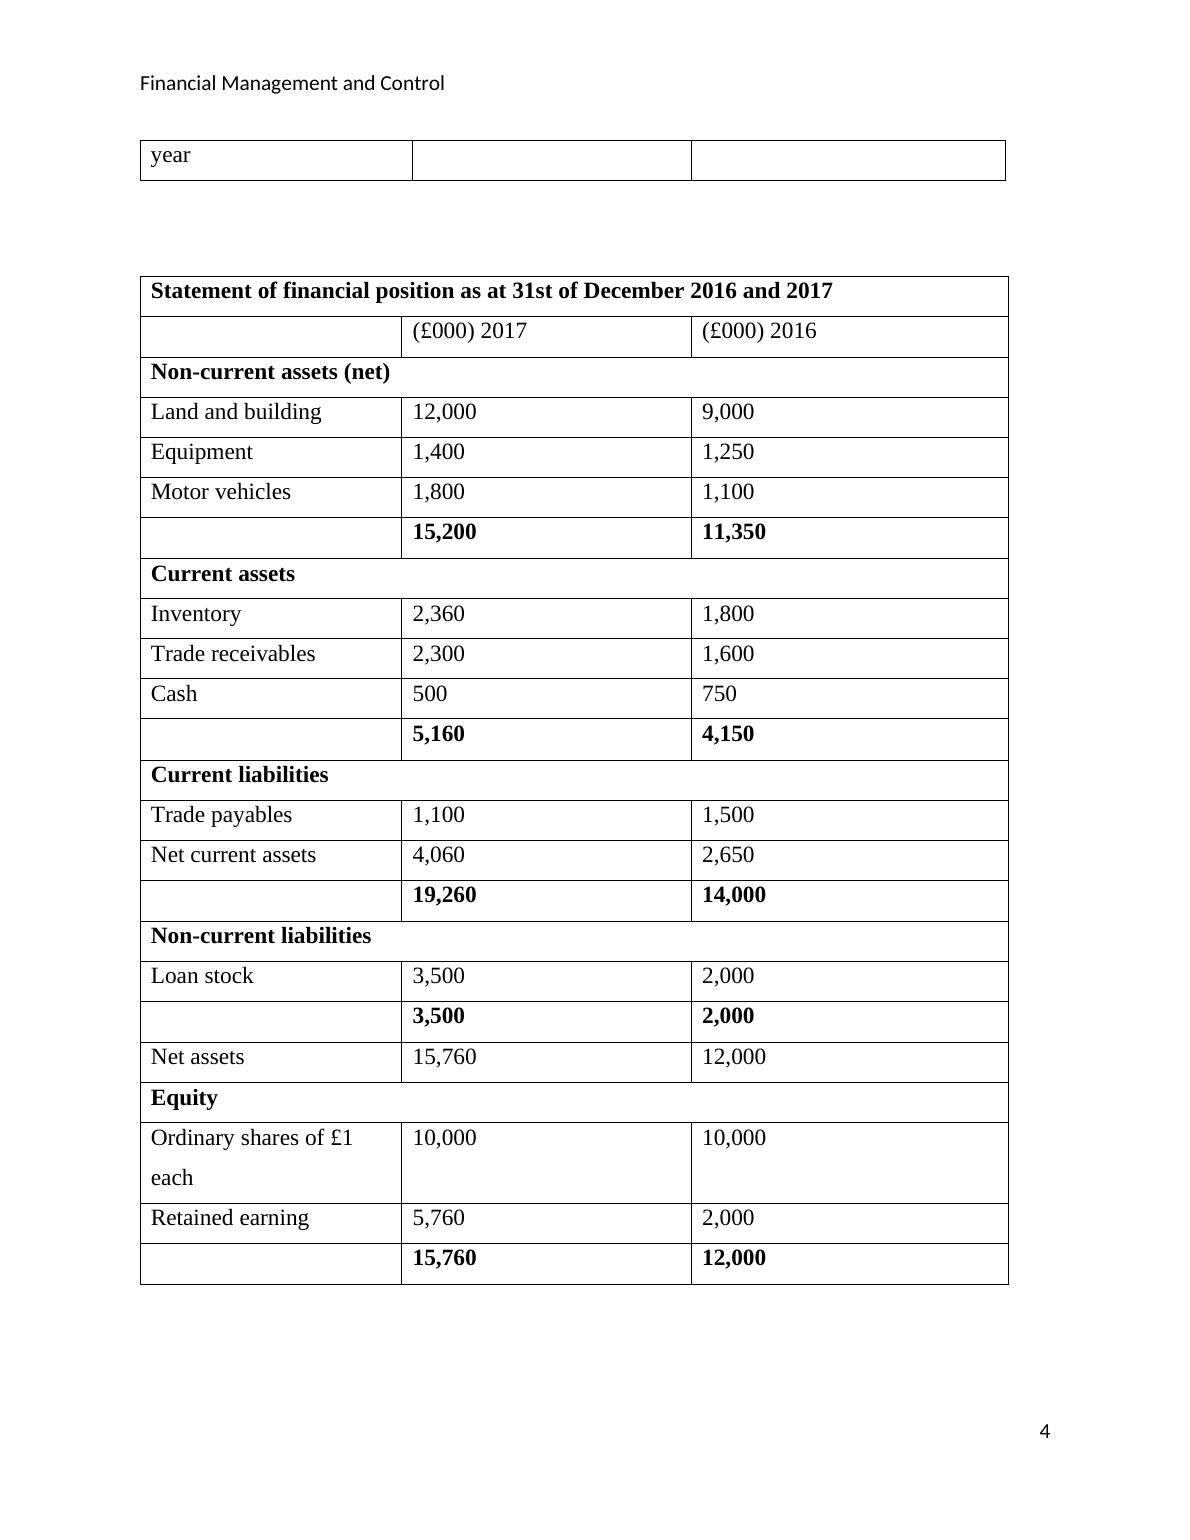
year
Statement of financial position as at 31st of December 2016 and 2017
(£000) 2017 (£000) 2016
Non-current assets (net)
Land and building 12,000 9,000
Equipment 1,400 1,250
Motor vehicles 1,800 1,100
15,200 11,350
Current assets
Inventory 2,360 1,800
Trade receivables 2,300 1,600
Cash 500 750
5,160 4,150
Current liabilities
Trade payables 1,100 1,500
Net current assets 4,060 2,650
19,260 14,000
Non-current liabilities
Loan stock 3,500 2,000
3,500 2,000
Net assets 15,760 12,000
Equity
Ordinary shares of £1
each
10,000 10,000
Retained earning 5,760 2,000
15,760 12,000
4
Financial Management and Control
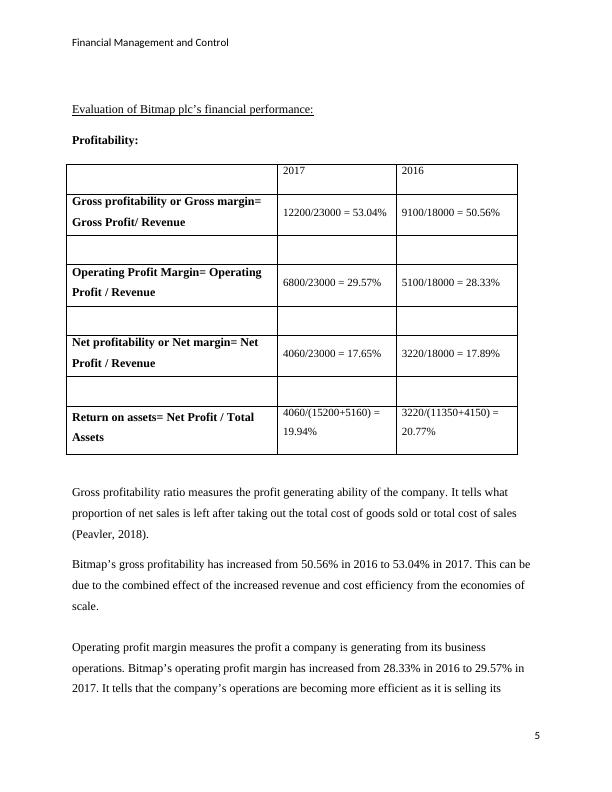
Evaluation of Bitmap plc’s financial performance:
Profitability:
2017 2016
Gross profitability or Gross margin=
Gross Profit/ Revenue 12200/23000 = 53.04% 9100/18000 = 50.56%
Operating Profit Margin= Operating
Profit / Revenue 6800/23000 = 29.57% 5100/18000 = 28.33%
Net profitability or Net margin= Net
Profit / Revenue 4060/23000 = 17.65% 3220/18000 = 17.89%
Return on assets= Net Profit / Total
Assets
4060/(15200+5160) =
19.94%
3220/(11350+4150) =
20.77%
Gross profitability ratio measures the profit generating ability of the company. It tells what
proportion of net sales is left after taking out the total cost of goods sold or total cost of sales
(Peavler, 2018).
Bitmap’s gross profitability has increased from 50.56% in 2016 to 53.04% in 2017. This can be
due to the combined effect of the increased revenue and cost efficiency from the economies of
scale.
Operating profit margin measures the profit a company is generating from its business
operations. Bitmap’s operating profit margin has increased from 28.33% in 2016 to 29.57% in
2017. It tells that the company’s operations are becoming more efficient as it is selling its
5
Financial Management and Control
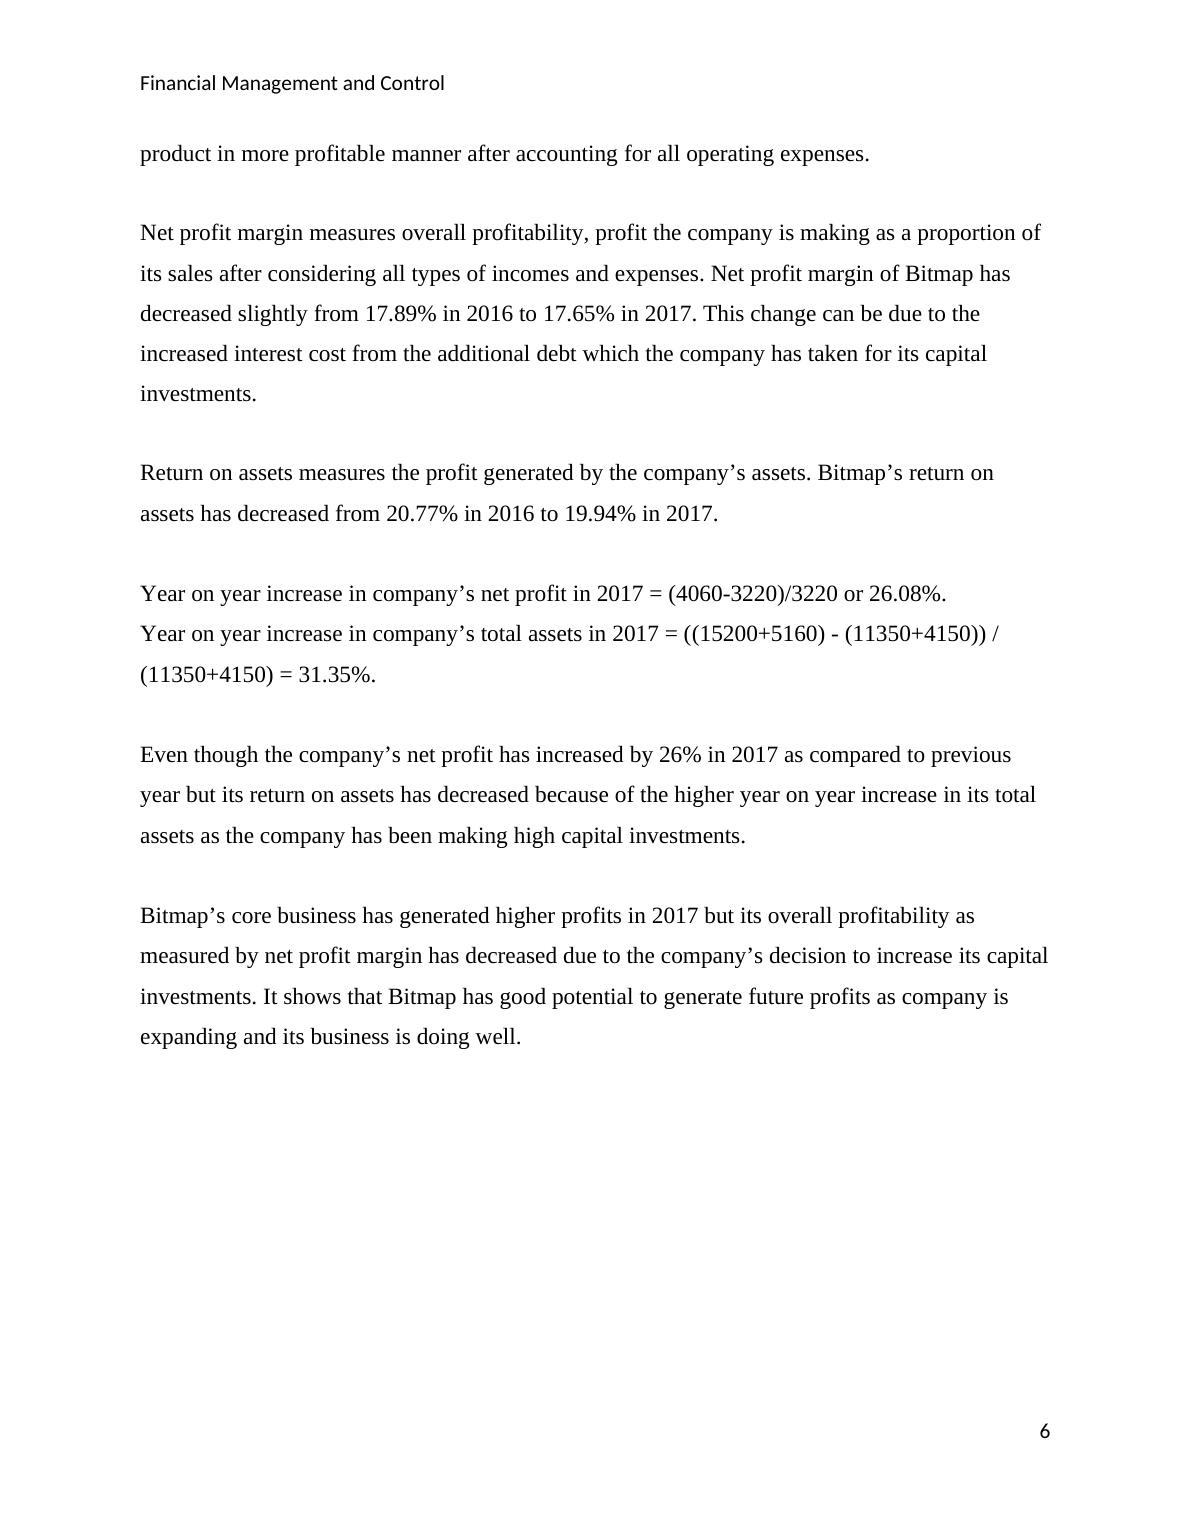
product in more profitable manner after accounting for all operating expenses.
Net profit margin measures overall profitability, profit the company is making as a proportion of
its sales after considering all types of incomes and expenses. Net profit margin of Bitmap has
decreased slightly from 17.89% in 2016 to 17.65% in 2017. This change can be due to the
increased interest cost from the additional debt which the company has taken for its capital
investments.
Return on assets measures the profit generated by the company’s assets. Bitmap’s return on
assets has decreased from 20.77% in 2016 to 19.94% in 2017.
Year on year increase in company’s net profit in 2017 = (4060-3220)/3220 or 26.08%.
Year on year increase in company’s total assets in 2017 = ((15200+5160) - (11350+4150)) /
(11350+4150) = 31.35%.
Even though the company’s net profit has increased by 26% in 2017 as compared to previous
year but its return on assets has decreased because of the higher year on year increase in its total
assets as the company has been making high capital investments.
Bitmap’s core business has generated higher profits in 2017 but its overall profitability as
measured by net profit margin has decreased due to the company’s decision to increase its capital
investments. It shows that Bitmap has good potential to generate future profits as company is
expanding and its business is doing well.
6
Financial Management and Control
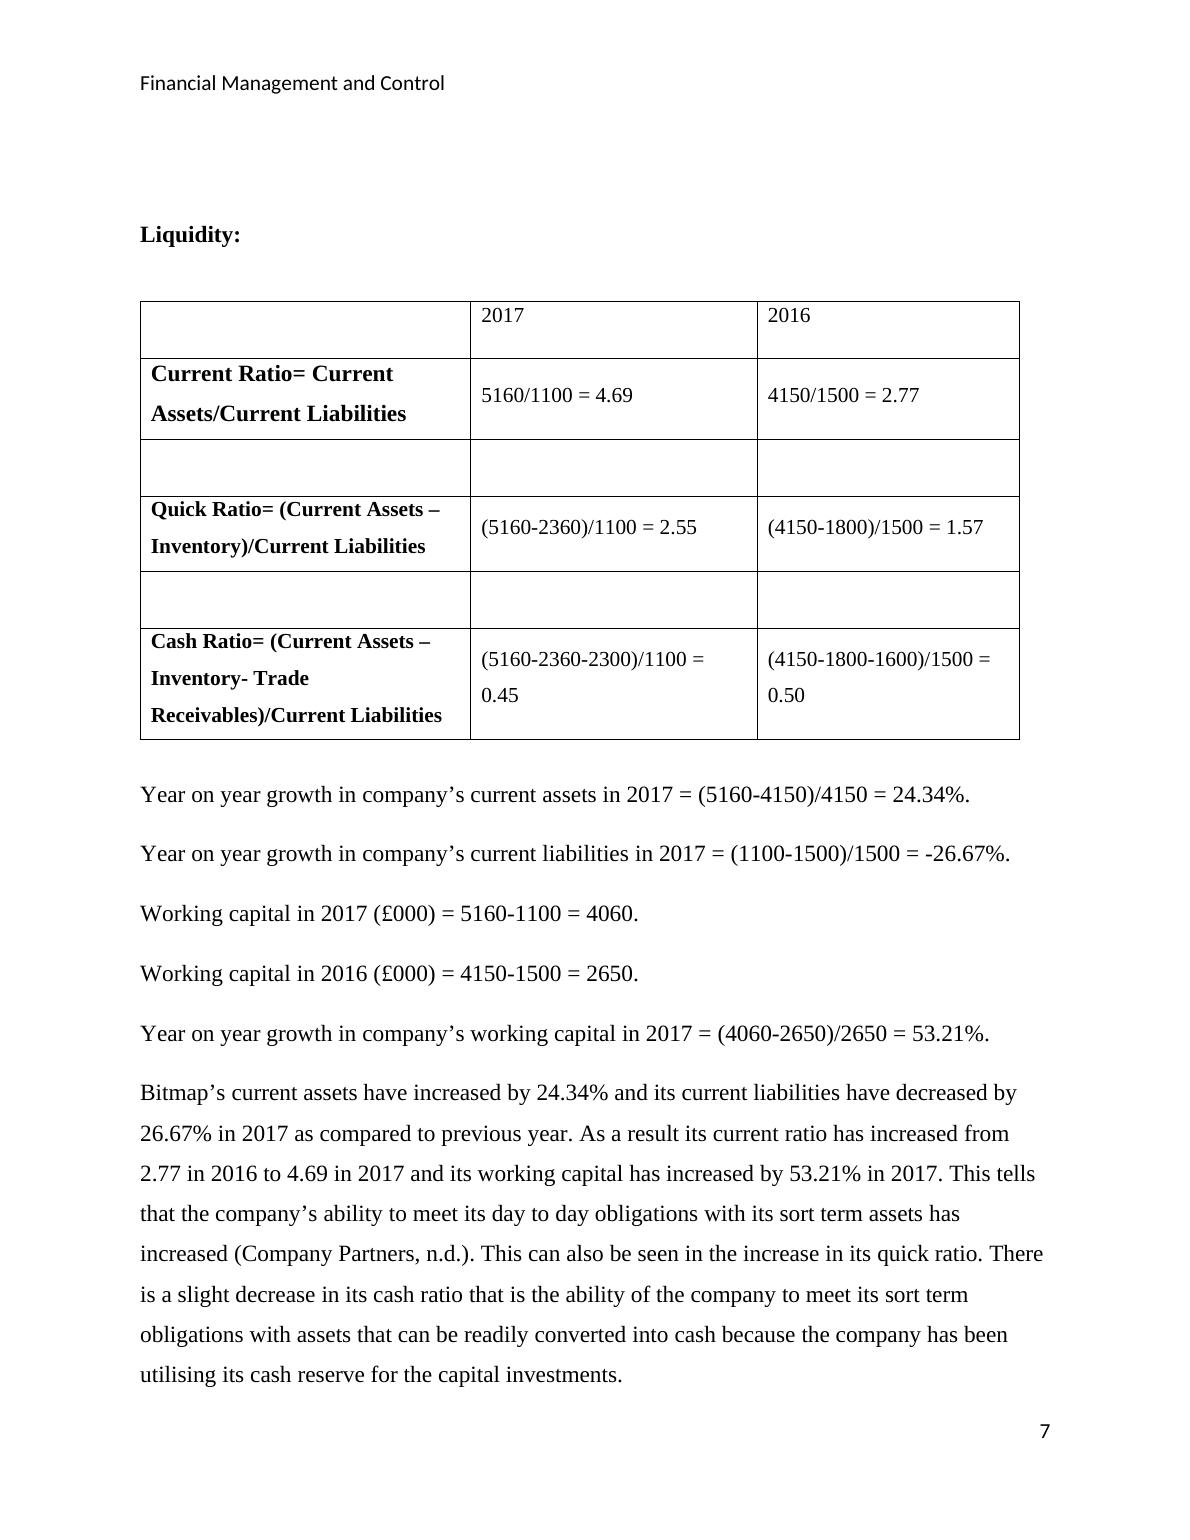
Liquidity:
2017 2016
Current Ratio= Current
Assets/Current Liabilities 5160/1100 = 4.69 4150/1500 = 2.77
Quick Ratio= (Current Assets –
Inventory)/Current Liabilities (5160-2360)/1100 = 2.55 (4150-1800)/1500 = 1.57
Cash Ratio= (Current Assets –
Inventory- Trade
Receivables)/Current Liabilities
(5160-2360-2300)/1100 =
0.45
(4150-1800-1600)/1500 =
0.50
Year on year growth in company’s current assets in 2017 = (5160-4150)/4150 = 24.34%.
Year on year growth in company’s current liabilities in 2017 = (1100-1500)/1500 = -26.67%.
Working capital in 2017 (£000) = 5160-1100 = 4060.
Working capital in 2016 (£000) = 4150-1500 = 2650.
Year on year growth in company’s working capital in 2017 = (4060-2650)/2650 = 53.21%.
Bitmap’s current assets have increased by 24.34% and its current liabilities have decreased by
26.67% in 2017 as compared to previous year. As a result its current ratio has increased from
2.77 in 2016 to 4.69 in 2017 and its working capital has increased by 53.21% in 2017. This tells
that the company’s ability to meet its day to day obligations with its sort term assets has
increased (Company Partners, n.d.). This can also be seen in the increase in its quick ratio. There
is a slight decrease in its cash ratio that is the ability of the company to meet its sort term
obligations with assets that can be readily converted into cash because the company has been
utilising its cash reserve for the capital investments.
7
End of preview
Want to access all the pages? Upload your documents or become a member.
Related Documents
Company Accountinglg...
|7
|557
|99
COMPANY ACCOUNTING.lg...
|7
|493
|1
Assignment about What is Liabilities?lg...
|4
|373
|8
Calculation of Goodwill of Serene Limitedlg...
|15
|2845
|40
Acquisition Analysis and Consolidation Worksheet for Deskliblg...
|5
|696
|193
PGBM12 Accounting and Financial Management Assessment January 2019 cohortlg...
|23
|4322
|184