Case Study: Financial Analysis and Performance of Wesfarmers Ltd
VerifiedAdded on 2023/05/28
|14
|3973
|347
Report
AI Summary
This assignment provides a comprehensive financial analysis of Wesfarmers Ltd, a company listed on the Australian Stock Exchange, for the years 2017 and 2018. It includes an examination of the company's income statement, balance sheet, and cash flow statement to assess its financial performance, profitability, asset efficiency, liquidity, and solvency. The analysis reveals that while revenue increased, rising costs impacted profitability. The report also evaluates key financial ratios, highlighting areas of improvement and concern, such as declining inventory turnover and liquidity ratios. The conclusion offers a recommendation on whether investing in Wesfarmers is viable, considering factors like market competition and financial health, with the aim of informing managerial decision-making and providing insights into the company's overall financial standing.
Financial
Management
Assignment
Management
Assignment
Paraphrase This Document
Need a fresh take? Get an instant paraphrase of this document with our AI Paraphraser
1
By student name
Professor
University
Date: 25 April 2018.
1 | P a g e
By student name
Professor
University
Date: 25 April 2018.
1 | P a g e
2
Executive Summary
In the given assignment, one of the companies listed on the Australian stock exchange has been
analysed and the performance of the same has been interpreted with the help of the financials. The
intent of the assignment is to do the critical analysis of the company through the financial statements
and give a brief overview and description of the business being done by the company. The report also
highlights how the financial information helps in the decision-making and keeps the managers informed
on various issues. It also covers the political and environmental impact, if any on the business as a whole
and other ethical considerations and points that needs to be considered when the organization is
mentioned to be solvent or in case it is looking for merger or acquisition. Finally, towards the end, a
recommendation and conclusion has been given keeping all the relevant factors in mind as to whether
or not it is viable to invest in the company.
2 | P a g e
⊘ This is a preview!⊘
Do you want full access?
Subscribe today to unlock all pages.
Trusted by 1+ million students worldwide
3
Table of Contents
Introduction.................................................................................................................................................4
Discussion and Analysis...............................................................................................................................4
Income Statement Analysis.....................................................................................................................4
Balance Sheet Analysis............................................................................................................................6
Cash Flow Statement Analysis.................................................................................................................8
Ratio Analysis...........................................................................................................................................9
Other considerations.............................................................................................................................10
Conclusion and Recommendation.............................................................................................................11
References.................................................................................................................................................12
3 | P a g e
Paraphrase This Document
Need a fresh take? Get an instant paraphrase of this document with our AI Paraphraser

4
Introduction
The company Wesfarmers Ltd is considered one of the pioneer companies in Australia and is listed on
the Australian Stock Exchange. The company has been analysed for the year 2018 and 2017 through the
annual report of the company. Wesfarmers has had wide presence all round the world and has
subsidiaries spanning in almost all the major nations of the world but it primarily deals in Australia, New
Zealand, Bangladesh, Ireland and United Kingdom (Arnott, et al., 2017). Its major products include
fertilisers, manures, chemicals, retail, mining, safety, and industrial products. It became the largest
company in Australia in 2016 in terms of revenue leaving behind giants like those of Woolworth and BHP
Billiton. Again, it is the largest private employer in the country of Australia and gives livelihood to more
than 220000 people.
The company has been a leader in the industry its delves into and have been delivering value to its
customers for a long time (Alexander, 2016). The primary objective and the mission of the company has
been to deliver satisfaction to the shareholders in terms of financial discipline and proper management
of the portfolio of the products being handled by the organization. It also aims towards engaging the
local communities in work place and minimising the environmental impact to the best possible extent.
The company is one in its types that plays a vital role in the lives of almost every another Australian and
thereby it shows the dominant positioning of the company in the country.
Discussion and Analysis
The ratio has been done for the last 2 years in terms of profitability, the asset efficiency, the liquidity
and solvency of the company as compared to the marketplace. However, before that the financial
assessment has been done with the help of the financial statements like consolidated profit and loss
account, the balance sheet and the cash flow position (Axelsen, et al., 2017).
Income Statement Analysis
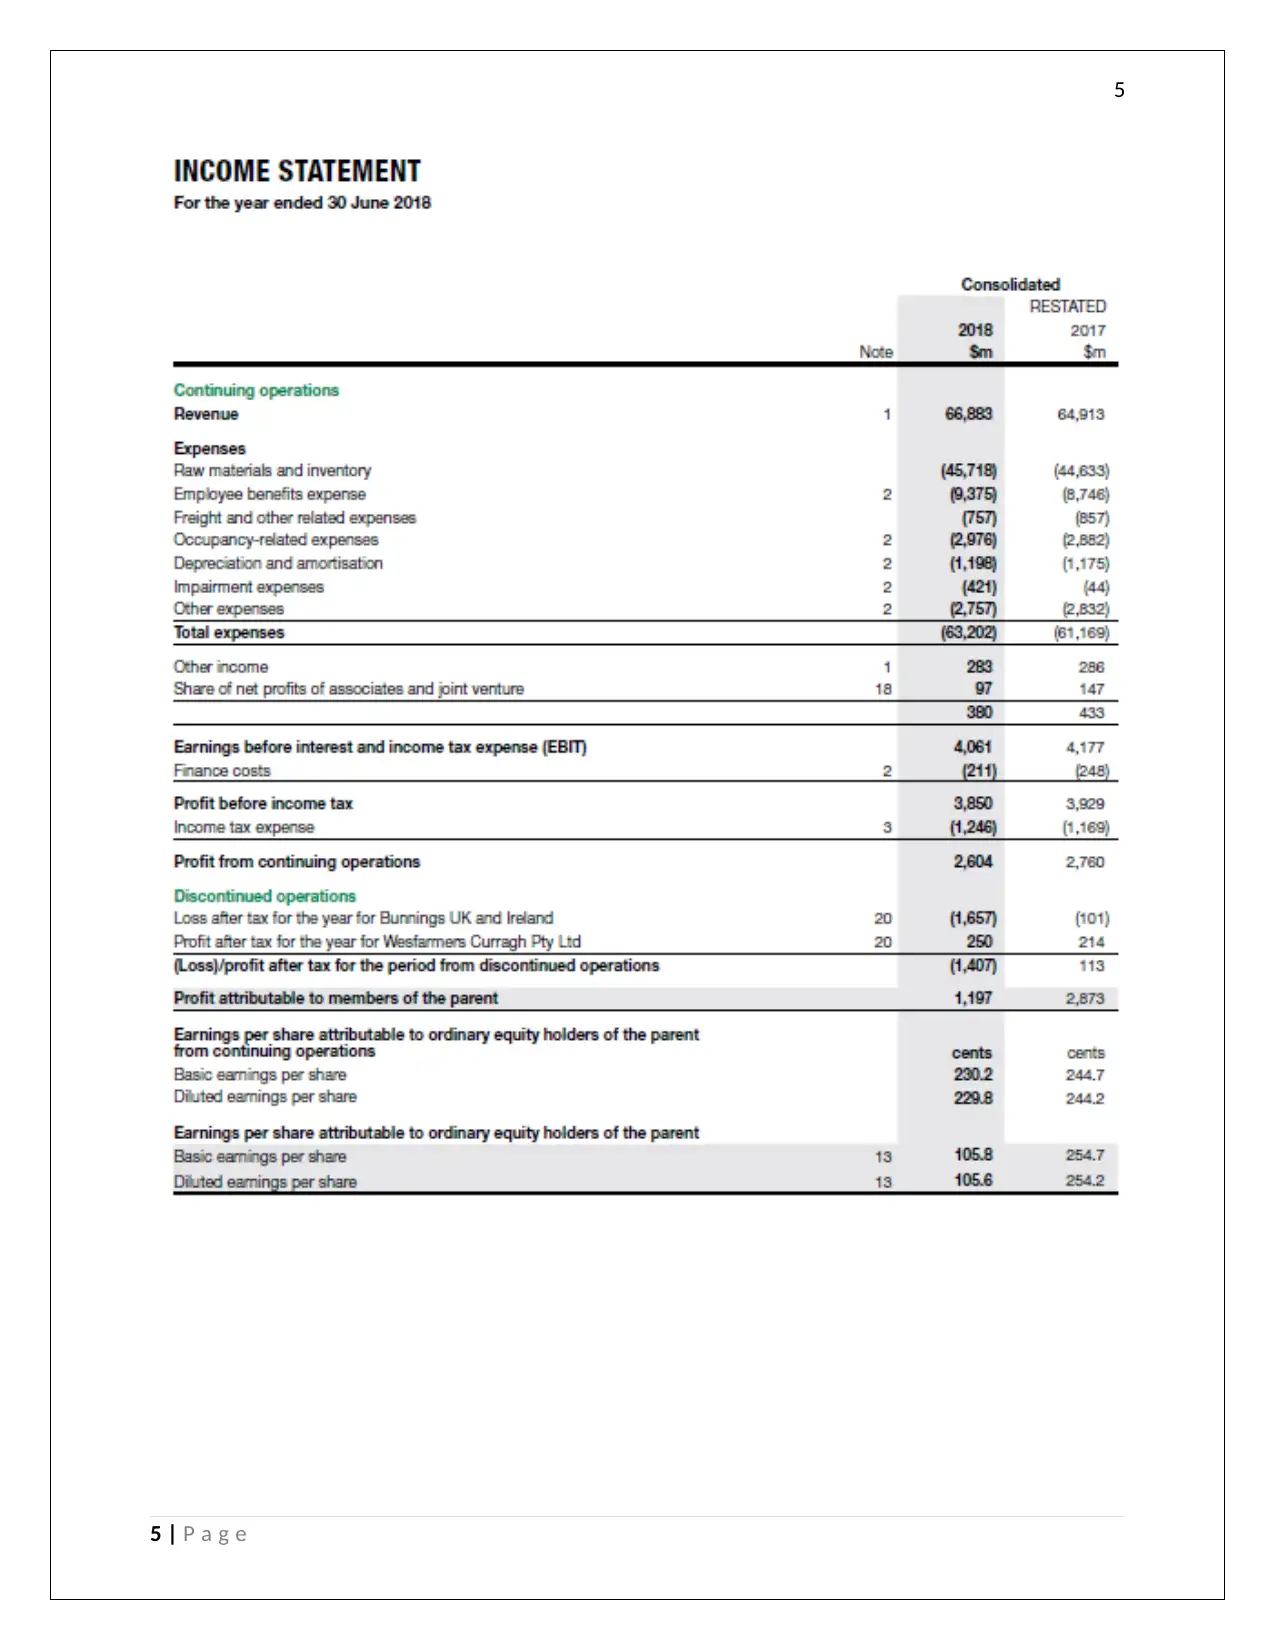
From the analysis of the income statement, it can be seen that the though the revenue from the
operations has increased in 2018 as compared to 2017 indicating the growth in business, the
corresponding increase in the raw material and inventory cost has been so much that there is no
additional profit for the company to work with. There has also been slight increase in the other expenses
as well like those of employee benefit expense, the freight and other related expenses, the occupancy
related expenses, depreciation and amortization expenses and finally the impairment loss (Bromwich &
Scapens, 2016). This indicates that the company has not been able to control neither on the fixed costs
nor on the one time operational costs because of which the operating profit has declined. There is slight
decrease in the finance costs as well as the other incomes. Overall, the earnings before interest and
income tax expenses has declined by nearly 2.5% which has had a final impact on the earnings per share
as well as the final profit attributable to the equity shareholders.
4 | P a g e
Introduction
The company Wesfarmers Ltd is considered one of the pioneer companies in Australia and is listed on
the Australian Stock Exchange. The company has been analysed for the year 2018 and 2017 through the
annual report of the company. Wesfarmers has had wide presence all round the world and has
subsidiaries spanning in almost all the major nations of the world but it primarily deals in Australia, New
Zealand, Bangladesh, Ireland and United Kingdom (Arnott, et al., 2017). Its major products include
fertilisers, manures, chemicals, retail, mining, safety, and industrial products. It became the largest
company in Australia in 2016 in terms of revenue leaving behind giants like those of Woolworth and BHP
Billiton. Again, it is the largest private employer in the country of Australia and gives livelihood to more
than 220000 people.
The company has been a leader in the industry its delves into and have been delivering value to its
customers for a long time (Alexander, 2016). The primary objective and the mission of the company has
been to deliver satisfaction to the shareholders in terms of financial discipline and proper management
of the portfolio of the products being handled by the organization. It also aims towards engaging the
local communities in work place and minimising the environmental impact to the best possible extent.
The company is one in its types that plays a vital role in the lives of almost every another Australian and
thereby it shows the dominant positioning of the company in the country.
Discussion and Analysis
The ratio has been done for the last 2 years in terms of profitability, the asset efficiency, the liquidity
and solvency of the company as compared to the marketplace. However, before that the financial
assessment has been done with the help of the financial statements like consolidated profit and loss
account, the balance sheet and the cash flow position (Axelsen, et al., 2017).
Income Statement Analysis
From the analysis of the income statement, it can be seen that the though the revenue from the
operations has increased in 2018 as compared to 2017 indicating the growth in business, the
corresponding increase in the raw material and inventory cost has been so much that there is no
additional profit for the company to work with. There has also been slight increase in the other expenses
as well like those of employee benefit expense, the freight and other related expenses, the occupancy
related expenses, depreciation and amortization expenses and finally the impairment loss (Bromwich &
Scapens, 2016). This indicates that the company has not been able to control neither on the fixed costs
nor on the one time operational costs because of which the operating profit has declined. There is slight
decrease in the finance costs as well as the other incomes. Overall, the earnings before interest and
income tax expenses has declined by nearly 2.5% which has had a final impact on the earnings per share
as well as the final profit attributable to the equity shareholders.
4 | P a g e
5
5 | P a g e
5 | P a g e
⊘ This is a preview!⊘
Do you want full access?
Subscribe today to unlock all pages.
Trusted by 1+ million students worldwide
6
Balance Sheet Analysis
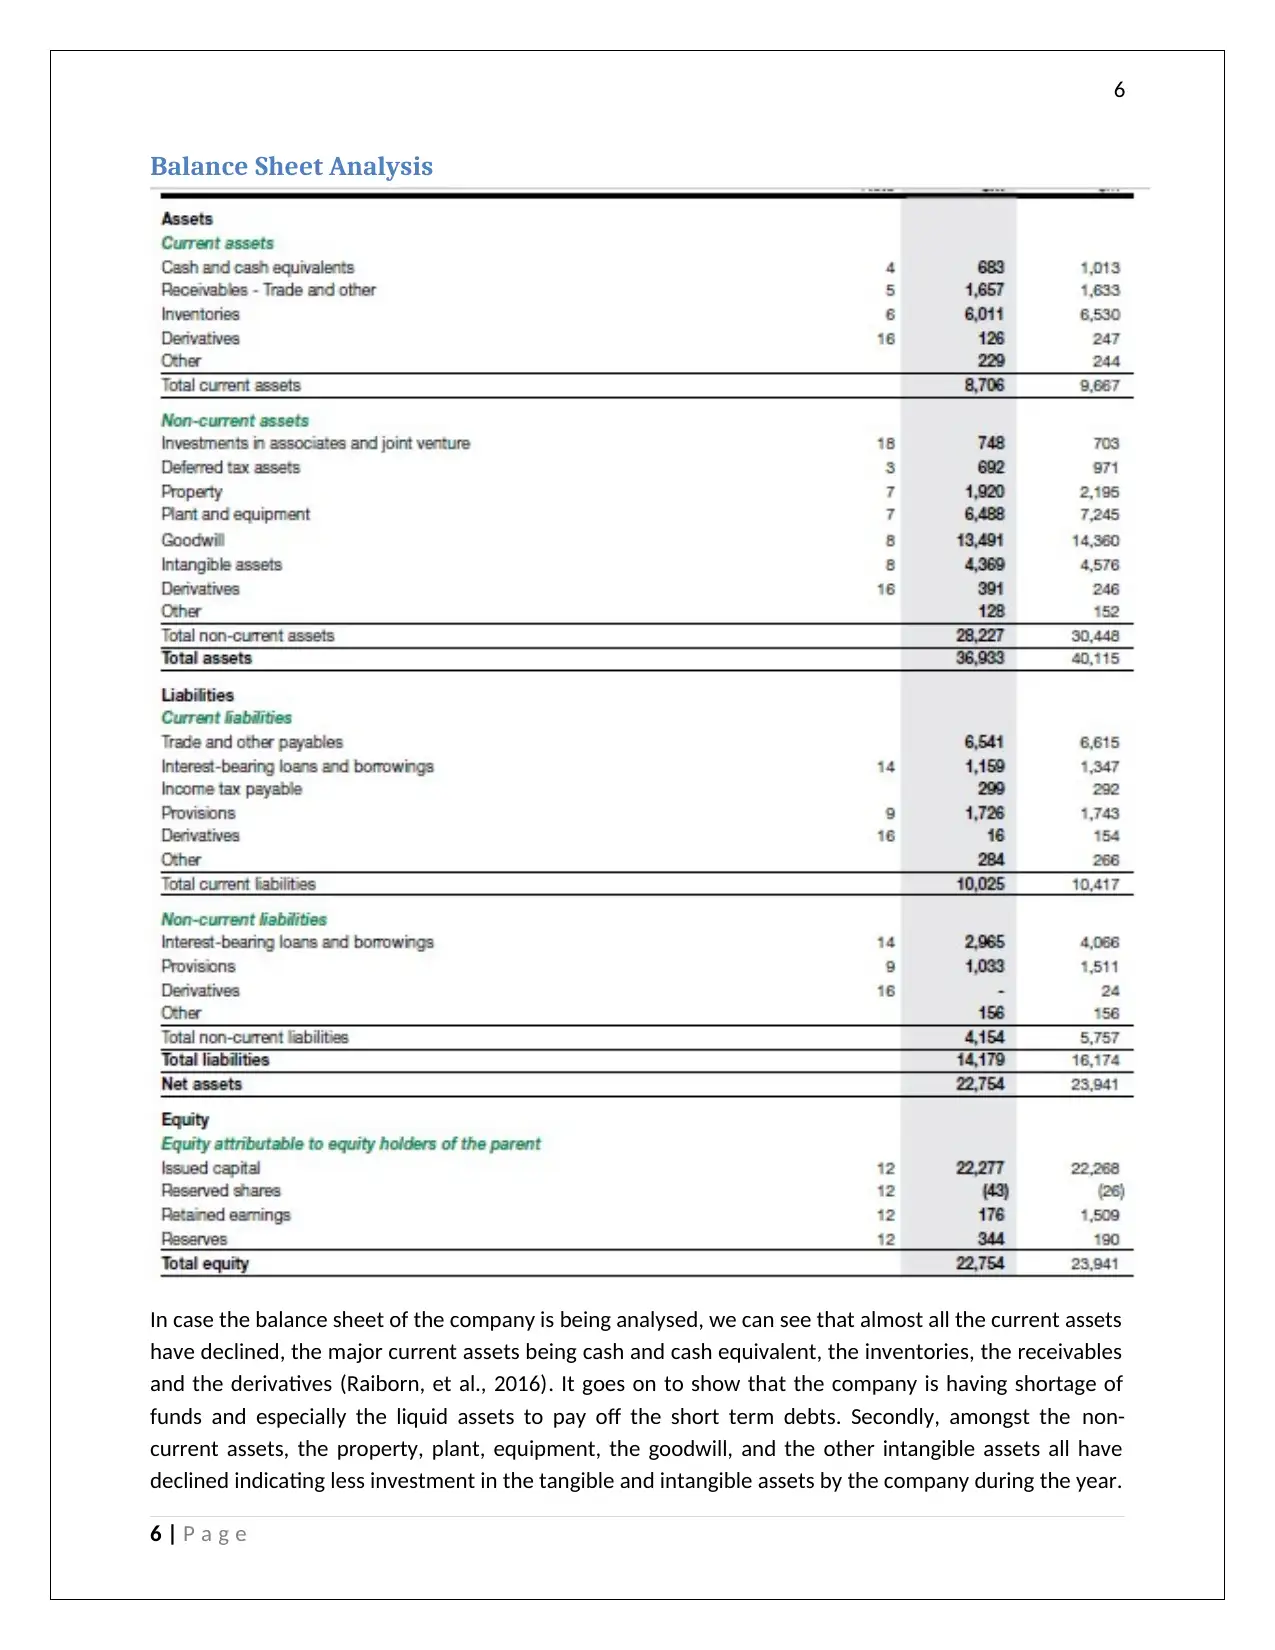
In case the balance sheet of the company is being analysed, we can see that almost all the current assets
have declined, the major current assets being cash and cash equivalent, the inventories, the receivables
and the derivatives (Raiborn, et al., 2016). It goes on to show that the company is having shortage of
funds and especially the liquid assets to pay off the short term debts. Secondly, amongst the non-
current assets, the property, plant, equipment, the goodwill, and the other intangible assets all have
declined indicating less investment in the tangible and intangible assets by the company during the year.
6 | P a g e
Balance Sheet Analysis
In case the balance sheet of the company is being analysed, we can see that almost all the current assets
have declined, the major current assets being cash and cash equivalent, the inventories, the receivables
and the derivatives (Raiborn, et al., 2016). It goes on to show that the company is having shortage of
funds and especially the liquid assets to pay off the short term debts. Secondly, amongst the non-
current assets, the property, plant, equipment, the goodwill, and the other intangible assets all have
declined indicating less investment in the tangible and intangible assets by the company during the year.
6 | P a g e
Paraphrase This Document
Need a fresh take? Get an instant paraphrase of this document with our AI Paraphraser
7
There has also been major disposal of the tangible assets and the impairment of intangible assets during
the year as can be seen from the schedule of depreciation and amortization and the property, plant and
equipment. Apart from these, the other non-current assets like those of investment in associates and
the joint ventures and derivatives and other non-current assets all have increased marginally (Werner,
2017). However, on the overall basis, the investment in the non-current assets has also declined in 2018
as compared to 2017.
In case the liabilities of the company is being analysed, we can see that the current liabilities has
remained more or less constant and the amount of trade and other payables, the income tax payable,
the provisions, derivatives, interest bearing loan and borrowings and other current liabilities all have
remained constant over the course of last years (Visinescu, et al., 2017). Amongst the non-current
liabilities, the balance of the interest bearing loans and borrowing and the provisions all have declined
substantially indicating that the company has made a major repayment of the loans during the year and
that has helped the company in reducing the overall liability of the company. Thereby, the overall
liabilities balance of the company has declined which is a positive factor. Lastly, in case the equity of the
company is being analysed, we can see that the issued capital in terms of the share capital and the
reserved shares balance has remained constant whereas the retained earnings balance has declined due
to the equity dividend being declared for the equity shareholders amounting to $ 2529 Mn (2017: $
2235 Mn). Overall, the equity balance has declined (Trieu, 2017).
7 | P a g e
8
Cash Flow Statement Analysis
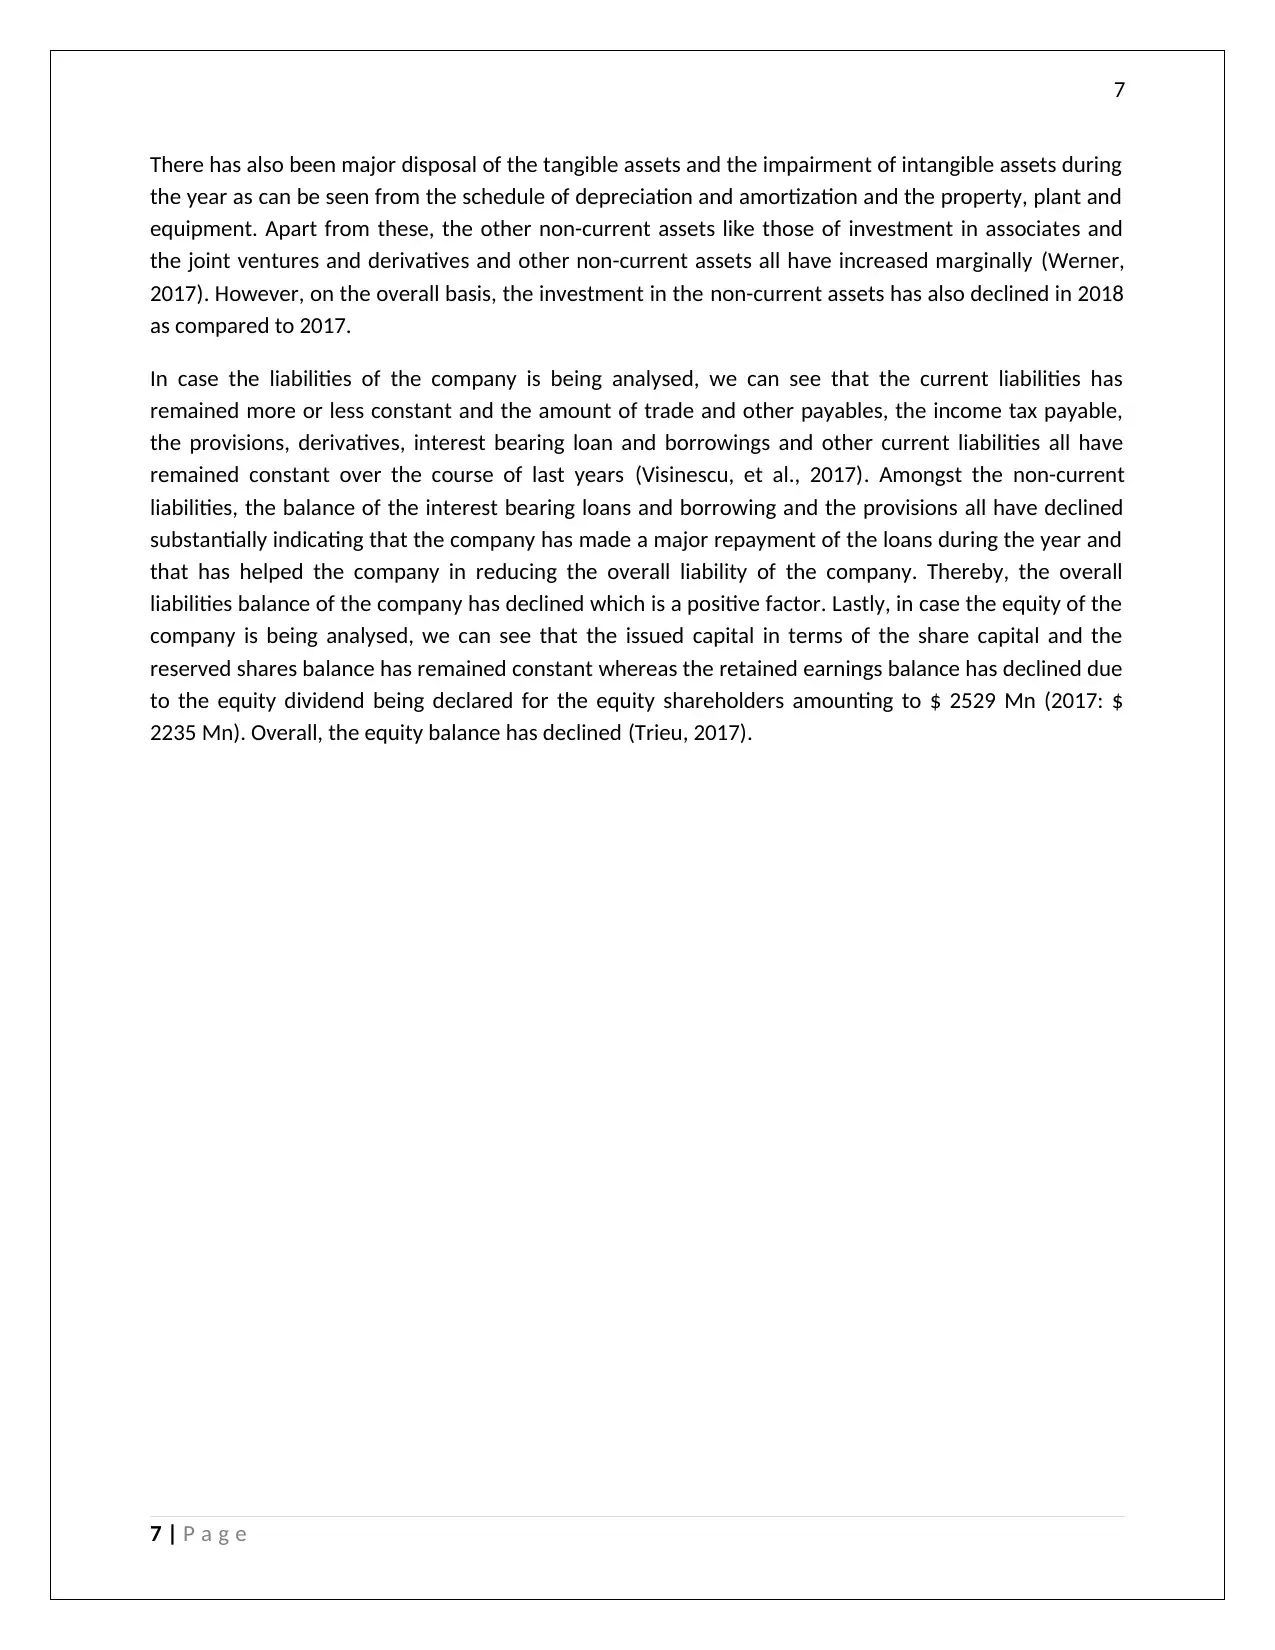
Finally in case the cash flow statement of the company is being analysed for the 2 given years we can
see that the net cash flow from the operating activities has declined and the major reason for the same
has been that the payments to the suppliers and the employees has been more than the amount
received from customers. Furthermore, the income tax paid for the year has also increased for the year
as compared to the last year (Sithole, et al., 2017). IN terms of the investing activity, the company did
invest in the purchase of property plant and equipment to the tune of $ 1815 Mn ($1681 Mn in 2017)
but the proceeds from the sale of property, plant and equipment ($ 606 Mn in 2018 vs $ 653 Mn in
2017) as well as from the sale of business and associates ($ 534 Mn in 2018 vs $947 Mn in 2017) has
declined substantially. Overall, again there is a sharp decline in the net cash flow from investing activity.
In terms of the financing activity, the proceeds from the borrowing has increased as the company has
raised debt. There was a major repayment of the loan and other borrowings as well during the year,
which has helped in bringing down the loan balance substantially (Choy, 2018). The company also made
a major equity dividend payment amounting to $ 2528 Mn in 2018, which had a further impact on the
increase in net outflow from investing activity as well. Overall, the net outflow of the cash and cash
equivalents amounted to $ 330 Mn as compared to $ 402 Mn of inflow in 2017. This is the main reason
for the huge decline in the cash balance.
8 | P a g e
Cash Flow Statement Analysis
Finally in case the cash flow statement of the company is being analysed for the 2 given years we can
see that the net cash flow from the operating activities has declined and the major reason for the same
has been that the payments to the suppliers and the employees has been more than the amount
received from customers. Furthermore, the income tax paid for the year has also increased for the year
as compared to the last year (Sithole, et al., 2017). IN terms of the investing activity, the company did
invest in the purchase of property plant and equipment to the tune of $ 1815 Mn ($1681 Mn in 2017)
but the proceeds from the sale of property, plant and equipment ($ 606 Mn in 2018 vs $ 653 Mn in
2017) as well as from the sale of business and associates ($ 534 Mn in 2018 vs $947 Mn in 2017) has
declined substantially. Overall, again there is a sharp decline in the net cash flow from investing activity.
In terms of the financing activity, the proceeds from the borrowing has increased as the company has
raised debt. There was a major repayment of the loan and other borrowings as well during the year,
which has helped in bringing down the loan balance substantially (Choy, 2018). The company also made
a major equity dividend payment amounting to $ 2528 Mn in 2018, which had a further impact on the
increase in net outflow from investing activity as well. Overall, the net outflow of the cash and cash
equivalents amounted to $ 330 Mn as compared to $ 402 Mn of inflow in 2017. This is the main reason
for the huge decline in the cash balance.
8 | P a g e
⊘ This is a preview!⊘
Do you want full access?
Subscribe today to unlock all pages.
Trusted by 1+ million students worldwide

9
Ratio Analysis
Ratios Wesfarmers Ltd.
Types of Ratios Formulas 12 months
Jun-30-2017
12 months
Jun-30-2018
Profitability Ratios
Return on Assets % Net Profit/ Total Assets 4.9% 6.2%
Return on Capital % Net profit to shareholders/Equity Shareholders' funds 6.4% 8.4%
Net Income Margin % Net Profit/ total sales 0.6% 4.2%
Efficiency Ratios
Total Asset Turnover Sales / Total Assets 1.6x 1.7x
Fixed Assets Turnover Sales / Fixed Assets 6.7x 7.2x
Accounts Receivable
Turnover
Sales / Accounts Receivables 57.2x 55.6x
Inventory Turnover Sales / Inventory 7.8x 7.3x
Liquidity Ratios
Current Ratio Current Assets/ current Liabilities 0.9x 0.9x
Quick Ratio Current Assets - Inventory - Prepaid Expenses/ current
Liabilities
0.2x 0.3x
Working capital Ratio Working capital / Current Liabilities 0.3x 0.4x
Solvency Ratios
Total Debt/Equity Total Debt/Equity 31.8% 22.6%
Total Debt/Capital Total Debt/Capital 24.1% 18.4%
EBIT / Interest Exp. EBIT / Interest Exp. 11.9x 18.3x
Investment Ratios
Price Earnings Ratio Market price per share/ EPS 122.0
6
16.20
Earnings per share Distributable earnings/No. of equity shares 2.54 1.05
Price/Book Value Market price per share/ Book value per share 2.2x 2.1x
The ratio analysis for the company has been shown above. As per the same, in case the profitability
ratios are being analysed, we can see that the return on the assets has increased to 6.2% from 4.9%
during the last year. The return on the equity which is the measure of what shareholders get on their
investment in the company, the same has also increased from 6.4% to 8.4% in 2018 (Jefferson, 2017).
The net income margin which is the net profit earned on the sales has increased from 0.6% to 4.2% in
2018. This goes on to say that even though the company is not near to the industry trend but it has
improved a lot in the last one-year or so. Wesfarmers as a company is an industry leader and thereby
has minimum scope of expansion in terms of areas as well as the products. In addition, it has been facing
stiff competition from the new entrants within the industry due to price competition and it has been a
major reason for lower profitability of the company.
In case the efficiency ratio of the company is being assessed, we see that the total asset turnover, which
indicates the ability of the assets of the company to generate the sales, has increased from 1.6 times to
1.7 times which shows that the company has been efficiently using the assets. Similarly, the fixed assets
turnover which is the measure of how the fixed assets is being utilised by the company to generate the
9 | P a g e
Paraphrase This Document
Need a fresh take? Get an instant paraphrase of this document with our AI Paraphraser
10
sales has also increased from 6.7 times to 7.2 times in 2018 (Heminway, 2017). The accounts receivable
turnover ratio on the other hand has declined from 57 times to 55 times and it indicates the non-
collectability issue and the weakness in the internal control of the company. Finally, the inventory
turnover ratio has also declined from 7.8 times to 7.3 times indicating the weakness of the company in
converting the stock or inventory to sales.
The liquidity ratios are the measure of the company’s ability to pay off the short-term debts and
obligations. The current ratio, which is a measure of current assets available with the company to pay off
the current liabilities, has remained almost constant at 0.9 times, which is way below the industry and
the ideal standard of 2 times (Linden & Freeman, 2017). Similarly, the quick ratio, which shows the
measure of liquid assets available with the company, has also been constant at 0.2 - 0.3 times as against
the standard industry ratio of one times. The working capital ratio is adverse at 0.4 times for the
company indicating the need for more investment in current assets.
In case the solvency of the company is also being analysed, we can see that the debt equity ratio has
declined substantially from 31.8% to 22.6%, which is due to the repayment of the debt, and thus it can
be said that the company is a solvent one as it is having lower proportion of the debt. The debt equity
ratio as per industry trend is 2:1 times. In the given case, the debt capital ratio also declined from 24% to
18% in the current year (Goldmann, 2016). Lastly the interest coverage ratio which is the measure of
how much profit is being earned by the company to cover up the interest expenses has increased from
11 times to 18 times which again is a positive indicator for the company.
Lastly, in case the investment ratios is being analysed, we see that the earnings per share has declined
due to decrease in profits. Similarly, the price by book value ratio has also declined marginally and the
price earnings ratio has witnessed the major decline from 122 times to 16 times. This shows that the
profitability and the desire of the investors to invest in the shares of the company has declined over the
past year (Dichev, 2017).
Other considerations
The company has been facing a lot of competition from the new entrants and the existing players
because of the inclusive environment and aid by the government. The political situation has been more
or less constant and in favour of the business with less restrictions. Therefore, there is no such political
risk. In terms of the ethical considerations of the company, it has been solvent over year and as per the
audit report of the company, it has followed all the relevant standards in reporting and the Corporations
Act, 2001 and given a true and fair view of affairs of the business. It also mentions that the company is a
going concern and that there are no chances of liquidation in the near future. Thereby the auditors have
also given a clean report (Kew & Stredwick, 2017). The company has been focusing a lot on three key
areas and it was given priority during the last year. It includes addressing areas of underperformance,
repositioning of the overall portfolio of the company and driving all the major opportunities for growth.
The company also successfully made demerger of the Coles division and made divestments of Curragh
and BUKI during the last year indicating a step towards the optimum capital allocation and repositioning
of the portfolio. The company was also aware of the shareholder’s expectation and it continued with the
policy of distribution of franking credits to its investors in the form of dividend (Farmer, 2018).
10 | P a g e
11
Conclusion and Recommendation
From the above discussion and analysis, we can see that the company Wesfarmers is the industry leader
and does not need to prove its worth in the world market. It has a widespread presence all over the
world and is dealing in most of the retail products.
1. In case the financial performance is being analysed, we can see that though the company has
managed to improve the top line, the bottom-line is still an issue and therefore the company
should either increase the prices of the products or try to reduce the costs particularly the raw
material costs (Lavassani & Movahedi, 2017).
2. Secondly, the company also needs to improve upon the current ratio and the working capital
mix so that the banks and financial institutions and above all the creditors do feel secured that
the company will be able to pay off the short-term debt and obligations on time, if required. For
the same to happen, the company needs to invest in the current assets and improve the cash
and cash equivalents balance in hand.
3. Thirdly, the company needs to improve on the internal control measures within the company so
that the liquidity can be ensured and the turnover ratios can be improved. Some of the
examples include improving the debtor conversion rate, liquidation of inventory. All this will
help in saving of operational and interest costs (Oberoi, 2018).
4. The company further needs to meet the expectation of the shareholders in terms of EPS, the
return on equity and the P/E ratio which can be done through aggressive techniques and new
strategies.
Considering all the above recommendations and the status of the company, it can be concluded that the
company is a reasonable avenue for the investor to invest in, as it is quite stable company with no major
fluctuations. In case the above points are being adhered to and given focus in the future the
organization will surely flourish and succeed. Furthermore, it is good avenue for the long-term
investment considering the below mentioned facts:
1. Stable growth and profitability
2. Market leadership and presence in the lives of almost major proportion of the population
3. Good ethical practices which include local sourcing, training and development of the employees
4. Presence in almost all the major developed and developing countries
5. Vision and mission stated to cope with the competition and focus on adding value to the
shareholders.
6. Good corporate governance practices and sustainable reporting.
7. Lower proportion of the debt in the overall capital thereby less dilution in ownership and less
risk of default in interest and debt payment. This also gives the opportunity to the company to
use leveraging in future if required.
8. Continuous growth in terms of the revenue in the past years.
9. Plans and strategies to venture into new areas and businesses in future for further growth plans
10. Focus on Merger and Acquisitions in order to have inorganic growth as well.
11. Going concern entity throughout the years.
11 | P a g e
⊘ This is a preview!⊘
Do you want full access?
Subscribe today to unlock all pages.
Trusted by 1+ million students worldwide
1 out of 14
Related Documents


Your All-in-One AI-Powered Toolkit for Academic Success.
+13062052269
info@desklib.com
Available 24*7 on WhatsApp / Email
![[object Object]](/_next/static/media/star-bottom.7253800d.svg)
Unlock your academic potential
Copyright © 2020–2025 A2Z Services. All Rights Reserved. Developed and managed by ZUCOL.