Financial Management Assignment: Stock Analysis and Ratio Calculations
VerifiedAdded on 2022/08/20
|8
|1518
|13
Homework Assignment
AI Summary
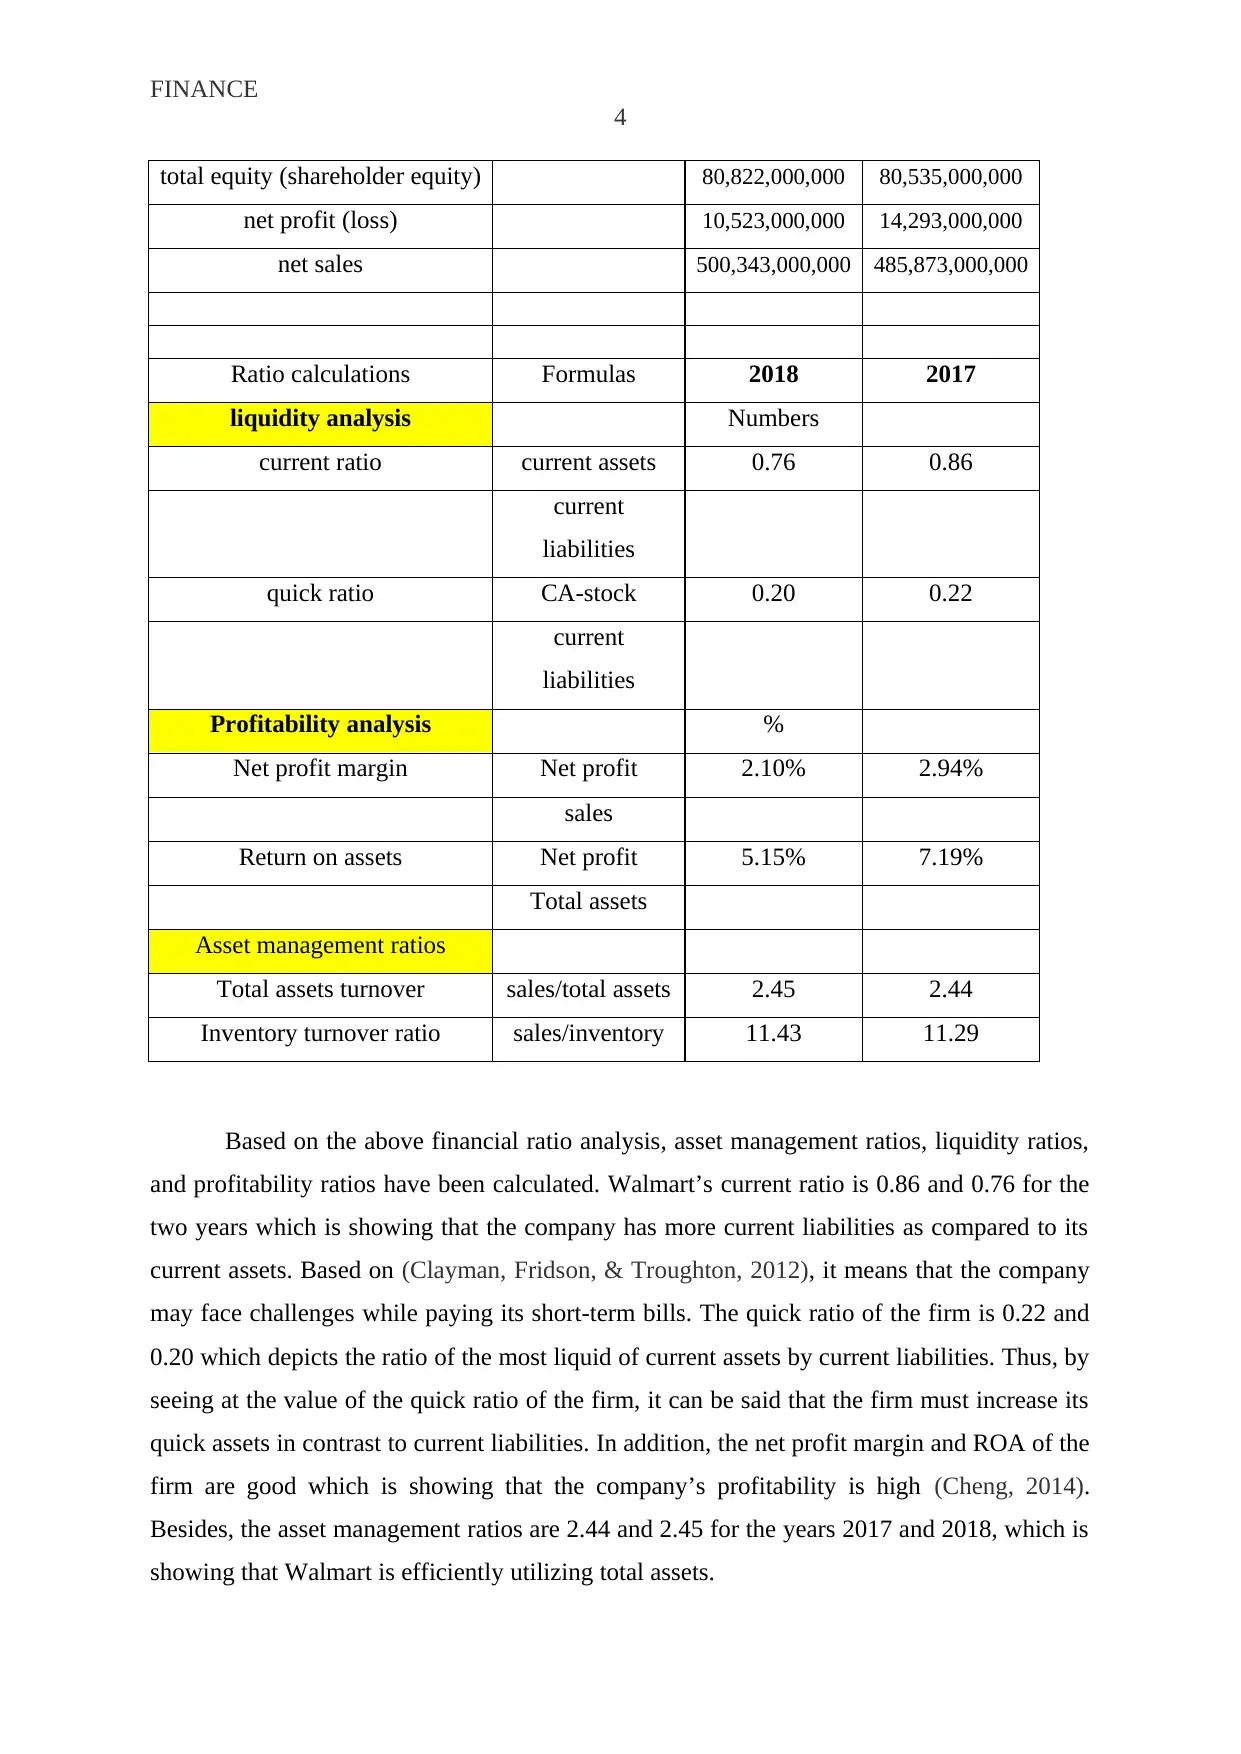
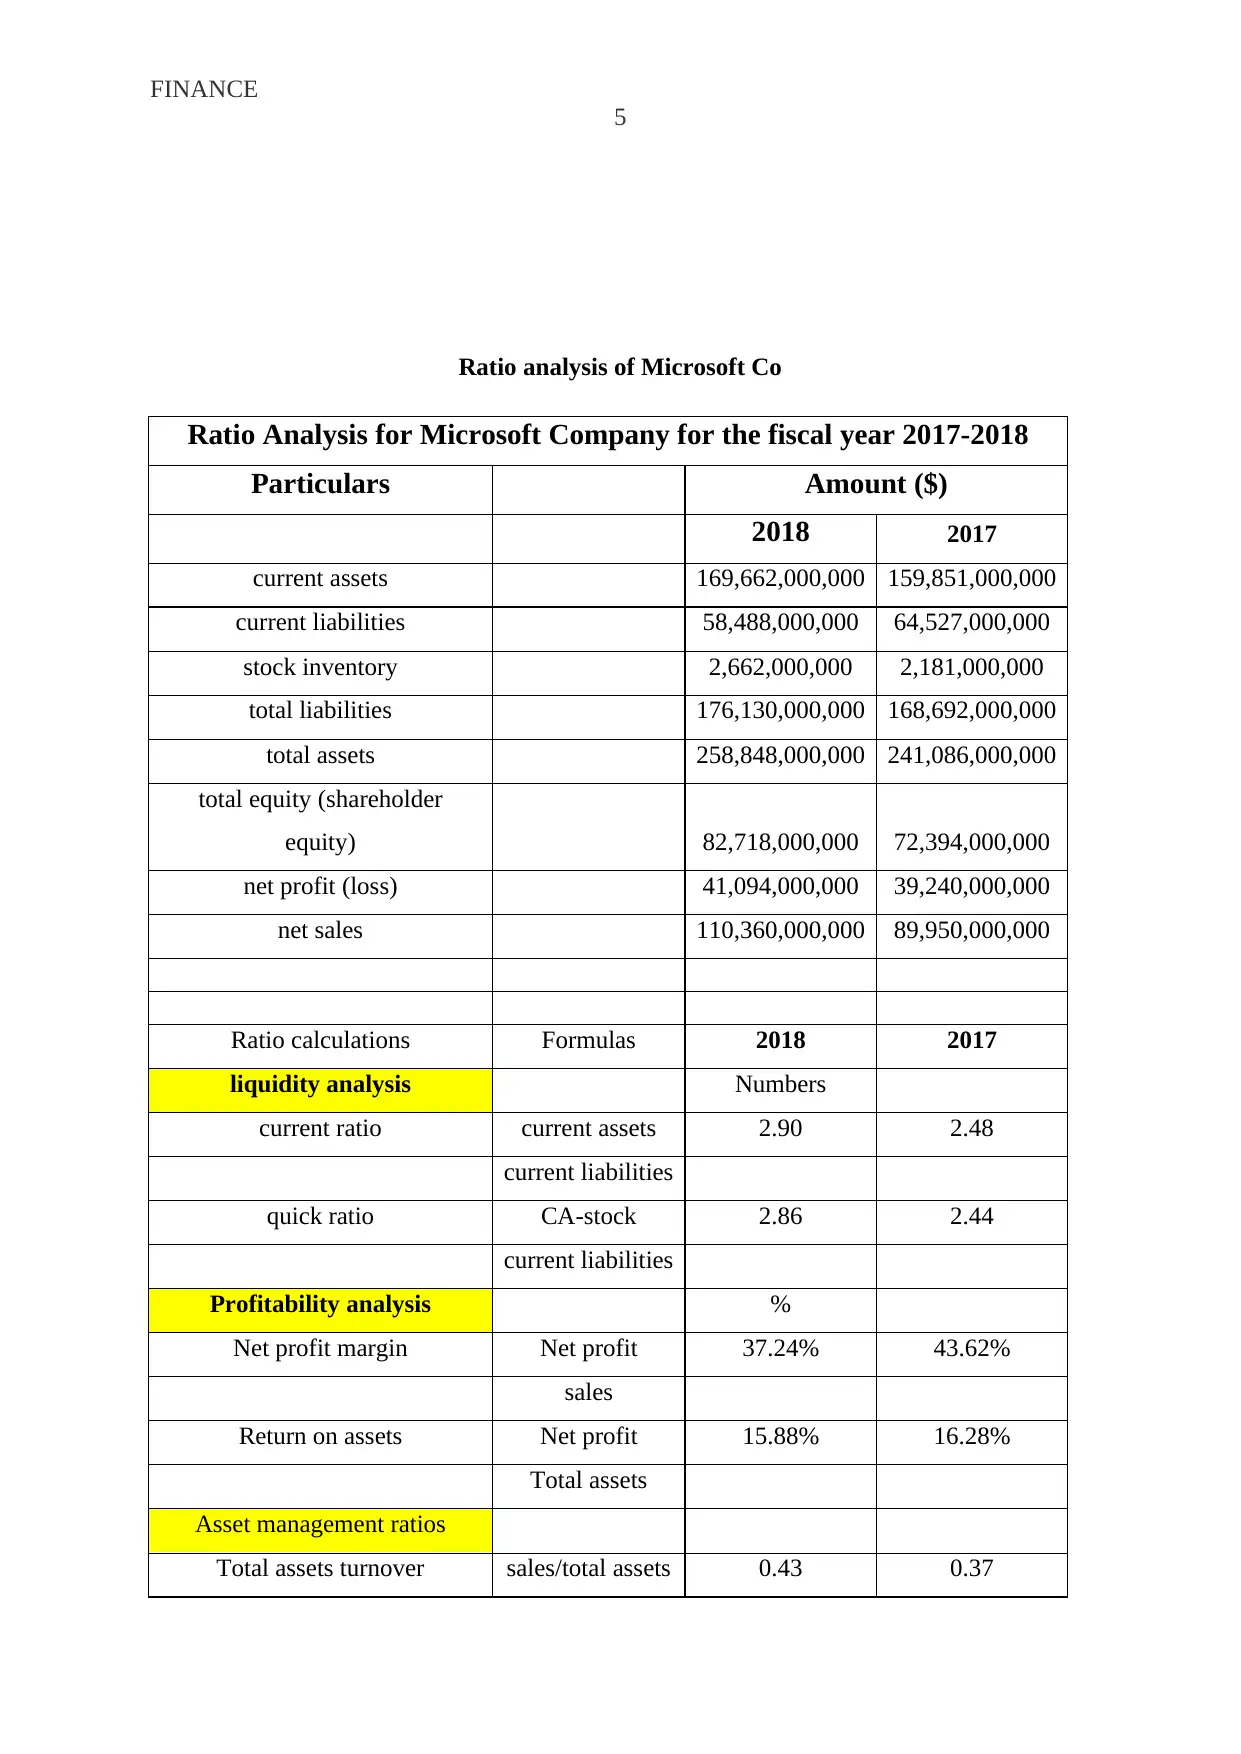
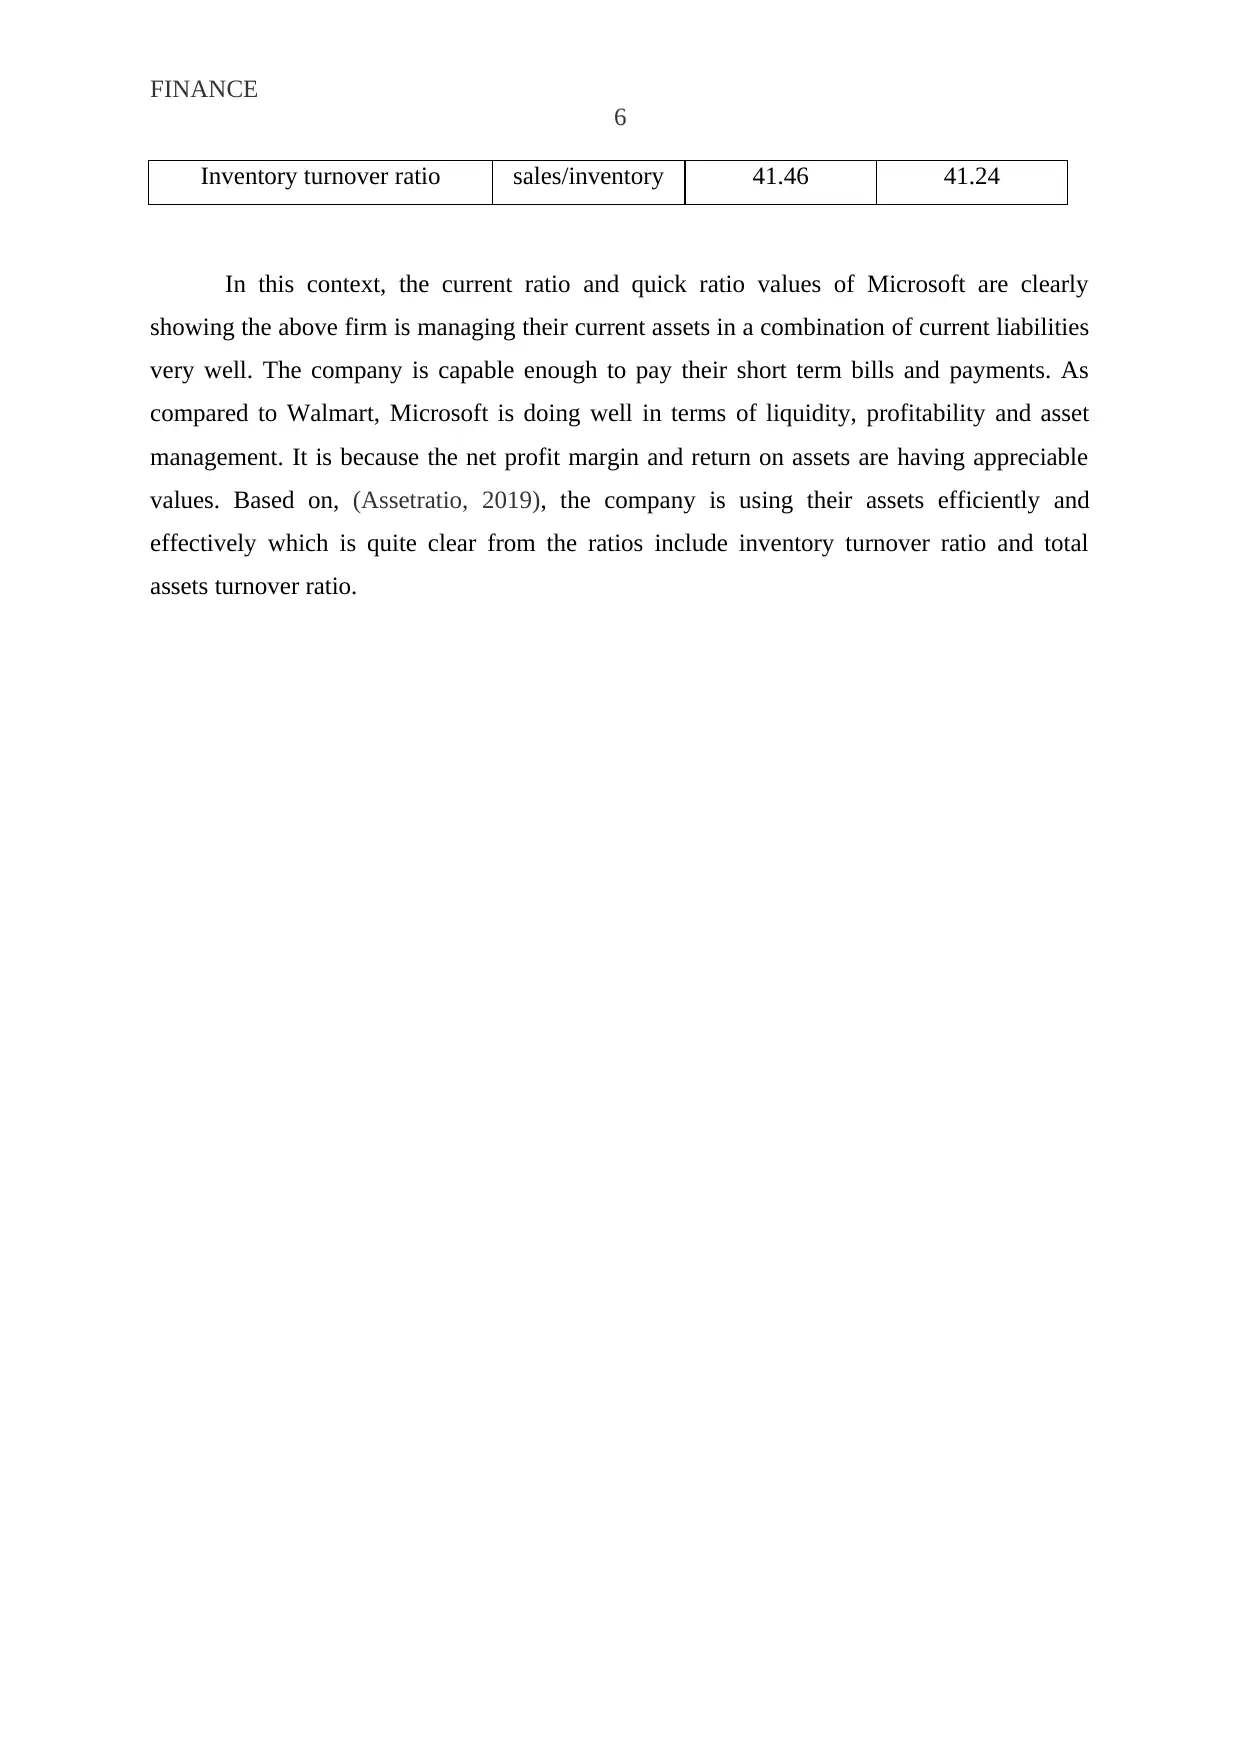
This assignment provides a comprehensive analysis of two major US stock exchanges, the NYSE and NASDAQ. It begins by highlighting their key differences, such as operational methods and the types of stocks traded. The solution then compares Walmart, listed on the NYSE, and Microsoft, traded on the NASDAQ, by calculating their free cash flow for 2015 and 2016, and interpreting the implications of these figures. Further, the assignment delves into a detailed financial ratio analysis for both companies, using 2017 and 2018 financial statements. This includes calculating and interpreting liquidity ratios, asset management ratios, and profitability ratios to identify strengths, weaknesses, and challenges faced by each company, offering a robust understanding of their financial performance. The analysis draws on established financial concepts and supporting references to provide a well-rounded assessment.
1 out of 8


Your All-in-One AI-Powered Toolkit for Academic Success.
+13062052269
info@desklib.com
Available 24*7 on WhatsApp / Email
![[object Object]](/_next/static/media/star-bottom.7253800d.svg)
Copyright © 2020–2026 A2Z Services. All Rights Reserved. Developed and managed by ZUCOL.